SAWE Report - Cal Poly San Luis Obispo
SAWE Report - Cal Poly San Luis Obispo
SAWE Report - Cal Poly San Luis Obispo

Create successful ePaper yourself
Turn your PDF publications into a flip-book with our unique Google optimized e-Paper software.
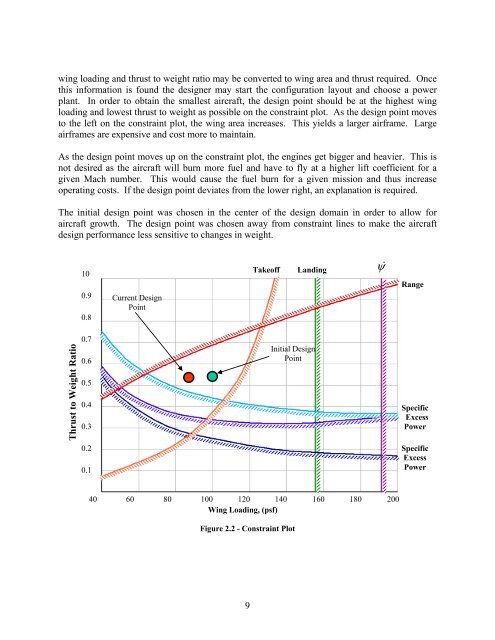
wing loading and thrust to weight ratio may be converted to wing area and thrust required. Once<br />
this information is found the designer may start the configuration layout and choose a power<br />
plant. In order to obtain the smallest aircraft, the design point should be at the highest wing<br />
loading and lowest thrust to weight as possible on the constraint plot. As the design point moves<br />
to the left on the constraint plot, the wing area increases. This yields a larger airframe. Large<br />
airframes are expensive and cost more to maintain.<br />
As the design point moves up on the constraint plot, the engines get bigger and heavier. This is<br />
not desired as the aircraft will burn more fuel and have to fly at a higher lift coefficient for a<br />
given Mach number. This would cause the fuel burn for a given mission and thus increase<br />
operating costs. If the design point deviates from the lower right, an explanation is required.<br />
The initial design point was chosen in the center of the design domain in order to allow for<br />
aircraft growth. The design point was chosen away from constraint lines to make the aircraft<br />
design performance less sensitive to changes in weight.<br />
10<br />
0.9<br />
0.8<br />
Current Design<br />
Point<br />
Takeoff<br />
Landing<br />
ψ<br />
Range<br />
Thrust to Weight Ratio<br />
0.7<br />
0.6<br />
0.5<br />
0.4<br />
0.3<br />
0.2<br />
0.1<br />
Initial Design<br />
Point<br />
Specific<br />
Excess<br />
Power<br />
Specific<br />
Excess<br />
Power<br />
40<br />
60<br />
80<br />
100 120 140<br />
Wing Loading, (psf)<br />
160<br />
180<br />
200<br />
Figure 2.2 - Constraint Plot<br />
9