Using the AmaSeis seismogram viewer and downloading - QuarkNet
Using the AmaSeis seismogram viewer and downloading - QuarkNet
Using the AmaSeis seismogram viewer and downloading - QuarkNet

You also want an ePaper? Increase the reach of your titles
YUMPU automatically turns print PDFs into web optimized ePapers that Google loves.
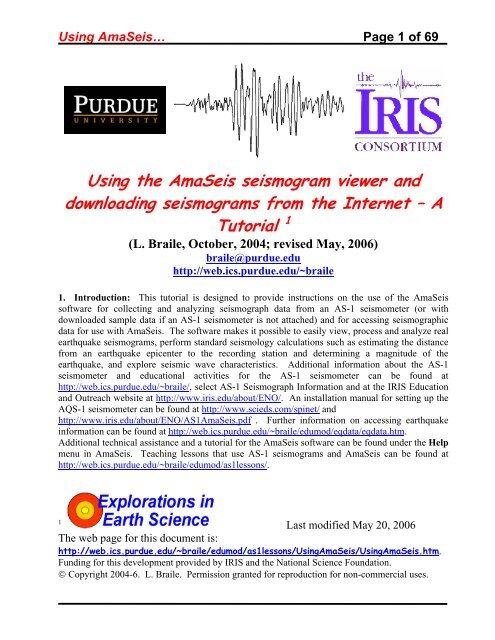
<strong>Using</strong> <strong>AmaSeis</strong>… Page 1 of 69<br />
<strong>Using</strong> <strong>the</strong> <strong>AmaSeis</strong> <strong>seismogram</strong> <strong>viewer</strong> <strong>and</strong><br />
<strong>downloading</strong> <strong>seismogram</strong>s from <strong>the</strong> Internet – A<br />
Tutorial 1<br />
(L. Braile, October, 2004; revised May, 2006)<br />
braile@purdue.edu<br />
http://web.ics.purdue.edu/~braile<br />
1. Introduction: This tutorial is designed to provide instructions on <strong>the</strong> use of <strong>the</strong> <strong>AmaSeis</strong><br />
software for collecting <strong>and</strong> analyzing seismograph data from an AS-1 seismometer (or with<br />
downloaded sample data if an AS-1 seismometer is not attached) <strong>and</strong> for accessing seismographic<br />
data for use with <strong>AmaSeis</strong>. The software makes it possible to easily view, process <strong>and</strong> analyze real<br />
earthquake <strong>seismogram</strong>s, perform st<strong>and</strong>ard seismology calculations such as estimating <strong>the</strong> distance<br />
from an earthquake epicenter to <strong>the</strong> recording station <strong>and</strong> determining a magnitude of <strong>the</strong><br />
earthquake, <strong>and</strong> explore seismic wave characteristics. Additional information about <strong>the</strong> AS-1<br />
seismometer <strong>and</strong> educational activities for <strong>the</strong> AS-1 seismometer can be found at<br />
http://web.ics.purdue.edu/~braile/, select AS-1 Seismograph Information <strong>and</strong> at <strong>the</strong> IRIS Education<br />
<strong>and</strong> Outreach website at http://www.iris.edu/about/ENO/. An installation manual for setting up <strong>the</strong><br />
AQS-1 seismometer can be found at http://www.scieds.com/spinet/ <strong>and</strong><br />
http://www.iris.edu/about/ENO/AS1<strong>AmaSeis</strong>.pdf . Fur<strong>the</strong>r information on accessing earthquake<br />
information can be found at http://web.ics.purdue.edu/~braile/edumod/eqdata/eqdata.htm.<br />
Additional technical assistance <strong>and</strong> a tutorial for <strong>the</strong> <strong>AmaSeis</strong> software can be found under <strong>the</strong> Help<br />
menu in <strong>AmaSeis</strong>. Teaching lessons that use AS-1 <strong>seismogram</strong>s <strong>and</strong> <strong>AmaSeis</strong> can be found at<br />
http://web.ics.purdue.edu/~braile/edumod/as1lessons/.<br />
1 Last modified May 20, 2006<br />
The web page for this document is:<br />
http://web.ics.purdue.edu/~braile/edumod/as1lessons/<strong>Using</strong><strong>AmaSeis</strong>/<strong>Using</strong><strong>AmaSeis</strong>.htm.<br />
Funding for this development provided by IRIS <strong>and</strong> <strong>the</strong> National Science Foundation.<br />
© Copyright 2004-6. L. Braile. Permission granted for reproduction for non-commercial uses.
<strong>Using</strong> <strong>AmaSeis</strong>… Page 2 of 69<br />
This tutorial is available for viewing with a browser (html file) <strong>and</strong> for <strong>downloading</strong> as an MS Word<br />
document or PDF file at <strong>the</strong> following locations:<br />
http://web.ics.purdue.edu/~braile/edumod/as1lessons/<strong>Using</strong><strong>AmaSeis</strong>/<strong>Using</strong><strong>AmaSeis</strong>.htm<br />
http://web.ics.purdue.edu/~braile/edumod/as1lessons/<strong>Using</strong><strong>AmaSeis</strong>/<strong>Using</strong><strong>AmaSeis</strong>.doc<br />
http://web.ics.purdue.edu/~braile/edumod/as1lessons/<strong>Using</strong><strong>AmaSeis</strong>/<strong>Using</strong><strong>AmaSeis</strong>.pdf<br />
Tutorial Contents (click on topic to go directly to that section; use <strong>the</strong> red up arrows to return<br />
to <strong>the</strong> Tutorial Contents):<br />
2. Downloading <strong>the</strong> <strong>AmaSeis</strong> software<br />
2.1 Installing <strong>AmaSeis</strong><br />
2.2 Moving <strong>the</strong> install program to ano<strong>the</strong>r computer<br />
2.3 Updating <strong>AmaSeis</strong><br />
3. <strong>Using</strong> <strong>AmaSeis</strong><br />
3.1 Setting up <strong>AmaSeis</strong> for a computer connected to an AS-1 seismometer<br />
3.2 Setting up <strong>AmaSeis</strong> whe<strong>the</strong>r or not computer is connected to an AS-1<br />
3.3 Extracting <strong>and</strong> saving signals from <strong>the</strong> <strong>AmaSeis</strong> screen display<br />
3.4 Zooming in on <strong>seismogram</strong> in <strong>the</strong> Event screen<br />
3.5 Filtering <strong>seismogram</strong>s with <strong>AmaSeis</strong><br />
3.6 Picking travel times <strong>and</strong> using <strong>the</strong> travel time curve tool in <strong>AmaSeis</strong><br />
3.7 Measuring amplitudes <strong>and</strong> calculating magnitude in <strong>AmaSeis</strong><br />
3.8 Real time playback of <strong>seismogram</strong>s using <strong>AmaSeis</strong><br />
3.9 Analyzing <strong>the</strong> frequency content of <strong>seismogram</strong>s<br />
3.10 Printing from <strong>AmaSeis</strong> screens<br />
3.11 Manually setting <strong>the</strong> <strong>AmaSeis</strong> sampling rate<br />
3.12 Accessing earthquake hypocenter data from <strong>the</strong> Internet<br />
3.13 Calculating distance from an epicenter to your station<br />
3.14 Adding event information to extracted <strong>seismogram</strong>s<br />
3.15 Adding calibration information <strong>and</strong> calculating magnitudes in <strong>AmaSeis</strong><br />
4. Downloading <strong>seismogram</strong>s from SpiNet <strong>and</strong> uploading to SpiNet<br />
4.1 Downloading <strong>seismogram</strong>s from SpiNet<br />
4.2 Uploading <strong>seismogram</strong>s to SpiNet<br />
5. Downloading <strong>seismogram</strong>s from IRIS DMC (using WILBER II)<br />
5.1 Opening WILBER II<br />
5.2 Opening WILBER II from <strong>the</strong> IRIS website<br />
5.3 WILBER II first screen<br />
5.4 Viewing <strong>the</strong> <strong>seismogram</strong>s downloaded from WILBER II using <strong>AmaSeis</strong><br />
6. Downloading pre-assembled data sets<br />
7. Exporting <strong>seismogram</strong>s to <strong>the</strong> Seismic Waves program<br />
7.1 Exporting <strong>seismogram</strong>s<br />
7.2 Displaying <strong>the</strong> <strong>seismogram</strong>s in Seismic Waves<br />
8. Downloading <strong>the</strong> WLIN AS-1 2003.zip seismic data (<strong>and</strong> 2004 <strong>and</strong> 2005)<br />
9. A note on connections to national education st<strong>and</strong>ards<br />
10. References<br />
2. Downloading <strong>the</strong> <strong>AmaSeis</strong> software: To download <strong>the</strong> <strong>AmaSeis</strong> software <strong>and</strong> install it on your<br />
Windows computer, go to http://www.geol.binghamton.edu/faculty/jones/ (Alan Jones’ website,<br />
SUNY, Binghamton) <strong>and</strong> click on <strong>AmaSeis</strong> under Contents/Computer Programs. On <strong>the</strong> resulting
<strong>Using</strong> <strong>AmaSeis</strong>… Page 3 of 69<br />
screen (Figure 1), click on <strong>AmaSeis</strong>. The <strong>AmaSeis</strong> program screen will appear (Figure 2). Click<br />
on <strong>AmaSeis</strong>Setup.exe.<br />
Figure 1. Part of <strong>the</strong> screen image describing <strong>the</strong> <strong>AmaSeis</strong> software from Alan Jones’ website.<br />
Figure 2. Part of <strong>the</strong> screen image describing <strong>the</strong> <strong>AmaSeis</strong> software from Alan Jones’ website.<br />
Selecting <strong>AmaSeis</strong>Setup.exe will open a File Download dialog box (Figure 3); click on Save. It is<br />
convenient to have a folder named Downloads on your desktop for <strong>downloading</strong> programs <strong>and</strong><br />
o<strong>the</strong>r files. Saving <strong>the</strong> install files in this folder makes <strong>the</strong>m available for transfer to ano<strong>the</strong>r<br />
computer or reinstallation (without additional <strong>downloading</strong>) if <strong>the</strong> originally installed software is<br />
corrupted or deleted. If you have previously downloaded files to your Downloads folder, <strong>the</strong> Save<br />
As dialog box (Figure 4) will appear after clicking on Save. If you’ve just created a Downloads<br />
folder, you can navigate to <strong>the</strong> download folder using <strong>the</strong> down arrow symbol to <strong>the</strong> right of <strong>the</strong><br />
“Save in:” line of <strong>the</strong> dialog box (Figure 4) or using <strong>the</strong> up arrow icon to <strong>the</strong> right of <strong>the</strong> “Save in:”<br />
line. In <strong>the</strong> Save As dialog box (Figure 4), click on Save to download <strong>AmaSeis</strong>Setup.exe. After a<br />
short time (depending on <strong>the</strong> speed of your Internet connection), <strong>the</strong> Download Complete dialog<br />
box (Figure 5) will appear. Click on Close.
<strong>Using</strong> <strong>AmaSeis</strong>… Page 4 of 69<br />
Figure 3. File Download dialog box that opens during download of <strong>AmaSeis</strong> software.<br />
Figure 4. Screen image of <strong>the</strong> Save As dialog box during download of <strong>the</strong> <strong>AmaSeis</strong>Setup.exe install<br />
file.
<strong>Using</strong> <strong>AmaSeis</strong>… Page 5 of 69<br />
Figure 5. The Download Complete dialog box after <strong>downloading</strong> <strong>the</strong> <strong>AmaSeis</strong>Setup.exe install<br />
program.<br />
Return to list of contents<br />
2.1 Installing <strong>AmaSeis</strong>: To install <strong>the</strong> <strong>AmaSeis</strong> software on your computer, double-click on<br />
<strong>the</strong> <strong>AmaSeis</strong>Setup.exe icon (Figure 6) <strong>and</strong> <strong>the</strong> <strong>AmaSeis</strong>Setup.exe program will install <strong>AmaSeis</strong><br />
on <strong>the</strong> C: drive of your computer. Follow <strong>the</strong> instructions given during <strong>the</strong> install procedure.<br />
Installation of <strong>AmaSeis</strong> is now complete. For easy <strong>and</strong> rapid access to <strong>AmaSeis</strong>, go to <strong>the</strong><br />
<strong>AmaSeis</strong> folder (Figure 7) <strong>and</strong> right click on <strong>the</strong> as1.exe icon <strong>and</strong> select Create Shortcut. A<br />
shortcut icon, Shortcut to as1.exe, will be created (Figure 7). Drag (or copy <strong>and</strong> paste) this<br />
icon to <strong>the</strong> desktop. To start <strong>AmaSeis</strong>, double click on <strong>the</strong> <strong>AmaSeis</strong> shortcut on your desktop<br />
<strong>and</strong> <strong>the</strong> program will open. If your computer is attached to an AS-1 seismometer, <strong>the</strong> program<br />
will open an information screen, determine <strong>the</strong> sample interval <strong>and</strong> open <strong>the</strong> helicorder<br />
(multiple line display similar to <strong>the</strong> traditional drum recorder paper of an older analog<br />
seismograph; usually 1 line per hour with 24 lines) display for viewing seismic data (ground<br />
motion sensed by <strong>the</strong> seismometer). If your computer is not attached to an AS-1 seismometer,<br />
<strong>the</strong> program will open <strong>the</strong> information screen <strong>and</strong> set <strong>the</strong> sample rate to 6 samples per second<br />
(click OK in <strong>the</strong> dialog box that appears). You are now ready to use <strong>the</strong> <strong>AmaSeis</strong> software to<br />
view, analyze <strong>and</strong> interpret <strong>seismogram</strong>s. Fur<strong>the</strong>r instructions on <strong>the</strong> use of <strong>AmaSeis</strong> are<br />
provided in <strong>the</strong> next section of this tutorial (also see <strong>the</strong> program option descriptions <strong>and</strong> tutorial<br />
in <strong>the</strong> Help menu in <strong>AmaSeis</strong>).
<strong>Using</strong> <strong>AmaSeis</strong>… Page 6 of 69<br />
Figure 6. Part of <strong>the</strong> screen image showing <strong>the</strong> <strong>AmaSeis</strong>Setup.exe install file in <strong>the</strong> Downloads<br />
folder.<br />
Figure 7. Part of a screen image showing <strong>the</strong> <strong>AmaSeis</strong> folder <strong>and</strong> <strong>the</strong> as1.exe (<strong>AmaSeis</strong>) program<br />
icon <strong>and</strong> created shortcut to <strong>AmaSeis</strong>. After running <strong>AmaSeis</strong> with <strong>the</strong> computer connected to an<br />
AS-1 seismometer, a folder (2004) containing archived data will be created in <strong>the</strong> <strong>AmaSeis</strong> folder.<br />
Also shown is a folder (SAC Files) that is used to save <strong>and</strong> organize <strong>seismogram</strong> files (in SAC<br />
format) that have been saved by <strong>the</strong> <strong>AmaSeis</strong> program or downloaded from ano<strong>the</strong>r source.<br />
2.2 Moving <strong>the</strong> install program to ano<strong>the</strong>r computer: <strong>AmaSeis</strong>Setup.exe is an install<br />
program, 1.72 MB in size, <strong>and</strong> can be copied onto a Zip disk, thumb or flash drive or CD <strong>and</strong><br />
moved to ano<strong>the</strong>r computer or emailed as an attachment to ano<strong>the</strong>r machine for installation on<br />
o<strong>the</strong>r computers. Because <strong>the</strong> file is too large to fit on a single floppy disk, <strong>the</strong>re is also <strong>the</strong><br />
option [<strong>AmaSeis</strong>Disk1.exe <strong>and</strong> <strong>AmaSeis</strong>Disk2.exe] to copy <strong>the</strong> install file (from Alan Jones’<br />
website, see Figure 2) onto two floppy disks to move it to ano<strong>the</strong>r computer.<br />
2.3 Updating <strong>AmaSeis</strong>: If you already have installed <strong>AmaSeis</strong> on a computer <strong>and</strong> wish to<br />
update <strong>the</strong> software with <strong>the</strong> latest release of <strong>the</strong> program (new releases sometimes have<br />
additional features not included in <strong>the</strong> version that was initially installed on your computer),<br />
download <strong>the</strong> <strong>AmaSeis</strong>Upgrade.exe file (see Figure 2), place it in your <strong>AmaSeis</strong> folder, <strong>and</strong><br />
double-click on <strong>the</strong> <strong>AmaSeis</strong>Upgrade.exe icon. This program will automatically update your<br />
<strong>AmaSeis</strong> software.)
<strong>Using</strong> <strong>AmaSeis</strong>… Page 7 of 69<br />
3. <strong>Using</strong> <strong>AmaSeis</strong>: The <strong>AmaSeis</strong> program is used to record <strong>and</strong> archive data from <strong>the</strong> AS-1<br />
seismometer. Additionally, <strong>AmaSeis</strong> can be used to view, save, filter, analyze <strong>and</strong> interpret<br />
<strong>seismogram</strong>s. The <strong>seismogram</strong>s may be saved from <strong>the</strong> AS-1 data (continuous output of <strong>the</strong><br />
seismometer) or imported from o<strong>the</strong>r sources (onto your computer whe<strong>the</strong>r or not an AS-1<br />
seismometer is connected). Thus, <strong>AmaSeis</strong> can be used as a <strong>viewer</strong> for display analysis <strong>and</strong><br />
interpretation of earthquake <strong>seismogram</strong>s without an attached AS-1 seismometer.<br />
3.1 Setting up <strong>AmaSeis</strong> for a computer connected to an AS-1 seismometer: Instructions for<br />
setting up an AS-1 seismometer <strong>and</strong> connecting to a computer running <strong>the</strong> <strong>AmaSeis</strong> software<br />
are available in <strong>the</strong> AS-1 <strong>and</strong> <strong>AmaSeis</strong> Manual at:<br />
http://www.scieds.com/spinet/AS1<strong>AmaSeis</strong>_v2.pdf<br />
(or at: http://www.iris.edu/about/ENO/AS1<strong>AmaSeis</strong>.pdf) <strong>and</strong> in <strong>the</strong> online instructions at:<br />
http://web.ics.purdue.edu/~braile/edumod/as1mag/as1mag1.htm. Both resources also contain<br />
descriptions of <strong>the</strong> <strong>AmaSeis</strong> software similar to <strong>the</strong> instructions provided here. If your computer<br />
is connected to an AS-1 seismometer, <strong>the</strong> set-up information should be similar to that shown in<br />
Figures 8 <strong>and</strong> 9.<br />
Figure 8. Continuous record dialog box from <strong>the</strong> Helicorder selection under <strong>the</strong> Settings menu in<br />
<strong>AmaSeis</strong>.<br />
Figure 9. Station Properties dialog box from <strong>the</strong> Station selection under <strong>the</strong> Settings menu in<br />
<strong>AmaSeis</strong>.
<strong>Using</strong> <strong>AmaSeis</strong>… Page 8 of 69<br />
3.2 Setting up <strong>AmaSeis</strong> whe<strong>the</strong>r or not your computer is connected to an AS-1<br />
seismometer: Instructions for setting up an AS-1 seismometer <strong>and</strong> connecting to a computer<br />
running <strong>the</strong> <strong>AmaSeis</strong> software are available in <strong>the</strong> AS-1 <strong>and</strong> <strong>AmaSeis</strong> Manual at:<br />
http://www.iris.edu/about/ENO/AS1<strong>AmaSeis</strong>.pdf <strong>and</strong> in <strong>the</strong> online instructions at:<br />
http://web.ics.purdue.edu/~braile/edumod/as1mag/as1mag1.htm. Both resources also contain<br />
descriptions of <strong>the</strong> <strong>AmaSeis</strong> software similar to <strong>the</strong> instructions provided here. The <strong>AmaSeis</strong><br />
software also includes a Help menu with descriptions of <strong>the</strong> main features of <strong>the</strong> software <strong>and</strong> a<br />
brief tutorial. If your computer is connected to an AS-1 seismometer, <strong>the</strong> set-up information<br />
should be similar to that shown in Figures 8 <strong>and</strong> 9.<br />
If your computer is not connected to an AS-1 seismometer you can download some sample<br />
data (click here to download; ~15MB file, file must be unzipped; instructions are also contained<br />
in section 8 below) <strong>and</strong> use it for selecting <strong>seismogram</strong>s <strong>and</strong> o<strong>the</strong>r <strong>AmaSeis</strong> operations. The<br />
sample data are contained in a folder called 2003. The sample data were recorded at AS-1<br />
station WLIN in West Lafayette, Indiana during <strong>the</strong> month of September, 2003. After<br />
<strong>downloading</strong> <strong>the</strong> folder, place it in your <strong>AmaSeis</strong> folder. (If you have recorded data from an<br />
AS-1 on your computer during 2003, be sure to not copy <strong>the</strong> WLIN 2003 data file over your<br />
2003 folder. You can download <strong>the</strong> WLIN 2003 folder <strong>and</strong> preserve your 2003 folder by<br />
temporarily moving your 2003 folder to ano<strong>the</strong>r folder.) Starting <strong>AmaSeis</strong> will <strong>the</strong>n allow you<br />
to view <strong>the</strong> WLIN September, 2003 data as if it had been recorded on your computer. Enter <strong>the</strong><br />
Helicorder <strong>and</strong> Station properties as shown in Figures 8 <strong>and</strong> 9. To view <strong>the</strong> data on <strong>the</strong> 24hour<br />
(one line per hour) display, scroll back in time using <strong>the</strong> scroll bar at <strong>the</strong> right h<strong>and</strong> side of<br />
<strong>the</strong> screen (Figure 10) or select <strong>the</strong> Go To Date-Time selection under <strong>the</strong> Settings menu to go<br />
to a specific position in <strong>the</strong> data archive (such as 9/22/03, 14 hours – <strong>the</strong> data <strong>and</strong> time refer to<br />
<strong>the</strong> bottom line of <strong>the</strong> screen – for <strong>the</strong> display shown in Figure 10). Information on <strong>the</strong><br />
earthquakes producing significant signals on <strong>the</strong> seismograph recorded by <strong>the</strong> WLIN station<br />
during September, 2003 is contained in <strong>the</strong> station catalog shown in Figure 11. Additionally,<br />
higher than normal noise levels (Figure 12) are recorded at WLIN on September 18-19, 2003<br />
due to microseisms (caused by high ocean waves hitting <strong>the</strong> east coast of <strong>the</strong> U.S.; hurricane<br />
Isabel had maximum winds of about 260 km/hr <strong>and</strong> hit <strong>the</strong> coastline in North Carolina on<br />
September 18-19) due to hurricane Isabel. Additional data for 2004 <strong>and</strong> 2005 are also available<br />
(see section 8 below).<br />
When a seismic signal from an unknown earthquake appears on <strong>the</strong> <strong>AmaSeis</strong> screen (such as<br />
shown in Figure 10), it is necessary to associate <strong>the</strong> <strong>seismogram</strong> with a particular event. In<br />
general, unless <strong>the</strong> earthquake is very close to your station, <strong>the</strong> record will have been created by<br />
a moderate to large earthquake. To determine which earthquake has been recorded <strong>and</strong> <strong>the</strong><br />
location, origin time <strong>and</strong> magnitude for <strong>the</strong> event, one can find information about earthquakes<br />
that have occurred around <strong>the</strong> world by accessing USGS or IRIS websites. Information on<br />
recent earthquakes is easily found at <strong>the</strong> USGS earthquake page, http://earthquake.usgs.gov/, or<br />
<strong>the</strong> IRIS Seismic Monitor, http://www.iris.edu/seismon/. For older events, instructions for<br />
searching earthquake catalogs for events of interest are provided at:<br />
http://web.ics.purdue.edu/~braile/edumod/eqdata/eqdata.htm. Also, see <strong>the</strong> instructions in<br />
section 3.12 of this document.
<strong>Using</strong> <strong>AmaSeis</strong>… Page 9 of 69<br />
Figure 10. Sample <strong>AmaSeis</strong> 24-hour screen display (data recorded by AS-1 station WLIN in West<br />
Lafayette, IN during September, 2003). The event visible in <strong>the</strong> middle of <strong>the</strong> screen is <strong>the</strong> 9/22/03<br />
M6.5 Dominican Republic earthquake.<br />
Figure 11. A portion of <strong>the</strong> station catalog for WLIN showing information on <strong>the</strong> earthquakes<br />
recorded during September, 2003. Also, seismic signals from hurricane Isabelle are included for<br />
September 18-19, 2003 (Figure 12).
<strong>Using</strong> <strong>AmaSeis</strong>… Page 10 of 69<br />
Figure 12. Screen image of <strong>AmaSeis</strong> 24-hour display for AS-1 station WLIN for September 17-18,<br />
2003. The increased noise level beginning at about 10 hours (UTC), 9/18/03 (<strong>and</strong> continuing into<br />
9/19/03, not shown here) is due to microseisms from hurricane Isabel.<br />
3.3 Extracting (selecting <strong>seismogram</strong>s) <strong>and</strong> saving signals from <strong>the</strong> <strong>AmaSeis</strong> helicorder<br />
(normal screen) display: To select a portion of <strong>the</strong> screen for “close-up” viewing or to save a<br />
selected signal, use <strong>the</strong> mouse (click <strong>and</strong> drag over desired lines of data) to highlight a specific<br />
area of <strong>the</strong> screen (Figure 13); <strong>the</strong>n click on <strong>the</strong> Extract Earthquake icon (Figure 14). For<br />
example, <strong>the</strong> selected event shown in Figure 13 (<strong>the</strong> 9/22/03 magnitude 6.5 Dominican Republic<br />
earthquake) results in <strong>the</strong> <strong>seismogram</strong> (Event view) shown in Figure 15 (after clicking on <strong>the</strong><br />
Extract Earthquake icon). Notice that only <strong>the</strong> selected signal is shown <strong>and</strong> that <strong>the</strong> signal is<br />
magnified to approximately fill <strong>the</strong> screen. Any length signal can be selected <strong>and</strong> shown as an<br />
extracted <strong>seismogram</strong> in order to better observe <strong>the</strong> characteristics of <strong>the</strong> signal. Note that <strong>the</strong><br />
horizontal scale shows <strong>the</strong> time in minutes. The Time Expansion arrows in <strong>the</strong> lower left h<strong>and</strong><br />
corner of <strong>the</strong> Event view can be used to decrease <strong>the</strong> time range of <strong>the</strong> data that are viewed. The<br />
vertical scale shows signal amplitude in digital units. The time <strong>and</strong> amplitude of any point on<br />
<strong>the</strong> signal can be measured by placing <strong>the</strong> tip of <strong>the</strong> mouse on that point. The amplitude will be<br />
displayed in <strong>the</strong> small window at <strong>the</strong> lower right h<strong>and</strong> corner of <strong>the</strong> screen. The time
<strong>Using</strong> <strong>AmaSeis</strong>… Page 11 of 69<br />
corresponding to <strong>the</strong> mouse cursor location will be displayed in <strong>the</strong> small window to <strong>the</strong> left of<br />
<strong>the</strong> amplitude window.<br />
Figure 13. A portion of <strong>the</strong> <strong>AmaSeis</strong> helicorder display showing a selected signal (<strong>seismogram</strong>).<br />
Figure 14. Portion of <strong>the</strong> <strong>AmaSeis</strong> helicorder display showing <strong>the</strong> Extract Earthquake icon<br />
(wiggly line).<br />
To save <strong>the</strong> <strong>seismogram</strong>, select <strong>the</strong> Save As option from <strong>the</strong> File menu in <strong>the</strong> Event view (as in<br />
Figure 15) <strong>and</strong> a Save As dialog box (Figure 16) will appear. Enter a file name for <strong>the</strong><br />
<strong>seismogram</strong> (also be sure that <strong>the</strong> file is saved in .sac format by using <strong>the</strong> down arrow key to <strong>the</strong><br />
right of <strong>the</strong> Save as type selection at <strong>the</strong> bottom of <strong>the</strong> screen to select <strong>the</strong> SAC format) <strong>and</strong><br />
click on <strong>the</strong> Save button. Any file name can be used but <strong>the</strong> naming convention used for<br />
uploading data to <strong>the</strong> SpiNet website is convenient. In this naming convention, <strong>the</strong> first two<br />
digits are <strong>the</strong> year, <strong>the</strong> next two digits are <strong>the</strong> month, <strong>the</strong> next two digits are <strong>the</strong> day, <strong>the</strong> next<br />
two digits are <strong>the</strong> hour (24-hour system, UTC or GMT), <strong>and</strong> <strong>the</strong> next four characters are <strong>the</strong> AS-<br />
1 station code. For example, for <strong>the</strong> <strong>seismogram</strong> shown in Figure 15, <strong>the</strong> name would be<br />
03092204WLIN.sac (Figure 16). The .sac extension indicates that <strong>the</strong> format of <strong>the</strong> <strong>seismogram</strong><br />
file is SAC – corresponding to <strong>the</strong> Seismic Analysis Code format. This is simply a binary file<br />
format that has become a st<strong>and</strong>ard for seismic files in general <strong>and</strong> AS-1 seismograph files in<br />
particular. <strong>AmaSeis</strong> writes <strong>and</strong> reads SAC files <strong>and</strong> SAC files can be uploaded to <strong>and</strong><br />
downloaded from <strong>the</strong> SpiNet website. It is convenient to create a folder called SAC Files<br />
within <strong>the</strong> <strong>AmaSeis</strong> folder for storing your saved or downloaded SAC format <strong>seismogram</strong>s. Of<br />
course you can also use sub-folders within <strong>the</strong> SAC Files folder to fur<strong>the</strong>r organize <strong>the</strong><br />
<strong>seismogram</strong>s according to events, year, source or station, etc. You can download <strong>the</strong> WLIN<br />
AS-1 <strong>seismogram</strong> shown in Figure 16 by clicking here (or from <strong>the</strong> SpiNet website). Use <strong>the</strong><br />
back button (or close <strong>the</strong> window) to return to <strong>the</strong> helicorder display.<br />
To open a <strong>seismogram</strong> that is stored in your SAC Files folder, use <strong>the</strong> Open selection under <strong>the</strong><br />
File menu in <strong>AmaSeis</strong>. A dialog box similar to that shown in Figure 17 will appear. If <strong>the</strong><br />
opened folder is not <strong>the</strong> SAC Files folder, navigate to that location, select <strong>the</strong> <strong>seismogram</strong> to<br />
open <strong>and</strong> <strong>the</strong>n click Open. For example, for <strong>the</strong> file shown in <strong>the</strong> Open dialog box in Figure<br />
17, <strong>the</strong> <strong>seismogram</strong> shown in Figure 15 will be opened in <strong>the</strong> <strong>AmaSeis</strong> Event screen.
<strong>Using</strong> <strong>AmaSeis</strong>… Page 12 of 69<br />
Figure 15. Extracted signal (<strong>seismogram</strong> shown in Event view) from <strong>the</strong> selection shown in Figure<br />
13.<br />
Figure 16. Save As dialog box (open from <strong>the</strong> <strong>AmaSeis</strong> File menu) used to enter a file name <strong>and</strong><br />
file type (SAC) for <strong>the</strong> selected <strong>seismogram</strong> to save (for example, <strong>the</strong> <strong>seismogram</strong> selected as shown<br />
in Figure 13 <strong>and</strong> displayed in Figure 15).
<strong>Using</strong> <strong>AmaSeis</strong>… Page 13 of 69<br />
Figure 17. Open dialog box (open from <strong>the</strong> <strong>AmaSeis</strong> File menu) used to open a <strong>seismogram</strong> file.<br />
3.4 Zooming in on <strong>seismogram</strong> in <strong>the</strong> Event screen: To fur<strong>the</strong>r zoom in on a <strong>seismogram</strong>,<br />
use <strong>the</strong> mouse cursor to select (click <strong>and</strong> drag over a time range) an area of <strong>the</strong> <strong>seismogram</strong> in<br />
<strong>the</strong> Event screen as shown in Figure 18. Clicking on <strong>the</strong> Extract Earthquake icon (Figure 14)<br />
opens <strong>the</strong> Event screen with <strong>the</strong> “zoomed in” <strong>seismogram</strong> (Figure 19). This new <strong>seismogram</strong><br />
can also be saved as a SAC file as described in section 3.2. This zooming option is very useful<br />
for selecting specific parts of <strong>the</strong> <strong>seismogram</strong> (“phases” or “arrivals”) used to estimate <strong>the</strong><br />
magnitude of an earthquake <strong>and</strong> for adjusting <strong>the</strong> length of a <strong>seismogram</strong>, particularly one that<br />
has been downloaded <strong>and</strong> may be of longer time duration than desired.
<strong>Using</strong> <strong>AmaSeis</strong>… Page 14 of 69<br />
Figure 18. Selected time range (using mouse cursor) for zooming in on a <strong>seismogram</strong>.
<strong>Using</strong> <strong>AmaSeis</strong>… Page 15 of 69<br />
Figure 19. Extracted <strong>seismogram</strong> from <strong>the</strong> selection shown in Figure 18.<br />
3.5 Filtering <strong>seismogram</strong>s with <strong>AmaSeis</strong>: Filtering is a digital signal processing operation<br />
that is designed to enhance features of <strong>the</strong> <strong>seismogram</strong> that have certain frequency content.<br />
Commonly, certain arrivals (P-waves, S-waves, surface waves, etc.) have more or less distinct<br />
frequency characteristics <strong>and</strong> can be enhanced (or reduced) by filtering. Fur<strong>the</strong>r, some types of<br />
noise on <strong>seismogram</strong>s are characterized by specific frequencies that can be reduced with<br />
appropriate filtering. One of <strong>the</strong> most useful applications of filtering of <strong>seismogram</strong>s is to<br />
enhance <strong>the</strong> S-wave to better identify this arrival on <strong>the</strong> <strong>seismogram</strong>. To apply filtering, select<br />
<strong>the</strong> Filter option from <strong>the</strong> Control menu in <strong>AmaSeis</strong>. A dialog box (Filter Dialog, Figure 20)<br />
will appear. The filter settings shown in <strong>the</strong> dialog box in Figure 20 have been found to be<br />
useful for enhancing <strong>the</strong> S-wave arrival. For example, for <strong>the</strong> Dominican Republic <strong>seismogram</strong><br />
shown in Figure 19, <strong>the</strong> filter cutoffs shown in Figure 20 were applied (enter <strong>the</strong> filter cutoff<br />
frequencies <strong>and</strong> click on OK) resulting in <strong>the</strong> filtered <strong>seismogram</strong> shown in Figure 21. Note<br />
that <strong>the</strong> S-wave (at about 04:58 time, UTC) is much more distinct in <strong>the</strong> filtered <strong>seismogram</strong>.<br />
The S-wave is identified on <strong>the</strong> <strong>seismogram</strong> in Figure 21 by both strong relative amplitude <strong>and</strong> a<br />
change in frequency (to a somewhat lower frequency, visible by <strong>the</strong> greater time between up<br />
<strong>and</strong> down motions).
<strong>Using</strong> <strong>AmaSeis</strong>… Page 16 of 69<br />
Figure 20. Filter Dialog box showing filter cutoff settings appropriate to enhancing <strong>the</strong> S-waves<br />
(<strong>and</strong> <strong>the</strong> surface waves) on AS-1 <strong>seismogram</strong>s. Due to <strong>the</strong> sampling interval of AS-1 seismic data,<br />
<strong>the</strong> Highest frequency cutoff should be set no higher than 3 Hz (cycles per second).<br />
Figure 21. Filtered Dominican Republic earthquake <strong>seismogram</strong> showing enhanced S-wave<br />
arrival. Compare with <strong>the</strong> <strong>seismogram</strong> shown in Figure 19.<br />
3.6 Picking travel times <strong>and</strong> using <strong>the</strong> travel time curve tool in <strong>AmaSeis</strong>: Picking arrival<br />
times of seismic phases is easily accomplished with <strong>the</strong> <strong>AmaSeis</strong> software. Select <strong>the</strong> Pick<br />
arrivals icon (Figure 22) <strong>and</strong> <strong>the</strong>n position <strong>the</strong> mouse cursor on <strong>the</strong> <strong>seismogram</strong> at <strong>the</strong>
<strong>Using</strong> <strong>AmaSeis</strong>… Page 17 of 69<br />
interpreted location of an arrival. The time window in <strong>the</strong> lower right h<strong>and</strong> corner of <strong>the</strong><br />
<strong>AmaSeis</strong> screen will display <strong>the</strong> arrival time. Clicking on <strong>the</strong> <strong>seismogram</strong> will mark <strong>the</strong><br />
location of <strong>the</strong> arrival time with a red vertical line. More than one arrival time can be picked.<br />
An example is shown in Figure 23.<br />
Figure 22. The Pick arrivals icon (<strong>seismogram</strong> with vertical line) in <strong>the</strong> <strong>AmaSeis</strong> Event screen<br />
display.<br />
Figure 23. Seismogram after picking arrival times (by clicking with <strong>the</strong> mouse cursor) at <strong>the</strong><br />
interpreted P-wave arrival (at about 04:53:05) <strong>and</strong> S-wave arrival (at about 04:57:30).<br />
One use of <strong>the</strong> arrival time picking tool is using <strong>the</strong> P <strong>and</strong> S arrival times to estimate <strong>the</strong><br />
distance of <strong>the</strong> event from <strong>the</strong> seismograph station. Because P- <strong>and</strong> S- waves in <strong>the</strong> Earth travel<br />
similar paths to <strong>the</strong> same station but travel at different speeds, <strong>the</strong> difference between <strong>the</strong> S <strong>and</strong><br />
<strong>the</strong> P times (called <strong>the</strong> S minus P time) is directly related to <strong>the</strong> epicenter-to-station distance. To<br />
use <strong>the</strong> S minus P time to determine this distance (for events less than about 120 degrees away –<br />
two-thirds of <strong>the</strong> way to <strong>the</strong> opposite side of <strong>the</strong> Earth or less than about 13343 km), pick <strong>the</strong> P
<strong>Using</strong> <strong>AmaSeis</strong>… Page 18 of 69<br />
<strong>and</strong> S times (on <strong>seismogram</strong>s that have identifiable S arrivals) as shown in Figure 23 <strong>and</strong> <strong>the</strong>n<br />
click on <strong>the</strong> Travel Time Curves icon (Figure 24). A Depth Dialog box (Figure 25 will appear.<br />
If <strong>the</strong> depth of focus of <strong>the</strong> earthquake is known, enter that depth (in km). If <strong>the</strong> depth isn’t<br />
known, a common selection is to use 33 km as <strong>the</strong> depth, particularly is <strong>the</strong> <strong>seismogram</strong> displays<br />
prominent surface waves indicating that it is of relatively shallow focus.<br />
Figure 24. Travel Time Curves selection icon (curved line with <strong>the</strong> letter “P” next to it) in <strong>the</strong><br />
<strong>AmaSeis</strong> Event screen display.<br />
Figure 25. Depth Dialog box. Input a depth for <strong>the</strong> earthquake (in this case 10 km for <strong>the</strong><br />
Dominican Republic event). If <strong>the</strong> depth is unknown, use a “st<strong>and</strong>ard” depth (33 km) if <strong>the</strong><br />
earthquake appears to be shallow (surface waves are prominent in <strong>the</strong> <strong>seismogram</strong>).<br />
Next, click OK <strong>and</strong> <strong>the</strong> <strong>seismogram</strong> will be displayed in red overlaying <strong>the</strong> st<strong>and</strong>ard travel time<br />
curves for <strong>the</strong> Earth calculated for <strong>the</strong> selected depth of focus. The travel time curves show <strong>the</strong><br />
typical travel times (arrival times minus origin time – <strong>the</strong> time of <strong>the</strong> initiation of <strong>the</strong><br />
earthquake) for P, S, <strong>and</strong> o<strong>the</strong>r arrivals. More information about travel time curves can be found<br />
in Bolt (1993) or Shearer (1999). (Travel time curves are most often displayed with <strong>the</strong> distance<br />
on <strong>the</strong> horizontal axis <strong>and</strong> time on <strong>the</strong> vertical axis. The curves are displayed with <strong>the</strong> opposite<br />
convention in <strong>AmaSeis</strong> so that <strong>the</strong> <strong>seismogram</strong>s will be viewed with time increasing to <strong>the</strong><br />
right.) The <strong>seismogram</strong> on <strong>the</strong> screen can be moved by clicking <strong>and</strong> dragging with <strong>the</strong> mouse.<br />
By positioning <strong>the</strong> <strong>seismogram</strong> so that <strong>the</strong> P wave (<strong>the</strong> first arrival) time overlays <strong>the</strong> P wave<br />
travel time curve <strong>and</strong> <strong>the</strong> S wave time overlays <strong>the</strong> S wave travel time curve (Figure 26). The<br />
epicenter-to-station distance is determined (assuming that <strong>the</strong> P <strong>and</strong> S arrival times have been<br />
accurately identified <strong>and</strong> that <strong>the</strong> depth of focus is approximately correct; note that <strong>the</strong> absolute<br />
times arrival times are not required, on <strong>the</strong> difference between <strong>the</strong> S <strong>and</strong> <strong>the</strong> P times) by <strong>the</strong> S<br />
minus P times (<strong>the</strong> S <strong>and</strong> <strong>the</strong> P times on <strong>the</strong> <strong>seismogram</strong> will only match <strong>the</strong> travel time curves<br />
at one location on <strong>the</strong> screen corresponding to <strong>the</strong> epicenter-to-station distance that is displayed<br />
(in degrees geocentric angle; one degree is 111.19 km along <strong>the</strong> surface) to <strong>the</strong> left of <strong>the</strong><br />
<strong>seismogram</strong>. This S minus P method distance tool can be used to locate an earthquake’s<br />
epicenter by triangulation using <strong>the</strong> distances from 3 separate stations recording <strong>the</strong> same event.<br />
More information on using <strong>AmaSeis</strong> in <strong>the</strong> S minus P location method can be found at:<br />
http://web.ics.purdue.edu/~braile/edumod/as1mag/as1mag2.htm. To compare <strong>the</strong> distance<br />
estimated be <strong>the</strong> S minus P times for an earthquake with <strong>the</strong> actual distance, you can calculate<br />
<strong>the</strong> distance from <strong>the</strong> epicenter to your station using <strong>the</strong> online distance calculation tool<br />
provided by <strong>the</strong> USGS (http://neic.usgs.gov/neis/travel_times/). This online tool is described<br />
fur<strong>the</strong>r in section 3.13. To calculate this distance (in degrees geocentric angle), <strong>the</strong> station<br />
coordinates (latitude <strong>and</strong> longitude) must be known <strong>and</strong> <strong>the</strong> epicenter coordinates must also be
<strong>Using</strong> <strong>AmaSeis</strong>… Page 19 of 69<br />
known. If <strong>the</strong> epicenter location is not known, one can perform a search to obtain information<br />
about <strong>the</strong> earthquake using <strong>the</strong> online catalogs <strong>and</strong> tool described in section 3.12.<br />
The arrival time for any location on <strong>the</strong> extracted <strong>seismogram</strong> screen can be found using<br />
<strong>AmaSeis</strong> by placing <strong>the</strong> cursor at <strong>the</strong> desired location on <strong>the</strong> trace. The time corresponding to<br />
that position will be displayed in <strong>the</strong> second window from <strong>the</strong> lower right h<strong>and</strong> corner of <strong>the</strong><br />
screen as shown in Figure 23 (<strong>the</strong> displayed time reads 5 hours, 0 minutes <strong>and</strong> ten seconds). An<br />
additional example is shown in Figure 27 in which <strong>the</strong> cursor location (at <strong>the</strong> peak of an arrival)<br />
is shown. For this example, <strong>the</strong> location of <strong>the</strong> cursor is at 4:53:09 (UTC) <strong>and</strong> amplitude 146<br />
(digital units) as indicated in <strong>the</strong> time <strong>and</strong> amplitude windows shown in <strong>the</strong> lower right h<strong>and</strong><br />
corner f <strong>the</strong> extracted <strong>seismogram</strong> screen. The time displayed should be UTC (or GMT) time<br />
<strong>and</strong> will be accurate if <strong>the</strong> computer clock for <strong>the</strong> computer that recorded <strong>the</strong> seismic data using<br />
<strong>AmaSeis</strong> was synchronized to UTC time. A convenient way to synchronize <strong>the</strong> computer clock<br />
if your computer is connected to <strong>the</strong> Internet is to use <strong>the</strong> software tool AboutTime<br />
(http://www.arachnoid.com/) or similar tools. More information about time synchronization for<br />
<strong>the</strong> AS-1 seismograph <strong>and</strong> <strong>the</strong> <strong>AmaSeis</strong> software is provided at:<br />
http://web.ics.purdue.edu/~braile/edumod/as1mag/as1mag1.htm.<br />
Figure 26. Seismogram with arrival time picks (vertical lines) on <strong>the</strong> travel time curves (Travel<br />
Time Curves display in <strong>AmaSeis</strong>). The <strong>seismogram</strong> can be moved with <strong>the</strong> mouse cursor (click <strong>and</strong><br />
drag) to position it so that <strong>the</strong> P- <strong>and</strong> S-arrival times are aligned with <strong>the</strong> P- <strong>and</strong> S-travel time<br />
curves. The inferred epicenter-to-station distance (in degrees geocentric angle; one degree =
<strong>Using</strong> <strong>AmaSeis</strong>… Page 20 of 69<br />
111.19 km distance along <strong>the</strong> Earth’s surface) is <strong>the</strong>n given to <strong>the</strong> left of <strong>the</strong> <strong>seismogram</strong> (from <strong>the</strong><br />
distance scale). The horizontal scale is time in minutes after <strong>the</strong> earthquake.<br />
3.7 Measuring amplitudes in <strong>AmaSeis</strong> <strong>and</strong> calculating magnitude: The amplitude of arrivals<br />
on extracted <strong>seismogram</strong>s can be measured using <strong>the</strong> mouse cursor <strong>and</strong> <strong>the</strong> <strong>AmaSeis</strong> software.<br />
Positioning <strong>the</strong> mouse on <strong>the</strong> peak of an arrival displays <strong>the</strong> amplitude in a window in <strong>the</strong> lower<br />
right h<strong>and</strong> corner of <strong>the</strong> screen as illustrated in Figure 27. If <strong>the</strong> amplitude of <strong>the</strong> “zero line”<br />
(<strong>the</strong> <strong>seismogram</strong> amplitude prior to <strong>the</strong> first arrival) is approximately zero amplitude, <strong>the</strong>n <strong>the</strong><br />
amplitude displayed is <strong>the</strong> amplitude of <strong>the</strong> arrival. If <strong>the</strong> “zero line” is not near zero amplitude,<br />
<strong>the</strong> difference between <strong>the</strong> arrival (peak) amplitude <strong>and</strong> <strong>the</strong> zero line amplitude is <strong>the</strong> amplitude<br />
of <strong>the</strong> arrival. Amplitudes can be measured at any location on <strong>the</strong> <strong>seismogram</strong>. However, to<br />
calculate <strong>the</strong> magnitude of an earthquake, <strong>the</strong> amplitudes of <strong>the</strong> P-wave arrival, <strong>the</strong> 20-second<br />
surface wave arrival, or <strong>the</strong> amplitude of <strong>the</strong> mbLg wave arrival can be measured <strong>and</strong> used to<br />
calculate magnitude estimates. Magnitudes can be calculated using <strong>the</strong> online AS-1 magnitude<br />
tool MagCalc at:<br />
http://web.ics.purdue.edu/~braile/edumod/MagCalc/MagCalc.htm.<br />
For <strong>the</strong> example <strong>seismogram</strong> shown in Figure 27, <strong>the</strong> MagCalc AS-1 magnitude tool calculated<br />
a body wave magnitude of 6.3 from <strong>the</strong> measured amplitude of <strong>the</strong> AS-1 <strong>seismogram</strong>. The<br />
official body wave magnitude (mb) reported by <strong>the</strong> US Geological Survey was 6.1. More<br />
information, including additional examples, about measuring amplitudes <strong>and</strong> calculating<br />
magnitudes using <strong>AmaSeis</strong> <strong>and</strong> <strong>the</strong> MagCalc tool can be found at <strong>the</strong> MagCalc link, at:<br />
http://web.ics.purdue.edu/~braile/edumod/as1mag/as1mag3.htm, <strong>and</strong> at:<br />
http://web.ics.purdue.edu/~braile/edumod/MagCalc/AS1Results.htm.<br />
Magnitude information (as well as location, origin time <strong>and</strong> o<strong>the</strong>r information about an<br />
earthquake) can be found on <strong>the</strong> Internet as described in section 3.12. The epicenter to station<br />
distance is also required to calculate <strong>the</strong> magnitude. This distance can be determined using <strong>the</strong><br />
online tools described in section 3.13 or estimated from <strong>the</strong> S minus P arrival times (for<br />
<strong>seismogram</strong>s with distinct S arrivals) as described in section 3.6.
<strong>Using</strong> <strong>AmaSeis</strong>… Page 21 of 69<br />
Figure 27. <strong>AmaSeis</strong> screen image showing <strong>seismogram</strong> (“zoomed in” on <strong>the</strong> P arrival using<br />
extraction tool) <strong>and</strong> <strong>the</strong> use of <strong>the</strong> amplitude measuring capability of <strong>the</strong> software. The amplitude<br />
(146 digital units) of <strong>the</strong> mouse location is displayed in <strong>the</strong> window in <strong>the</strong> lower right h<strong>and</strong> corner<br />
of <strong>the</strong> screen. The <strong>seismogram</strong> is from <strong>the</strong> September 22, 2003 Dominican Republic earthquake.<br />
3.8 Real time playback of <strong>seismogram</strong>s using <strong>AmaSeis</strong>: Extracted or saved <strong>seismogram</strong>s can<br />
be played back in real time (or speeded up time) by clicking on <strong>the</strong> “Play Record” button at <strong>the</strong><br />
bottom of <strong>the</strong> <strong>AmaSeis</strong> extracted <strong>seismogram</strong> screen. This capability is useful to illustrate <strong>the</strong><br />
ground shaking during an earthquake, particularly for <strong>seismogram</strong>s recorded very near to <strong>the</strong><br />
epicenter of a strong earthquake. By watching <strong>the</strong> screen as <strong>the</strong> ground motion appears in real<br />
time <strong>and</strong> displays <strong>the</strong> amplitude, frequency content <strong>and</strong> duration of <strong>the</strong> shaking, one can get a<br />
sense of <strong>the</strong> actual shaking that occurred at that location. An example <strong>seismogram</strong> that is useful<br />
for real time playback is shown in Figure 28. This <strong>seismogram</strong> is called an accelerogram<br />
because it is a record of acceleration of <strong>the</strong> ground in a particular direction, in this case<br />
horizontal. The accelerogram shown is only 28 seconds long <strong>and</strong> show that ground motions in<br />
this location reached peak accelerations of about 40% of <strong>the</strong> acceleration of gravity (enough to<br />
be very strongly felt <strong>and</strong> cause significant damage) <strong>and</strong> that <strong>the</strong> strong shaking lasted for about 6<br />
seconds. Also notice that <strong>the</strong> ground motion begins with relatively low-amplitude <strong>and</strong> highfrequency<br />
shaking (corresponding primarily to P-wave arrivals) <strong>and</strong> <strong>the</strong>n becomes much larger<br />
<strong>and</strong> of lower frequency as S- <strong>and</strong> surface-waves arrive at <strong>the</strong> station. This <strong>seismogram</strong> can be
<strong>Using</strong> <strong>AmaSeis</strong>… Page 22 of 69<br />
downloaded to your computer for display <strong>and</strong> play back using <strong>AmaSeis</strong> by selecting:<br />
http://web.ics.purdue.edu/~braile/edumod/as1lessons/<strong>Using</strong><strong>AmaSeis</strong>/northridge76.sac<br />
Figure 28. Accelerogram (<strong>seismogram</strong> approximately recording ground acceleration) from a 1994<br />
Northridge earthquake aftershock recorded at station SEPV. The ground motion recorded is <strong>the</strong><br />
horizontal component in <strong>the</strong> direction N76 o E. The <strong>seismogram</strong> begins at 12:32:00 UTC <strong>and</strong> ends at<br />
12:32:28, a length of 28 seconds. The vertical time scale is acceleration (in <strong>the</strong> N76 o E horizontal<br />
direction) in m/s 2 . The maximum amplitude (~400 m/s 2 ) corresponds to about 40% of <strong>the</strong><br />
acceleration of gravity (g).<br />
3.9 Analyzing <strong>the</strong> frequency content of <strong>seismogram</strong>s – <strong>the</strong> Fourier Transform Tool: The<br />
Fourier transform is a ma<strong>the</strong>matical technique for analyzing <strong>the</strong> frequency content of a signal.<br />
Basically, <strong>the</strong> Fourier transform finds <strong>the</strong> relative amplitudes (<strong>and</strong> phases or alignments) of<br />
fundamental sinusoids that could be added toge<strong>the</strong>r to very closely approximate <strong>the</strong> analyzed<br />
signal. The frequency content (relative amplitudes of various frequencies contained in <strong>the</strong><br />
signal) are displayed by plotting <strong>the</strong> amplitudes of <strong>the</strong>se sinusoids versus frequency (or period,<br />
<strong>the</strong> reciprocal of frequency). For example, if a <strong>seismogram</strong> (or selected segment of a<br />
<strong>seismogram</strong>) is made up primarily of 0.5 Hz (Hertz or cycles per second) energy, <strong>the</strong> Fourier<br />
transform will show a peak at about 0.5 Hz. The Fourier transform display is called a spectrum.
<strong>Using</strong> <strong>AmaSeis</strong>… Page 23 of 69<br />
The spectrum displays <strong>the</strong> relative amplitudes versus frequency. To calculate <strong>the</strong> spectrum of a<br />
<strong>seismogram</strong> or selected part of a <strong>seismogram</strong>, use <strong>the</strong> Extract Earthquake tool to select <strong>the</strong><br />
signal of interest (see section 3.3 above) <strong>and</strong> <strong>the</strong>n click on <strong>the</strong> Fourier transform tool icon<br />
(Figure 29).<br />
Figure 29. Fourier transform tool selection icon (graphed line showing a “peak”) in <strong>the</strong> <strong>AmaSeis</strong><br />
Event screen display.<br />
Examples of <strong>the</strong> use of <strong>the</strong> Fourier transform are shown in Figures 30-35. A relatively complete<br />
<strong>seismogram</strong> for <strong>the</strong> October 19, 2004 Vancouver Isl<strong>and</strong> earthquake is shown in Figure 30. We<br />
might be interested in <strong>the</strong> frequency content of <strong>the</strong> P-wave energy arriving early in <strong>the</strong><br />
<strong>seismogram</strong>. Selecting <strong>the</strong> first couple of minutes of <strong>the</strong> <strong>seismogram</strong> <strong>and</strong> extracting results in<br />
<strong>the</strong> signal shown in Figure 31. Calculating <strong>the</strong> Fourier transform generates <strong>the</strong> spectrum shown<br />
in Figure 32. The resulting spectrum shows that this signal (mostly P waves) contains energy<br />
with frequencies from about 0.2 to 0.8 Hz with peaks at about 0.6 Hz. Note also that this signal<br />
contains little energy for frequencies below 0.2 Hz or above 0.6 Hz (because <strong>the</strong> sampling rate<br />
of <strong>the</strong> AS-1 seismograph is about 6 samples per second, <strong>the</strong> digitizing electronics filters out<br />
energy above about 1 Hz so <strong>the</strong> absence of high frequencies in our selected signal is partly<br />
caused by removing <strong>the</strong>se frequencies by filtering).
<strong>Using</strong> <strong>AmaSeis</strong>… Page 24 of 69<br />
Figure 30. Seismogram for <strong>the</strong> M6.4 July 19, 2004 Vancouver Isl<strong>and</strong> earthquake.
<strong>Using</strong> <strong>AmaSeis</strong>… Page 25 of 69<br />
Figure 31. Extracted (selected) segment of <strong>the</strong> Vancouver Isl<strong>and</strong> <strong>seismogram</strong> (Figure 30) that<br />
includes primarily <strong>the</strong> P wave arrivals.
<strong>Using</strong> <strong>AmaSeis</strong>… Page 26 of 69<br />
Figure 32. The Fourier transform of <strong>the</strong> <strong>seismogram</strong> segment shown in Figure 31. Note that for<br />
this display, <strong>the</strong> spectrum is plotted versus frequency (<strong>the</strong> vs frequency button at <strong>the</strong> bottom of <strong>the</strong><br />
screen is selected) <strong>and</strong> <strong>the</strong> frequency scale has been exp<strong>and</strong>ed (by a factor of 2) using <strong>the</strong> arrow<br />
keys in <strong>the</strong> lower left h<strong>and</strong> corner of <strong>the</strong> screen.<br />
Ano<strong>the</strong>r <strong>seismogram</strong> (for <strong>the</strong> September 25, 2003 M8.3 Hokkaido, Japan earthquake) is shown<br />
in Figure 33. This <strong>seismogram</strong> shows prominent, relatively low frequency, surface waves<br />
(Rayleigh waves) arriving beginning about 37 minutes after <strong>the</strong> first arrival. To analyze <strong>the</strong><br />
frequency content of <strong>the</strong>se signals, we select <strong>and</strong> extract a section of <strong>the</strong> surface wave energy<br />
(Figure 34) <strong>and</strong> <strong>the</strong>n calculate <strong>the</strong> Fourier transform. The resulting spectrum is shown in Figure<br />
35. This spectrum shows that most of <strong>the</strong> surface wave energy in <strong>the</strong> selected part of <strong>the</strong><br />
<strong>seismogram</strong> has periods (<strong>the</strong> reciprocal of frequency) of about 20-25 seconds.
<strong>Using</strong> <strong>AmaSeis</strong>… Page 27 of 69<br />
Figure 33. Seismogram for <strong>the</strong> M8.3 September 25, 2003 Hokkaido, Japan earthquake.
<strong>Using</strong> <strong>AmaSeis</strong>… Page 28 of 69<br />
Figure 34. Extracted (selected) segment of <strong>the</strong> Vancouver Isl<strong>and</strong> <strong>seismogram</strong> (Figure 33) that<br />
includes primarily <strong>the</strong> Surface wave arrivals (because this is a vertical component <strong>seismogram</strong>, <strong>the</strong><br />
surface wave energy is almost exclusively Rayleigh waves).
<strong>Using</strong> <strong>AmaSeis</strong>… Page 29 of 69<br />
Figure 35. The Fourier transform of <strong>the</strong> <strong>seismogram</strong> segment shown in Figure 34. Note that for<br />
this display, <strong>the</strong> spectrum is plotted versus period (<strong>the</strong> vs period button at <strong>the</strong> bottom of <strong>the</strong> screen is<br />
selected) <strong>and</strong> <strong>the</strong> period scale has been exp<strong>and</strong>ed (by a factor of 32) using <strong>the</strong> arrow keys in <strong>the</strong><br />
lower left h<strong>and</strong> corner of <strong>the</strong> screen.<br />
3.10 Printing from <strong>AmaSeis</strong> screens: The simplest <strong>and</strong> most effective method of printing<br />
<strong>AmaSeis</strong> screen displays is to use <strong>the</strong> Windows Print Screen key (Prt Sc) on your computer<br />
keyboard. With an <strong>AmaSeis</strong> 24-hour screen display visible (such as shown in Figure 10), push<br />
<strong>the</strong> Print Screen key (this will copy a bitmap image of <strong>the</strong> screen to <strong>the</strong> clipboard), <strong>the</strong>n open<br />
MS Word or ano<strong>the</strong>r word processing program or a photo or image processing program <strong>and</strong><br />
paste <strong>the</strong> image into <strong>the</strong> open page of <strong>the</strong> application. The image can <strong>the</strong>n be scaled, cropped or<br />
labeled <strong>and</strong> <strong>the</strong>n printed from <strong>the</strong> opened application. Modifying <strong>the</strong> image (cropping; change<br />
brightness or contrast, etc.) in MS Word is easily performed using <strong>the</strong> Picture Toolbar (select<br />
Toolbars, Picture from <strong>the</strong> View menu at <strong>the</strong> top of <strong>the</strong> screen). The screen images shown in<br />
this document were all obtained using this method. <strong>AmaSeis</strong> screen images for 24-hour records<br />
(such as Figure 10), extracted <strong>seismogram</strong>s (such as Figure 15), “zoomed” <strong>seismogram</strong>s (such<br />
as Figure 27), time picked <strong>seismogram</strong>s (such as Figure 23), <strong>seismogram</strong>s overlain on travel<br />
time curves (such as Figure 26), <strong>and</strong> Fourier transforms of <strong>seismogram</strong>s (such as Figure 32) can<br />
all be copied <strong>and</strong> pasted <strong>and</strong> <strong>the</strong>n printed using this method.
<strong>Using</strong> <strong>AmaSeis</strong>… Page 30 of 69<br />
3.11 Manually setting <strong>the</strong> <strong>AmaSeis</strong> sample rate: The analog to digital circuit (digitizer) in<br />
<strong>the</strong> AS-1 seismometer does not have a fixed sample interval. It normally samples at about 6<br />
samples per second <strong>and</strong> that is <strong>the</strong> default sample rate set by <strong>the</strong> <strong>AmaSeis</strong> software when<br />
<strong>AmaSeis</strong> is opened to view or analyze seismic data <strong>and</strong> an AS-1 is not connected to your<br />
computer. Because this default value (6 samples per second) is not always <strong>the</strong> actual sample<br />
rate, it is possible to manually set <strong>the</strong> sample rate to be closer to <strong>the</strong> rate that was used in<br />
actually recording <strong>the</strong> data. For example, for <strong>the</strong> WLIN AS-1 data (ei<strong>the</strong>r <strong>the</strong> continuous, 24hour<br />
records such as in <strong>the</strong> 2003 folder or <strong>the</strong> SAC format files of individual <strong>seismogram</strong>s), <strong>the</strong><br />
rate is close to 6.14 samples per second. To manually set <strong>the</strong> sample rate, use MS Word to open<br />
<strong>the</strong> file AS1.ini from <strong>the</strong> <strong>AmaSeis</strong> folder. This is a text file that stores information about your<br />
AS-1 <strong>and</strong> <strong>AmaSeis</strong> set up. The text file will be similar to <strong>the</strong> following:<br />
[MRU]<br />
Count=4<br />
[AS1]<br />
Latitude=40.484<br />
Longitude=86.881<br />
Elevation=205<br />
BAUD=2400<br />
COM=1<br />
Gain=60<br />
Component=Z<br />
StationName=WLIN<br />
StationCode=WLIN<br />
FileExtension=LPZ<br />
LinesPerHour=1<br />
DecimateFactor=1<br />
DaysToRetainRecords=2000<br />
LowPassCutoff=3<br />
ZeroLevel=2048<br />
InitSampleSeconds=5<br />
SampleRate=6<br />
B<strong>and</strong>PassLowCutoff=0.01<br />
B<strong>and</strong>PassHighCutoff=0.2<br />
Device=AS1<br />
Notice that <strong>the</strong> sample rate in this file (fourth line from <strong>the</strong> bottom) is <strong>the</strong> default value of 6. To<br />
manually set <strong>the</strong> sample rate, change this number to <strong>the</strong> appropriate value (such as 6.14) <strong>and</strong><br />
save it (using <strong>the</strong> file name AS1.ini) as a plain text file in <strong>the</strong> <strong>AmaSeis</strong> folder. The Save As<br />
dialog box in MS Word should look like that shown in Figure 36. Note that <strong>the</strong> file name is<br />
AS1.ini <strong>and</strong> <strong>the</strong> file type is Plain Text (near <strong>the</strong> bottom of <strong>the</strong> dialog box). When this updated<br />
file is saved, a dialog box will appear (Figure 37) that requests information about text encoding;<br />
click on <strong>the</strong> MS-DOS selection as shown in Figure 37 <strong>and</strong> <strong>the</strong>n click OK to complete <strong>the</strong> save<br />
of <strong>the</strong> AS1.ini file with <strong>the</strong> updated sample rate information.
<strong>Using</strong> <strong>AmaSeis</strong>… Page 31 of 69<br />
Figure 36. Dialog box from MS Word that appears while saving <strong>the</strong> AS1.ini file.
<strong>Using</strong> <strong>AmaSeis</strong>… Page 32 of 69<br />
Figure 37. File Conversion dialog box from MS Word that appears while saving <strong>the</strong> AS1.ini file.<br />
The MS-DOS button has been selected to control text encoding.<br />
3.12 Accessing earthquake hypocenter data from <strong>the</strong> Internet: You can find information<br />
about earthquakes that have occurred around <strong>the</strong> world by accessing USGS or IRIS websites.<br />
Information on recent earthquakes is easily found at <strong>the</strong> USGS earthquake page,<br />
http://earthquake.usgs.gov/, or <strong>the</strong> IRIS Seismic Monitor, http://www.iris.edu/seismon/. For<br />
older events, instructions for searching earthquake catalogs for events of interest are provided<br />
at: http://web.ics.purdue.edu/~braile/edumod/eqdata/eqdata.htm. Locations, origin times <strong>and</strong><br />
official magnitude determinations (moment magnitude or M) for recent events can be found at<br />
<strong>the</strong> USGS earthquake website by selecting Latest Earthquakes (at <strong>the</strong> top left h<strong>and</strong> corner of<br />
<strong>the</strong> page), <strong>and</strong> <strong>the</strong>n select NEIC Current Earthquake Information (on <strong>the</strong> left side of <strong>the</strong><br />
screen). The resulting list provides information on earthquakes that have occurred during <strong>the</strong><br />
last 7 days. To access data for 8-30 days ago, select this list from near <strong>the</strong> bottom of <strong>the</strong> page.<br />
For more information, including maps for many events, select <strong>the</strong> earthquake of interest from<br />
<strong>the</strong> list. The Magnitude link (heading on <strong>the</strong> data table in <strong>the</strong> earthquake catalog) provides a<br />
useful link to a large amount of additional information on earthquake magnitudes. To access<br />
older data, see <strong>the</strong> instructions below or <strong>the</strong> instruction in: Accessing Earthquake Data.<br />
To obtain detailed magnitude data from <strong>the</strong> USGS catalog for recent events (for determining <strong>the</strong><br />
magnitude comparison with AS-1 determined magnitudes), go to http://earthquake.usgs.gov;<br />
click on “Latest Quakes”, <strong>the</strong>n “NEIC Current Earthquake Information” for a list of recent<br />
events (you can also access <strong>the</strong> last 30 days of activity, maps <strong>and</strong> o<strong>the</strong>r data lists). To find<br />
detailed magnitude data for a specific event, click on <strong>the</strong> event in <strong>the</strong> list of earthquakes, <strong>the</strong>n<br />
scroll down <strong>the</strong> page <strong>and</strong> select Phase Data. Magnitude (<strong>and</strong> o<strong>the</strong>r event) information for <strong>the</strong><br />
selected earthquake will be displayed.<br />
3.13 Calculating distance from an epicenter to your station: The USGS online distance<br />
calculator (http://neic.usgs.gov/neis/travel_times/) is an easy to use tool for calculating distance<br />
between an epicenter <strong>and</strong> your station (or any two points on Earth). To use <strong>the</strong> distance<br />
calculator, <strong>the</strong> coordinates (latitude <strong>and</strong> longitude) of <strong>the</strong> epicenter <strong>and</strong> station must be known.<br />
To find <strong>the</strong> coordinates of permanent seismograph stations, go to <strong>the</strong> IRIS GSN station page<br />
http://www.iris.edu/stations/stations.htm, select Global Seismic Network (GSN), <strong>and</strong> <strong>the</strong>n<br />
select stations, or go to <strong>the</strong> list directly at: http://www.iris.edu/SeismiQuery/bin/gsn_sta_s.pl.<br />
The IRIS GSN station page also has a link to a list of over 11,000 station names that exist or<br />
have existed in <strong>the</strong> past. Detailed station information for many of <strong>the</strong> GSN stations can be<br />
obtained from <strong>the</strong> IRIS Seismic Monitor; click on <strong>the</strong> map in <strong>the</strong> area of interest <strong>and</strong> a close-up<br />
view of that area will appear; <strong>the</strong>n select a station (triangles on <strong>the</strong> map) <strong>and</strong> a page listing<br />
detailed station information will appear (if available).<br />
To find <strong>the</strong> coordinates of an AS-1 station, go to SpiNet; select Current Network Stations <strong>and</strong><br />
<strong>the</strong>n select <strong>the</strong> station of interest to list <strong>the</strong> station information. If you need to determine <strong>the</strong>
<strong>Using</strong> <strong>AmaSeis</strong>… Page 33 of 69<br />
coordinates of your AS-1 station, <strong>the</strong>re is an online tool that is convenient (you could also use a<br />
h<strong>and</strong>held GPS receiver if available).<br />
To determine your seismograph station coordinates from online maps, go to<br />
http://www.maptech.com/ <strong>and</strong> select Online Maps from <strong>the</strong> links at <strong>the</strong> top of <strong>the</strong> page, <strong>and</strong><br />
<strong>the</strong>n Maptech MapServer. Enter desired city <strong>and</strong> state information (or zip code) in <strong>the</strong> dialog<br />
boxes <strong>and</strong> select Go. If a list of possible locations or maps appears, select <strong>the</strong> desired location<br />
or map. A topographic map of <strong>the</strong> area will appear on <strong>the</strong> screen. You can navigate on <strong>the</strong> map<br />
using <strong>the</strong> arrows at <strong>the</strong> map edges to move <strong>the</strong> view to an adjacent location. When you have<br />
your station location in view, select <strong>the</strong> DD.DD (specifies that coordinates are to be displayed in<br />
degrees <strong>and</strong> decimal degrees which is <strong>the</strong> most common usage) setting in <strong>the</strong> coordinates dialog<br />
box to <strong>the</strong> left of <strong>the</strong> map. Next, place <strong>the</strong> cursor on <strong>the</strong> map at <strong>the</strong> location of your station <strong>and</strong><br />
read <strong>the</strong> latitude <strong>and</strong> longitude of <strong>the</strong> cursor position in <strong>the</strong> windows to <strong>the</strong> left of <strong>the</strong> map.<br />
To find <strong>the</strong> epicenter (location) of an earthquake from online catalogs, use <strong>the</strong> methods<br />
described in section 3.12 (above). For more information on <strong>the</strong> online tools for searching<br />
earthquake catalogs, see Accessing Earthquake Data.<br />
When you have determined your station <strong>and</strong> epicenter coordinates, go to <strong>the</strong> USGS online<br />
Distance Calculator, select Specify Earthquake, <strong>and</strong> enter <strong>the</strong> coordinates into <strong>the</strong> appropriate<br />
dialog boxes. Use degrees <strong>and</strong> decimal degrees format to <strong>the</strong> coordinates. Also, use negative<br />
numbers for South latitude <strong>and</strong> West longitude. Click on Compute at <strong>the</strong> bottom of <strong>the</strong> page to<br />
determine <strong>the</strong> epicenter to station distance (Delta) given in degrees geocentric angle. (For a<br />
quick estimate of epicenter to station distance, you can sometimes use <strong>the</strong> distance determined<br />
from <strong>the</strong> S minus P arrival times as described in section 3.6.) To determine <strong>the</strong> corresponding<br />
distance in kilometers along <strong>the</strong> surface, multiply this number by 111.19 km/degree. The<br />
distance calculator also provides calculated travel times to your station of several seismic phases<br />
(arrivals) <strong>and</strong>, if <strong>the</strong> earthquake magnitude is entered, <strong>the</strong> estimated ground motion at your site<br />
from this earthquake. When calculating travel times to your station, or ground motion estimates<br />
at your station, be sure to enter <strong>the</strong> correct depth of focus for <strong>the</strong> earthquake. It is also<br />
convenient to save your station coordinates so that <strong>the</strong>y will not have to be entered every time<br />
that you use <strong>the</strong> distance calculator. From <strong>the</strong> main distance calculator page, you can also<br />
access a plot of st<strong>and</strong>ard travel time curves <strong>and</strong> a table of travel times.<br />
3.14 Adding event information to extracted <strong>seismogram</strong>s: After extracting a <strong>seismogram</strong><br />
(see section 3.3, above), <strong>the</strong> earthquake hypocenter information, can be entered <strong>and</strong> saved in<br />
your SAC-format file using <strong>the</strong> Event option in <strong>the</strong> Settings menu. After entering <strong>the</strong><br />
appropriate information, click on OK to save <strong>the</strong> <strong>seismogram</strong>. More information on <strong>the</strong> Event<br />
option can be found in section 7, below.<br />
3.15 Adding calibration information <strong>and</strong> calculating magnitudes in <strong>AmaSeis</strong>: Under<br />
construction.
<strong>Using</strong> <strong>AmaSeis</strong>… Page 34 of 69<br />
4. SpiNet: SpiNet is a website that supports educational seismology through providing educational<br />
products <strong>and</strong> serving as a data archive for AS-1 <strong>and</strong> o<strong>the</strong>r <strong>seismogram</strong>s. You can download<br />
<strong>seismogram</strong>s (mostly AS-1 <strong>seismogram</strong>s in SAC format) that can be viewed <strong>and</strong> analyzed using <strong>the</strong><br />
<strong>AmaSeis</strong> software. You can also upload <strong>seismogram</strong>s recorded be your AS-1 seismograph to <strong>the</strong><br />
SpiNet site so that o<strong>the</strong>r interested persons can use <strong>the</strong>m. If you are operating an AS-1<br />
seismograph, we encourage you to register your seismograph station with <strong>the</strong> SpiNet network.<br />
There are instructions for <strong>downloading</strong> <strong>and</strong> uploading on <strong>the</strong> SpiNet website <strong>and</strong> illustrated<br />
instructions are also provided below.<br />
4.1 Downloading <strong>seismogram</strong>s from SpiNet: To download <strong>seismogram</strong>s from SpiNet, click<br />
on <strong>the</strong> icon below to go to <strong>the</strong> SpiNet website (http://www.scieds.com/spinet/).<br />
At <strong>the</strong> top of <strong>the</strong> SpiNet home page you will see several links (shown below); click on <strong>the</strong><br />
Seismicity link <strong>and</strong> <strong>the</strong>n on Download Sac Files. On <strong>the</strong> resulting screen (Figure 38), you can<br />
navigate to <strong>the</strong> time period of interest <strong>and</strong> select a <strong>seismogram</strong> to download.
<strong>Using</strong> <strong>AmaSeis</strong>… Page 35 of 69<br />
Figure 38. Seismograms available for download from <strong>the</strong> SpiNet website. The most recent<br />
<strong>seismogram</strong>s are listed by event date included in <strong>the</strong> file name (see file naming convention). The<br />
date of upload is also shown to <strong>the</strong> right of <strong>the</strong> file name. Seismograms for previous time periods ar<br />
contained in folders shown at <strong>the</strong> bottom of <strong>the</strong> list. To access data from <strong>the</strong>se time periods, click<br />
on <strong>the</strong> appropriate folder name to see <strong>the</strong> list of <strong>seismogram</strong>s during that time period.<br />
The <strong>seismogram</strong>s are identified by <strong>the</strong> file naming convention described below.<br />
File Naming Convention<br />
All files adhere to <strong>the</strong> following naming convention<br />
(two digit year, two digit month, two digit day, two digit hour, two digit minute, station code)<br />
Some examples:<br />
Tempe High School (thaz) recorded an event at 19:30 on June 23, 2001-<br />
File Name: '0106231930thaz.sac'<br />
or...<br />
RAIN (Indiana) recorded an event at 07:09 on July 30, 2003-<br />
File Name: '0307300709rain.sac'<br />
Footnote: Under <strong>the</strong> old naming convention (prior to 7/29/2004) files are named as follows (two<br />
digit year, two digit month, two digit day, two digit hour, station code)
<strong>Using</strong> <strong>AmaSeis</strong>… Page 36 of 69<br />
The above THAZ <strong>and</strong> RAIN examples would have <strong>the</strong> following names:<br />
'01062319thaz.sac'<br />
'03073007rain.sac'<br />
To download <strong>the</strong> <strong>seismogram</strong>, click on <strong>the</strong> <strong>seismogram</strong> file name in <strong>the</strong> SpiNet window. The<br />
dialog boxes shown in Figures 39-40 will appear. When <strong>the</strong> Download Complete dialog box<br />
appears, click on Close.<br />
Figure 39. Dialog box that appears during <strong>the</strong> download of <strong>seismogram</strong>s from <strong>the</strong> SpiNet website.<br />
To complete <strong>the</strong> download, click Save.
<strong>Using</strong> <strong>AmaSeis</strong>… Page 37 of 69<br />
Figure 40. Dialog box that appears during <strong>the</strong> download of <strong>seismogram</strong>s from <strong>the</strong> SpiNet website.<br />
If <strong>the</strong> selected folder location is not where you want to store <strong>the</strong> <strong>seismogram</strong>, navigate to <strong>the</strong><br />
desired folder <strong>and</strong> <strong>the</strong>n click on Save.<br />
To view <strong>the</strong> downloaded <strong>seismogram</strong>, start <strong>AmaSeis</strong>, click on Open from <strong>the</strong> File menu. If <strong>the</strong><br />
correct folder doesn’t automatically open, use <strong>the</strong> arrow keys (to <strong>the</strong> right of <strong>the</strong> folder name at<br />
<strong>the</strong> top of <strong>the</strong> dialog box) to navigate to <strong>the</strong> folder that contains your SAC files. It is convenient<br />
to establish one or more folders for storing your own SAC files of <strong>seismogram</strong>s <strong>and</strong> downloaded<br />
<strong>seismogram</strong>s. Once <strong>the</strong> correct file is found, select <strong>the</strong> file name <strong>and</strong> click on Open (Figure 41).<br />
For <strong>the</strong> example shown here, <strong>the</strong> file 0409241445WLIN.sac (corresponding to <strong>the</strong> M5.9<br />
September 24, 2004 Gulf of California earthquake recorded by <strong>the</strong> WLIN AS-1 station in West<br />
Lafayette, IN) appears (Figure 42). This <strong>seismogram</strong> can be filtered, segments selected<br />
(“zoomed”), arrival times picked, <strong>and</strong> to estimate distance from <strong>the</strong> S minus P times, <strong>and</strong><br />
determine magnitude using <strong>AmaSeis</strong> as described in section 3 of this tutorial.<br />
Figure 41. Dialog box that appears when opening a SAC file <strong>seismogram</strong> from within <strong>AmaSeis</strong>.
<strong>Using</strong> <strong>AmaSeis</strong>… Page 38 of 69<br />
Figure 42. WLIN AS-1 <strong>seismogram</strong> for <strong>the</strong> Gulf of California earthquake.<br />
For recent events, <strong>the</strong> easiest way to find <strong>seismogram</strong>s for download from SpiNet is to open <strong>the</strong><br />
Recent Events page (Figure 43; select Seismicity <strong>and</strong> <strong>the</strong>n Recent Events from <strong>the</strong> SpiNet<br />
home page). From this page, you can select <strong>and</strong> download <strong>seismogram</strong> files for specific<br />
earthquakes by station name (listed to <strong>the</strong> right of <strong>the</strong> event information on <strong>the</strong> screen shown in<br />
Figure 43).
<strong>Using</strong> <strong>AmaSeis</strong>… Page 39 of 69<br />
Figure 43. Example of SpiNet Recent Events page showing stations (four letter codes to <strong>the</strong> right<br />
of events) for which <strong>seismogram</strong>s are available in <strong>the</strong> SpiNet archive for <strong>the</strong> listed event. For<br />
example, selecting WLIN from <strong>the</strong> list for <strong>the</strong> September 24, 2004 Gulf of California earthquake will<br />
download <strong>the</strong> WLIN SAC format <strong>seismogram</strong> (shown in Figure 42) to your computer for viewing<br />
with <strong>AmaSeis</strong> .<br />
4.2 Uploading <strong>seismogram</strong>s to SpiNet: To upload a <strong>seismogram</strong> (SAC format file) from your<br />
computer to SpiNet, open <strong>the</strong> SpiNet website, <strong>and</strong> select Seismicity from <strong>the</strong> links at <strong>the</strong> top of<br />
<strong>the</strong> page; <strong>the</strong>n select Upload a SAC file. Follow <strong>the</strong> instructions at <strong>the</strong> bottom of <strong>the</strong> page to<br />
upload your <strong>seismogram</strong>. Be sure that you have saved your SAC format <strong>seismogram</strong> using a<br />
file name consistent with <strong>the</strong> SpiNet file naming convention (see section 4.1 above) before<br />
beginning <strong>the</strong> upload process. Your uploaded file is checked <strong>and</strong> <strong>the</strong>n placed in <strong>the</strong> SpiNet<br />
archive <strong>and</strong> will be displayed for o<strong>the</strong>rs to download with a day or so (on pages similar to those<br />
shown in Figures 38 <strong>and</strong> 43).
<strong>Using</strong> <strong>AmaSeis</strong>… Page 40 of 69<br />
5. Downloading <strong>seismogram</strong>s from <strong>the</strong> IRIS Data Management Center (DMC) using<br />
WILBER II: This section provides instructions for finding <strong>and</strong> <strong>downloading</strong> <strong>seismogram</strong>s from<br />
<strong>the</strong> Incorporated Research Institutions for Seismology (IRIS) Data Management Center’s (DMC)<br />
archive using <strong>the</strong> online tool WILBER II. The <strong>seismogram</strong>s in <strong>the</strong> DMC archive include data from<br />
many earthquakes since 1990 recorded by st<strong>and</strong>ard seismograph stations (including <strong>the</strong> IRIS/USGS<br />
Global Seismograph Network [GSN] stations) around <strong>the</strong> world. Seismograms from significant<br />
earthquakes are often available within 30 minutes to an hour after <strong>the</strong> event. The instructions below<br />
illustrate how to download data from <strong>the</strong> DMC to your computer to display <strong>and</strong> analyze using <strong>the</strong><br />
<strong>AmaSeis</strong> software. A help page for using WILBER II is also available from <strong>the</strong> IRIS DMC at:<br />
http://www.iris.edu/wilberII_dir/html/help.html. More information on data in <strong>the</strong> IRIS DMC data<br />
archive, <strong>seismogram</strong> formats <strong>and</strong> data access tools can be found at:<br />
http://www.iris.edu/manuals/DATutorial.htm.<br />
5.1 Opening WILBER II: To connect to WILBER II directly, click on <strong>the</strong> icon below (<strong>the</strong>n<br />
skip to section 5.3 of <strong>the</strong>se instructions):<br />
http://www.iris.edu/cgi-bin/wilberII_page1.pl<br />
5.2 Opening WILBER II from <strong>the</strong> IRIS website (www.iris.edu): To connect to WILBER II<br />
from <strong>the</strong> IRIS website, click on <strong>the</strong> icon below (http://www.iris.edu):<br />
The screen shown below (Figure 44) will appear. You can use this screen to link to all of <strong>the</strong><br />
programs <strong>and</strong> o<strong>the</strong>r information related to IRIS. To access recent earthquake epicenter<br />
information, click on <strong>the</strong> Seismic Monitor icon. To access data using WILBER II, click on<br />
data. The IRIS DMC Data screen (Figure 45) will appear. To open WILBER II, click on <strong>the</strong><br />
WILBER II icon (oval) located near <strong>the</strong> lower right h<strong>and</strong> corner of <strong>the</strong> screen (highlighted by a<br />
red arrow in Figure 45). The opening WILBER II screen (Figure 46) will appear.
<strong>Using</strong> <strong>AmaSeis</strong>… Page 41 of 69<br />
Figure 44. IRIS home page.<br />
Figure 45. IRIS DMC Data screen. To access WILBER II, click on <strong>the</strong> WILBER II oval located<br />
near <strong>the</strong> lower right h<strong>and</strong> corner of <strong>the</strong> screen (see red arrow above).<br />
5.3 WILBER II first screen: The WILBER II opening screen is shown in Figure 46. From<br />
this screen, one can access digital earthquake data (<strong>seismogram</strong>s) in <strong>the</strong> IRIS DMC archive.<br />
The data are organized by time <strong>and</strong> event <strong>and</strong> accessed using <strong>the</strong> time period (in quarters of a<br />
year) scroll bar <strong>and</strong> <strong>the</strong> interactive map of (selected) events during that time period.
<strong>Using</strong> <strong>AmaSeis</strong>… Page 42 of 69<br />
Figure 46. WILBER II opening screen. The map shows earthquakes occurring in <strong>the</strong> last 90 days<br />
that have been selected for preparing individual <strong>seismogram</strong>s.<br />
On <strong>the</strong> WILBER II opening screen (Figure 46), we select <strong>the</strong> period of interest from <strong>the</strong> scroll<br />
window to <strong>the</strong> left of <strong>the</strong> map. In this case we choose Q3 of 1999 (Figure 47). A new map<br />
(Figure 48) showing <strong>the</strong> events for which <strong>seismogram</strong>s are available for that quarter appears.<br />
Click on <strong>the</strong> large dot located on <strong>the</strong> west coast of sou<strong>the</strong>rn Mexico (as shown in Figure 48) to<br />
select <strong>the</strong> Oaxaca earthquake of September 30, 1999. (You can find information about<br />
earthquakes that have occurred around <strong>the</strong> world by accessing USGS or IRIS websites.<br />
Information on recent earthquakes is easily found at <strong>the</strong> USGS earthquake page,<br />
http://earthquake.usgs.gov/, or <strong>the</strong> IRIS Seismic Monitor, http://www.iris.edu/seismon/. For<br />
older events, instructions for searching earthquake catalogs for events of interest are provided<br />
at: http://web.ics.purdue.edu/~braile/edumod/eqdata/eqdata.htm as described in section 3.12 of<br />
this document). A screen with information about that event (Figure 49) will appear. Select <strong>the</strong><br />
event from <strong>the</strong> list (in this case <strong>the</strong>re is only one event in <strong>the</strong> list) <strong>and</strong> a Responding Networks<br />
page (Figure 50) will appear.
<strong>Using</strong> <strong>AmaSeis</strong>… Page 43 of 69<br />
Figure 47. Selection of date (by quarters of a year) on <strong>the</strong> WILBER II opening page. In this case<br />
we select Quarter 3 (Q3) of 1999 because <strong>the</strong> event of interest occurred on September 30, 1999.<br />
Figure 48. Map of events in quarter 3 of 1999. The desired event is selected by moving <strong>the</strong> h<strong>and</strong><br />
cursor to <strong>the</strong> large dot on <strong>the</strong> west coast of sou<strong>the</strong>rn Mexico <strong>and</strong> clicking <strong>the</strong> mouse.<br />
Figure 49. Event information for <strong>the</strong> event selected in <strong>the</strong> map shown in Figure 48.
<strong>Using</strong> <strong>AmaSeis</strong>… Page 44 of 69<br />
Figure 50. Data corresponding to many different seismograph networks can be selected. For most<br />
requests, select <strong>the</strong> II <strong>and</strong> IU GSN networks as shown here <strong>the</strong>n click Proceed at <strong>the</strong> bottom of <strong>the</strong><br />
page.<br />
In <strong>the</strong> Responding Stations window (Figure 50), uncheck all of <strong>the</strong> boxes next to <strong>the</strong> station<br />
names except for <strong>the</strong> desired stations, in this case, stations TUC, CCM, NNA <strong>and</strong> KIP. Select<br />
<strong>the</strong> components of interest, in this case, <strong>the</strong> BHE, BHN, <strong>and</strong> BHZ components (<strong>the</strong>se<br />
components are broadb<strong>and</strong> horizontal components in <strong>the</strong> east <strong>and</strong> north directions <strong>and</strong> <strong>the</strong><br />
broadb<strong>and</strong> vertical component; hold down <strong>the</strong> control key while clicking on <strong>the</strong> components<br />
with <strong>the</strong> cursor to select multiple components). Click on Proceed at <strong>the</strong> bottom of <strong>the</strong> page.<br />
The Responding Stations screen shown in Figure 51 will appear.<br />
If you wish to see a station map that shows <strong>the</strong> locations of responding seismograph stations for<br />
this event, click on Station Map (before un-checking stations if you want to see all station<br />
locations as shown in Figure 52). Selecting an area of <strong>the</strong> map (screen shown in Figure 52) by<br />
dragging <strong>the</strong> cursor over <strong>the</strong> map from <strong>the</strong> upper left to <strong>the</strong> lower right of <strong>the</strong> desired area results<br />
in a close-up view in which <strong>the</strong> station names are visible (Figure 53). For <strong>the</strong> data request in<br />
this example, we are interested in stations TUC, CCM, NNA <strong>and</strong> KIP. Un-check all of <strong>the</strong> o<strong>the</strong>r<br />
stations on <strong>the</strong> Responding Stations screen (Figure 51) to select only <strong>the</strong> <strong>seismogram</strong>s of<br />
interest. To examine <strong>the</strong> <strong>seismogram</strong>s for a station before submitting <strong>the</strong> data request, click on<br />
<strong>the</strong> station name on <strong>the</strong> Responding Stations screen (Figure 51). An example of selecting a<br />
preview of <strong>the</strong> data is shown for <strong>the</strong> TUC station in Figure 54. From this page, one can also<br />
access detailed station information (including <strong>the</strong> coordinates of <strong>the</strong> station) by selecting Station<br />
Book for TUC (Figure 55).<br />
After selecting <strong>the</strong> stations of interest for <strong>the</strong> request, scroll to <strong>the</strong> bottom of <strong>the</strong> Responding<br />
Stations page (Figure 51) <strong>and</strong> complete <strong>the</strong> request by selecting <strong>the</strong> data format <strong>and</strong> time range <strong>and</strong><br />
entering personal information for tracking your request. An example is shown in Figure 56. Then
<strong>Using</strong> <strong>AmaSeis</strong>… Page 45 of 69<br />
click <strong>the</strong> Process Request button (Figure 56) to submit <strong>the</strong> data request. Requests for small amounts<br />
of data (a few <strong>seismogram</strong>s) are usually processed within a few minutes. While <strong>the</strong> request is being<br />
processed, <strong>the</strong> screen shown in Figure 57 will appear, followed by a progress report (Figure 58) <strong>and</strong><br />
a Request Completed! message screen (Figure 59). Connecting to <strong>the</strong> ftp address (click on <strong>the</strong><br />
address on screen similar to that shown in Figure 59) on <strong>the</strong> Request Completed! page (or from <strong>the</strong><br />
email sent by <strong>the</strong> IRIS DMC after completion of your request; see Figure 56), a screen similar to<br />
that shown in Figure 60 will appear. Selecting each of <strong>the</strong> SAC format files will cause <strong>the</strong> file to be<br />
downloaded to your computer. Place in a SAC Files folder (or a sub-folder) within <strong>the</strong> <strong>AmaSeis</strong><br />
folder on your computer.<br />
Figure 51. Station information for <strong>the</strong> Oaxaca event. Selected stations are checked <strong>and</strong> desired<br />
components are selected.
<strong>Using</strong> <strong>AmaSeis</strong>… Page 46 of 69<br />
Figure 52. Station map generated by clicking on <strong>the</strong> Station Map box on <strong>the</strong> screen shown in<br />
Figure 51. The station map was generated with all <strong>the</strong> stations (II <strong>and</strong> IU networks) shown in<br />
screen on Figure 51 selected. The green triangles are II stations; <strong>the</strong> blue triangles are IU stations.<br />
The contours show distances (in degrees) from <strong>the</strong> Oaxaca earthquake epicenter (red circle).
<strong>Using</strong> <strong>AmaSeis</strong>… Page 47 of 69<br />
Figure 53. Zooming in on <strong>the</strong> station map (screen shown in Figure 52) by dragging <strong>the</strong> cursor from<br />
<strong>the</strong> upper left to <strong>the</strong> lower right of <strong>the</strong> area of interest generate <strong>the</strong> map shown here. The station<br />
names identify GSN seismograph stations within <strong>the</strong> selected area. The contours show distances (in<br />
degrees) from <strong>the</strong> Oaxaca earthquake epicenter (red circle). The stations of interest for <strong>the</strong> S minus<br />
P location example described here are TUC, CCM, NNA <strong>and</strong> KIP.
<strong>Using</strong> <strong>AmaSeis</strong>… Page 48 of 69<br />
Figure 54. Seismograms (displayed from <strong>the</strong> station link on <strong>the</strong> screen illustrated in Figure 51) for<br />
<strong>the</strong> TUC station for <strong>the</strong> Oaxaca earthquake. Station <strong>and</strong> event information is provided at <strong>the</strong> top of<br />
<strong>the</strong> screen. The <strong>seismogram</strong>s are broadb<strong>and</strong> (BH) records for <strong>the</strong> East-West (E) horizontal<br />
component (top), North-South (N) horizontal component (middle), <strong>and</strong> vertical (Z) component<br />
(bottom).
<strong>Using</strong> <strong>AmaSeis</strong>… Page 49 of 69<br />
Figure 55. Station book information for <strong>the</strong> TUC seismograph station (from <strong>the</strong> link shown at <strong>the</strong><br />
top of <strong>the</strong> screen shown in Figure 54).
<strong>Using</strong> <strong>AmaSeis</strong>… Page 50 of 69<br />
Figure 56. Illustration of data format <strong>and</strong> time request for <strong>seismogram</strong>s to download from <strong>the</strong> IRIS<br />
DMC using WILBER II. These dialog boxes are located at <strong>the</strong> bottom of <strong>the</strong> station selection<br />
screen shown in Figure 51. For use with <strong>the</strong> <strong>AmaSeis</strong> <strong>viewer</strong>, select <strong>the</strong> SAC BINARY individual<br />
files format. The time range can also be selected. For <strong>the</strong> example used here, <strong>the</strong> beginning time is<br />
set at one minute before <strong>the</strong> P arrival <strong>and</strong> <strong>the</strong> end time is set to 20 minutes after <strong>the</strong> P arrival. The<br />
Personal Information is entered for tracking <strong>the</strong> data request <strong>and</strong> notification of completion of <strong>the</strong><br />
request. After completing <strong>the</strong> selections, click on Process Request to submit.<br />
Figure 57. WILBER II screen that appears after data request has been submitted.<br />
Figure 58. WILBER II screen that indicates data request progress.<br />
Figure 59. WILBER II screen that indicates that <strong>the</strong> data request was completed. If requested<br />
(Figure 56), <strong>and</strong> email will also be sent notifying <strong>the</strong> requestor that <strong>the</strong> data request has been<br />
completed.
<strong>Using</strong> <strong>AmaSeis</strong>… Page 51 of 69<br />
Figure 60. WILBER II ftp screen showing <strong>seismogram</strong>s in <strong>the</strong> data request, in this case, 3<br />
<strong>seismogram</strong>s (3 components) for each of 4 stations.<br />
5.4 Viewing <strong>the</strong> <strong>seismogram</strong>s downloaded from WILBER II using <strong>AmaSeis</strong>: To view <strong>the</strong><br />
<strong>seismogram</strong>s that have been downloaded from WILBER II, start <strong>AmaSeis</strong> <strong>and</strong> click on Open<br />
from <strong>the</strong> File pull-down menu <strong>and</strong> navigate to <strong>the</strong> SAC Files folder (or a sub-folder that<br />
contains <strong>the</strong> <strong>seismogram</strong> files). Select a sac file to view <strong>and</strong> click on Open in <strong>the</strong> dialog box<br />
(similar to that shown in Figure 41). The <strong>seismogram</strong> will appear in <strong>the</strong> <strong>AmaSeis</strong> Event screen<br />
just <strong>the</strong> like extracted <strong>seismogram</strong> shown in Figure 15 or <strong>the</strong> <strong>seismogram</strong> downloaded from<br />
SpiNet shown in Figure 42. The <strong>seismogram</strong>s can be viewed individually or, by selecting three<br />
<strong>seismogram</strong>s corresponding to <strong>the</strong> 3 components for a single station, <strong>AmaSeis</strong> will display <strong>the</strong><br />
three <strong>seismogram</strong>s on a single screen (Figure 61). To select two or three <strong>seismogram</strong>s for<br />
display on <strong>the</strong> same screen, hold down <strong>the</strong> Ctrl key while making <strong>the</strong> selections. The multiple<br />
<strong>seismogram</strong> display is useful for viewing <strong>the</strong> waveforms corresponding to various arrivals such<br />
as P, S <strong>and</strong> surface waves.<br />
The three <strong>seismogram</strong> display can also be used to display <strong>seismogram</strong>s from three different<br />
stations as long as <strong>the</strong> start times of <strong>the</strong> <strong>seismogram</strong>s are not too different. For example, Figure<br />
62 shows <strong>seismogram</strong>s for <strong>the</strong> September 24, 2004 M5.9 Gulf of California earthquake recorded<br />
in Arizona (THAZ), Indiana (WLIN) <strong>and</strong> North Carolina (NLHS). These <strong>seismogram</strong>s are<br />
available at <strong>the</strong> SpiNet website. Information about <strong>the</strong> stations can be found at SpiNet. Because<br />
of <strong>the</strong> different distances of <strong>the</strong> stations from <strong>the</strong> epicenter, <strong>the</strong> <strong>seismogram</strong>s look quite different<br />
even though <strong>the</strong>y are all from <strong>the</strong> same event. Note <strong>the</strong> different amplitude scales on <strong>the</strong> left<br />
h<strong>and</strong> axis. The differences in amplitude between stations is due to <strong>the</strong> distance of propagation<br />
(energy spreading out as <strong>the</strong> waves propagate from <strong>the</strong> source).<br />
The downloaded (WILBER II) <strong>seismogram</strong>s from <strong>the</strong> Oaxaca earthquake can be viewed <strong>and</strong><br />
analyzed in <strong>AmaSeis</strong>. For example, opening <strong>the</strong> TUC vertical component (Z) <strong>seismogram</strong><br />
results in <strong>the</strong> view shown in Figure 63. We can zoom in on <strong>the</strong> <strong>seismogram</strong> to better see <strong>the</strong><br />
characteristics of <strong>the</strong> P, S <strong>and</strong> surface wave arrivals (Figure 64 <strong>and</strong> 65). The P <strong>and</strong> S arrivals are<br />
distinctly visible on <strong>the</strong> <strong>seismogram</strong> shown in Figure 65. The P arrival is at about 16:36:23 <strong>and</strong><br />
<strong>the</strong> S arrival is at about 16:40:12. These times can be read from <strong>the</strong> <strong>AmaSeis</strong> screen using <strong>the</strong><br />
cursor. The <strong>AmaSeis</strong> travel time curve tool can also be used to infer <strong>the</strong> epicenter-to-station<br />
distance as shown in Figure 66 as described in section 3.6 above. The complete S minus P
<strong>Using</strong> <strong>AmaSeis</strong>… Page 52 of 69<br />
location procedure for this event is described in section 2.3 of <strong>the</strong> Accessing earthquake data<br />
document (http://web.ics.purdue.edu/~braile/edumod/eqdata/eqdata.htm).<br />
Figure 61. Illustration of three component <strong>seismogram</strong> (E, Z <strong>and</strong> N components for <strong>the</strong> TUC<br />
station for <strong>the</strong> Oaxaca earthquake) display in <strong>AmaSeis</strong>.
<strong>Using</strong> <strong>AmaSeis</strong>… Page 53 of 69<br />
Figure 62. Three <strong>seismogram</strong>s (AS-1 stations NLHS, WLIN, <strong>and</strong> THAZ downloaded from SpiNet)<br />
for <strong>the</strong> September 24, 2004 M5.9 Gulf of California earthquake. Seismograms are plotted at <strong>the</strong><br />
correct times. Amplitude scales (in counts) for each <strong>seismogram</strong> are shown on <strong>the</strong> vertical axis.<br />
Seismograms were low pass filtered (filter cutoffs 0 to 1 Hz).
<strong>Using</strong> <strong>AmaSeis</strong>… Page 54 of 69<br />
Figure 63. Vertical (Z) component <strong>seismogram</strong> for <strong>the</strong> TUC station for <strong>the</strong> Oaxaca earthquake as<br />
viewed in <strong>AmaSeis</strong>.
<strong>Using</strong> <strong>AmaSeis</strong>… Page 55 of 69<br />
Figure 64. Zooming in on <strong>the</strong> P, S <strong>and</strong> surface wave arrivals for <strong>the</strong> TUC vertical component<br />
<strong>seismogram</strong><br />
.
<strong>Using</strong> <strong>AmaSeis</strong>… Page 56 of 69<br />
Figure 65. TUC vertical component <strong>seismogram</strong> after zooming in as shown in Figure 63.
<strong>Using</strong> <strong>AmaSeis</strong>… Page 57 of 69<br />
Figure 66. The vertical component TUC <strong>seismogram</strong> aligned on <strong>the</strong> st<strong>and</strong>ard Earth travel time<br />
curves. The <strong>seismogram</strong> is positioned so that <strong>the</strong> first P arrival <strong>and</strong> <strong>the</strong> first S arrival match <strong>the</strong> P<br />
<strong>and</strong> S travel times. The inferred epicenter-to-station distance is about 20.5 degrees (2279 km).<br />
6. Downloading preassembled data sets: Seismograms for preassembled data sets can be<br />
downloaded to your computer (place in <strong>the</strong> SAC files folder in your <strong>AmaSeis</strong> folder) <strong>and</strong> <strong>the</strong>n<br />
opened using <strong>AmaSeis</strong> (see section 3.3 for information about saving <strong>seismogram</strong>s in SAC format<br />
<strong>and</strong> opening downloaded or saved SAC format <strong>seismogram</strong>s). The pre-assembled data sets can be<br />
used for viewing <strong>seismogram</strong>s from different earthquakes at different distances, experimenting with<br />
<strong>AmaSeis</strong> features such as filtering, zooming in, comparing arrivals with <strong>the</strong> travel time curves to<br />
identify phases, <strong>and</strong> S minus P location. The AS-1 <strong>seismogram</strong>s can also be used to determine<br />
magnitudes using <strong>the</strong> AS-1 Magnitude Calculator (MagCalc). Earthquake location using <strong>the</strong> S<br />
minus P method can be displayed using <strong>the</strong> online mapping tool in <strong>the</strong> IRIS Event Search website.<br />
Instructions are available at:<br />
http://web.ics.purdue.edu/~braile/edumod/eqdata/eqdata.htm (see section 2).<br />
Additional instructions are included in <strong>the</strong> IRIS Event Search web pages at:<br />
http://www.iris.edu/quakes/eventSearchInstructions.htm.<br />
Some preassembled data sets are provided below:
<strong>Using</strong> <strong>AmaSeis</strong>… Page 58 of 69<br />
6.1 M7.5 September 30, 1999 Oaxaca, Mexico earthquake recorded at GSN stations CCM<br />
(Ca<strong>the</strong>dral Caves, MO), TUC (Tucson, AZ), NNA (Nana, Peru), <strong>and</strong> KIP (Kipapa, HI) –<br />
click on <strong>the</strong> SAC files below to download (useful for S minus P location exercise; see<br />
example in: http://web.ics.purdue.edu/~braile/edumod/eqdata/eqdata.htm, section 2):<br />
CCM.00.BHZ.D.SAC, TUC.00.BHZ.D.SAC, NNA.00.BHZ.D.SAC, KIP.00.BHZ.D.SAC<br />
Station coordinates (degrees latitude, degrees longitude): CCM: 30.056, -91.245; TUC: 32.310,<br />
-110.785; NNA: -11.987, -76.842; KIP: 21.423, -158.015.<br />
Earthquake epicenter (degrees latitude, degrees longitude): 16.01, -96.93.<br />
Suggested map area (latitude <strong>and</strong> longitude range, in degrees; for IRIS Event Search <strong>and</strong> S<br />
minus P location map): -15 to 55, -165 to -65.<br />
6.2 M6.5 September 22, 2003 Dominican Republic earthquake recorded at GSN station<br />
SJG (San Juan, Puerto Rico), <strong>and</strong> AS-1 stations ECK (Eckard College, FL), WLIN (West<br />
Lafayette, IN), <strong>and</strong> BCMA (Boston College, MA) – click on <strong>the</strong> SAC files below to<br />
download (useful for S minus P location exercise <strong>and</strong> magnitude calculations using<br />
MagCalc for <strong>the</strong> AS-1 <strong>seismogram</strong>s):<br />
03092204SJG.00.BHZ.R.SAC, 03092204eck.sac, 03092204WLIN.sac, 03092204BCMA.sac<br />
Station coordinates (degrees latitude, degrees longitude): SJG: 18.112, -66.150; ECK: 27.750, -<br />
82.670; WLIN: 40.484, -86.881; BCMA: 42.335, -71.171.<br />
Earthquake epicenter (degrees latitude, degrees longitude): 19.675, -70.666.<br />
Suggested map area (latitude <strong>and</strong> longitude range, in degrees; for IRIS Event Search <strong>and</strong> S<br />
minus P location map): 10 to 50, -100 to -55.<br />
6.3 M5.0 June 18, 2002 Evansville, IN earthquake recorded at GSN stations CCM<br />
(Ca<strong>the</strong>dral Cave, MO) <strong>and</strong> WCI (Wy<strong>and</strong>otte Cave, IN), AS-1 station WLIN (West<br />
Lafayette, Indiana), <strong>and</strong> PEPP station PPNVW (Northview High School, Brazil, IN) –<br />
click on <strong>the</strong> SAC files below to download (useful for S minus P location exercise <strong>and</strong><br />
magnitude calculations (for <strong>the</strong> mbLg magnitude) using MagCalc for <strong>the</strong> AS-1<br />
<strong>seismogram</strong>):<br />
CCM.BHZ.D.SAC, WCI.BHZ.D.SAC, WLIN.AS1.SAC, PPNVW.BHZ.Short.sac<br />
Station coordinates (degrees latitude, degrees longitude): CCM: 30.056, -91.245; WCI: 38.229,<br />
-86.294; WLIN: 40.484, -86.881; PPNVW: 39.518, -87.166.<br />
Earthquake epicenter (degrees latitude, degrees longitude): 37.987, -87.778.<br />
Suggested map area (latitude <strong>and</strong> longitude range, in degrees; for IRIS Event Search <strong>and</strong> S<br />
minus P location map): 34 to 42, -92 to -82.<br />
7. Exporting <strong>seismogram</strong>s to <strong>the</strong> Seismic Waves program: The <strong>AmaSeis</strong> software can be used<br />
to export AS-1 or o<strong>the</strong>r SAC-format <strong>seismogram</strong>s to <strong>the</strong> Seismic Waves program<br />
(http://www.geol.binghamton.edu/faculty/jones/) for viewing <strong>the</strong> seismic wave arrivals in speeded<br />
up time, along with a simulation of seismic wave propagation through <strong>the</strong> Earth. The display can be
<strong>Using</strong> <strong>AmaSeis</strong>… Page 59 of 69<br />
used with one or more <strong>seismogram</strong>s <strong>and</strong> is useful for illustrating seismic wave propagation<br />
concepts. Because <strong>seismogram</strong>s that were recorded on classroom seismographs can be viewed in<br />
<strong>the</strong> Seismic Waves program, <strong>the</strong> display is also an interesting method for students <strong>and</strong> teachers to<br />
view “<strong>the</strong>ir” data.<br />
7.1 Exporting <strong>seismogram</strong>s: Seismograms can be opened <strong>and</strong> exported to Seismic Waves<br />
using <strong>AmaSeis</strong>. The <strong>AmaSeis</strong> software creates files with station <strong>and</strong> event coordinates, origin<br />
time <strong>and</strong> <strong>seismogram</strong> start times <strong>and</strong> moves <strong>the</strong> files <strong>and</strong> <strong>the</strong> <strong>seismogram</strong>s to <strong>the</strong> Seismic Waves<br />
folder. We will utilize an example for <strong>the</strong> November 21, 2004, M6.3 Leeward Isl<strong>and</strong>s<br />
earthquake <strong>and</strong> three AS-1 <strong>seismogram</strong>s (recorded at stations NLHS, WLIN <strong>and</strong> PCAZ) that<br />
were downloaded from <strong>the</strong> SpiNet website. After <strong>the</strong> <strong>seismogram</strong>s were downloaded from<br />
SpiNet using <strong>the</strong> techniques described in section 4.1, above, <strong>the</strong> <strong>seismogram</strong>s were opened one<br />
by one in <strong>AmaSeis</strong> (Figures 67-69) <strong>and</strong> <strong>the</strong> Event Dialog box opened from <strong>the</strong> Settings menu.<br />
In <strong>the</strong> Event Dialog box, enter <strong>the</strong> event name, in this case, Leeward Isl<strong>and</strong>s, <strong>the</strong> earthquake<br />
magnitude, origin time <strong>and</strong> location (latitude longitude <strong>and</strong> depth). Some information, including<br />
<strong>the</strong> <strong>seismogram</strong> start time will already be entered into <strong>the</strong> Event Dialog box from <strong>the</strong> SACformat<br />
<strong>seismogram</strong> file. Be sure to check <strong>the</strong> earthquake origin time entry. If <strong>the</strong> AS-1<br />
<strong>seismogram</strong> was recorded on a computer that has a clock that was synchronized to UTC time,<br />
no adjustment in <strong>the</strong> start time will be necessary. In <strong>the</strong> case of <strong>the</strong> NLHS <strong>and</strong> PCAZ<br />
<strong>seismogram</strong>s, <strong>the</strong> start times had to be adjusted (time-corrected). For <strong>the</strong> NLHS <strong>seismogram</strong>, 57<br />
seconds was subtracted from <strong>the</strong> start time that was read from <strong>the</strong> SAC-format <strong>seismogram</strong>. For<br />
<strong>the</strong> PCAZ <strong>seismogram</strong>, 48 seconds was added to <strong>the</strong> start time that was read from <strong>the</strong> SACformat<br />
<strong>seismogram</strong>. These corrections were determined by calculating <strong>the</strong> <strong>the</strong>oretical arrival<br />
times of <strong>the</strong> first P arrival at each station (using <strong>the</strong> USGS online travel time tool,<br />
http://neic.usgs.gov/neis/travel_times/) <strong>and</strong> comparing with <strong>the</strong> observed arrival times as<br />
measured using <strong>the</strong> <strong>AmaSeis</strong> arrival picking tool. This method assumes that <strong>the</strong> observed<br />
arrival time at <strong>the</strong> two stations should be equal to <strong>the</strong> <strong>the</strong>oretical arrival time calculated for a<br />
st<strong>and</strong>ard Earth velocity model.<br />
After <strong>the</strong>se data entries have been made in <strong>the</strong> Event Dialog box, enter <strong>the</strong> location <strong>and</strong> name of<br />
your Seismic Waves folder in <strong>the</strong> space provided at <strong>the</strong> bottom of <strong>the</strong> box. This location <strong>and</strong><br />
name will usually be C:\sw (if <strong>the</strong> Seismic Waves program was installed on your computer<br />
using <strong>the</strong> default installation options) although in <strong>the</strong> example shown here, <strong>the</strong> name <strong>and</strong><br />
location are D:\seiswave. To save a copy of <strong>the</strong> time corrected <strong>seismogram</strong>, click OK <strong>and</strong> <strong>the</strong>n<br />
save <strong>the</strong> <strong>seismogram</strong> as a SAC file (using <strong>the</strong> Save As comm<strong>and</strong> as described in section 3.3,<br />
above). To export <strong>the</strong> <strong>seismogram</strong> to <strong>the</strong> Seismic Waves folder, click on Create files for<br />
Seismic Waves. Complete this process for one or more <strong>seismogram</strong>s (as shown in Figures 67-<br />
69 for <strong>the</strong> Leeward Isl<strong>and</strong> earthquake <strong>and</strong> <strong>the</strong> NLHS, WLIN <strong>and</strong> PCAZ <strong>seismogram</strong>s). <strong>Using</strong><br />
this procedure, <strong>the</strong> <strong>AmaSeis</strong> software creates a folder <strong>and</strong> an event file in <strong>the</strong> Seismic Waves<br />
folder that are used while running <strong>the</strong> Seismic Waves program.<br />
The three <strong>seismogram</strong>s (AS-1 <strong>seismogram</strong>s; SAC format) used in this example can be<br />
downloaded by clicking on <strong>the</strong> file names shown below. The <strong>seismogram</strong>s are time corrected so<br />
that no time correction is needed in <strong>the</strong> Event Dialog boxes for exporting <strong>the</strong> <strong>seismogram</strong>s to <strong>the</strong><br />
Seismic Waves program. After <strong>the</strong> <strong>seismogram</strong>s have been exported, <strong>the</strong> Seismic Waves<br />
program can be used to view <strong>the</strong>m in speeded up time <strong>and</strong> simultaneously with a wave<br />
propagation simulation.<br />
Seismograms for <strong>the</strong> November 21, 2004 Leeward Isl<strong>and</strong>s earthquake:
<strong>Using</strong> <strong>AmaSeis</strong>… Page 60 of 69<br />
0411211147NLHS.sac, 0411211147WLIN.sac, 0411211149PCAZ.sac<br />
Figure 67. Seismogram for <strong>the</strong> Leeward Isl<strong>and</strong>s earthquake recorded by <strong>the</strong> AS-1 seismograph at<br />
NLHS, <strong>and</strong> Event Dialog box with earthquake <strong>and</strong> <strong>seismogram</strong> data.
<strong>Using</strong> <strong>AmaSeis</strong>… Page 61 of 69<br />
Figure 68. Seismogram for <strong>the</strong> Leeward Isl<strong>and</strong>s earthquake recorded by <strong>the</strong> AS-1 seismograph at<br />
WLIN, <strong>and</strong> Event Dialog box with earthquake <strong>and</strong> <strong>seismogram</strong> data.
<strong>Using</strong> <strong>AmaSeis</strong>… Page 62 of 69<br />
Figure 69. Seismogram for <strong>the</strong> Leeward Isl<strong>and</strong>s earthquake recorded by <strong>the</strong> AS-1 seismograph at<br />
PCAZ, <strong>and</strong> Event Dialog box with earthquake <strong>and</strong> <strong>seismogram</strong> data.<br />
7.2 Displaying <strong>the</strong> <strong>seismogram</strong>s in Seismic Waves: After new event information <strong>and</strong><br />
associated <strong>seismogram</strong>s have been exported to Seismic Waves, opening <strong>the</strong> Seismic Waves<br />
program results in a world map screen similar to that shown in Figure 70. Selecting <strong>the</strong><br />
Leeward Isl<strong>and</strong>s event produces an Event Information dialog box as shown in Figure 71. In<br />
<strong>the</strong> Event Information dialog box, click on Select Stations. The station map shown in Figure<br />
72 will appear. Click on each station (white dot) <strong>and</strong> <strong>the</strong> Station Components dialog box for<br />
that station will appear (Figure 73). Click on <strong>the</strong> selection box next to <strong>the</strong> Z (vertical)<br />
component <strong>the</strong>n click on OK. The white dot on <strong>the</strong> station map will change to red indicating<br />
that <strong>the</strong> station has been selected. After all stations have been selected, click on <strong>the</strong> event<br />
epicenter on <strong>the</strong> station map to start <strong>the</strong> display of <strong>the</strong> <strong>seismogram</strong>s <strong>and</strong> <strong>the</strong> seismic wave<br />
propagation simulation (Figures 74 <strong>and</strong> 75).
<strong>Using</strong> <strong>AmaSeis</strong>… Page 63 of 69<br />
Figure 70. Seismic Waves world map display showing <strong>the</strong> earthquakes for which <strong>seismogram</strong>s are<br />
available for viewing. Select an event to view <strong>seismogram</strong>s <strong>and</strong> wave propagation simulation.<br />
Figure 71. Event Information dialog box for <strong>the</strong> Leeward Isl<strong>and</strong>s earthquake. Click on Select<br />
Stations to display <strong>the</strong> map shown in Figure 72 <strong>and</strong> select <strong>the</strong> <strong>seismogram</strong>s to include in <strong>the</strong> record<br />
section display. On subsequent runs of Seismic Waves, just select GO.
<strong>Using</strong> <strong>AmaSeis</strong>… Page 64 of 69<br />
Figure 72. Station map for <strong>the</strong> Leeward Isl<strong>and</strong>s earthquake. Select each station (click on <strong>the</strong> dot<br />
next to <strong>the</strong> station names) to open <strong>the</strong> Station Component dialog box (Figure 73) <strong>and</strong> select <strong>the</strong><br />
<strong>seismogram</strong> by identifying <strong>the</strong> component (Z for vertical, N-S for North-South horizontal or E-W for<br />
East-West horizontal). Click on <strong>the</strong> epicenter (star) to start <strong>the</strong> Seismic Waves display of<br />
<strong>seismogram</strong>s <strong>and</strong> wave propagation simulation.
<strong>Using</strong> <strong>AmaSeis</strong>… Page 65 of 69<br />
Figure 73. Station Components dialog box for <strong>the</strong> Leeward Isl<strong>and</strong>s earthquake <strong>and</strong> <strong>the</strong> NLHS<br />
station. Select <strong>the</strong> Z (vertical) component <strong>and</strong> click on OK.<br />
Figure 74. Seismic Waves Leeward Isl<strong>and</strong>s <strong>seismogram</strong>s display <strong>and</strong> wave propagation<br />
simulations after about 10 minutes of wave propagation time. The speed of <strong>the</strong> playback can be
<strong>Using</strong> <strong>AmaSeis</strong>… Page 66 of 69<br />
controlled using <strong>the</strong> slider to <strong>the</strong> right of <strong>the</strong> cross section display (set at 20 times real time<br />
playback speed for this example).<br />
Figure 75. Seismic Waves Leeward Isl<strong>and</strong>s <strong>seismogram</strong>s display <strong>and</strong> wave propagation<br />
simulations after about 24 minutes of wave propagation time.<br />
8. Downloading <strong>the</strong> WLIN AS-1 2003.zip seismic data (<strong>and</strong> 2004 <strong>and</strong> 2005):<br />
Download <strong>the</strong> 2003.zip file to provide sample seismic data for <strong>AmaSeis</strong> (you do not need to have<br />
an AS-1 seismograph to utilize <strong>the</strong>se data, only <strong>the</strong> <strong>AmaSeis</strong> software). The file is zipped<br />
(compressed). The 2003 folder contains data recorded at <strong>the</strong> WLIN AS-1 seismograph station for<br />
September, 2003 <strong>and</strong> is about 15 MB in size (data for <strong>the</strong> following dates have been deleted to make<br />
<strong>the</strong> file easier to download: September 1, 3, 9-12, 14-17, 20, 23, 24, 26, <strong>and</strong> 28 – no significant<br />
events were recorded on those dates). Data are also available for <strong>the</strong> WLIN station for selected<br />
days in 2004 (November <strong>and</strong> December, 2004 [including <strong>the</strong> December 26, 2004 M9.0 Sumatra<br />
earthquake], only days with events, ~17MB) <strong>and</strong> 2005 (March through September, 2005, only days<br />
with events, ~46MB). An Excel file (<strong>the</strong> station catalog for AS-1 station WLIN with information<br />
on <strong>the</strong> earthquakes in <strong>the</strong> 2003.zip, 2004.zip <strong>and</strong> 2005.zip data sets) is also available at:<br />
http://web.ics.purdue.edu/~braile/new/EarthquakeList.xls.
<strong>Using</strong> <strong>AmaSeis</strong>… Page 67 of 69<br />
To download <strong>the</strong> WLIN 2003 (or 2004 or 2005) folder click here: 2003 (or 2004 or 2005) A File<br />
Download dialog box will appear. Click on Save. A Save As dialog box will appear. Save<br />
2003.zip (or 2004.zip or 2005.zip) in <strong>the</strong> default location or navigate to ano<strong>the</strong>r folder (it’s<br />
convenient to place a “Downloads” folder on your desktop for <strong>the</strong>se tasks) using <strong>the</strong> down arrow or<br />
<strong>the</strong> folder icon. Click on Save.<br />
The 2003.zip file is compressed (zipped) using a program called WinZip. WinZip 8.1 (or higher)<br />
can be obtained at http://www.tucows.com (search for WinZip). It is shareware <strong>and</strong> you can use an<br />
evaluation version. O<strong>the</strong>r zip programs can also be used <strong>and</strong> may already be on your computer. To<br />
unzip <strong>the</strong> 2003.zip (or 2004.zip or 2005.zip) file after download, double click on <strong>the</strong> 2003.zip (or<br />
2004.zip or 2005.zip) file. (If you’ve previously installed <strong>the</strong> WinZip program, you should be<br />
able to simply right click with <strong>the</strong> mouse on <strong>the</strong> downloaded file [2003.zip, 2004.zip or<br />
2005.zip] <strong>and</strong> select “Extract to…” to unzip <strong>the</strong> file <strong>and</strong> place it in your <strong>AmaSeis</strong> folder. This<br />
shortcut avoids <strong>the</strong> more lengthy procedure illustrated below.) The WinZip program will open<br />
a dialog box as shown below (Figure 76):<br />
Figure 76. WinZip dialog box when <strong>downloading</strong> <strong>the</strong> 2003 folder.<br />
Choose Select All from <strong>the</strong> Actions menu <strong>and</strong> <strong>the</strong>n click on <strong>the</strong> Extract icon. An Extract dialog<br />
box as shown in Figure 77 will appear. Use <strong>the</strong> default location to save your unzipped 2003 folder<br />
or navigate to ano<strong>the</strong>r location. Click on Extract. A folder called 2003 (or 2004 or 2005,<br />
depending on which file has been selected) will be created. Note that <strong>the</strong> files within <strong>the</strong> subfolders
<strong>Using</strong> <strong>AmaSeis</strong>… Page 68 of 69<br />
within <strong>the</strong> 2003 (or 2004 or 2005) folder will remain compressed (zip) files. The <strong>AmaSeis</strong> program<br />
uses <strong>the</strong> files in this form (opening <strong>and</strong> saving) in order to minimize data storage space on your hard<br />
drive.<br />
Figure 77. WinZip Extract screen that allows one to navigate to <strong>the</strong> desired location for writing <strong>the</strong><br />
2003 folder.<br />
Place <strong>the</strong> 2003, 2004 or 2005 folder in <strong>the</strong> <strong>AmaSeis</strong> folder. (If you have recorded data from an<br />
AS-1 on your computer during 2003, 2004 or 2005, be sure to not copy <strong>the</strong> WLIN 2003, 2004<br />
or 2005 data file over your 2003, 2004 or 2005 folder. You can download <strong>the</strong> WLIN 2003<br />
folder <strong>and</strong> preserve your 2003, 2004 or 2005 folder by temporarily moving your 2003, 2004 or<br />
2005 folder to ano<strong>the</strong>r folder or by temporarily renaming it.) You can now run <strong>AmaSeis</strong> <strong>and</strong><br />
view <strong>the</strong> 2003, 2004 or 2005 WLIN data as if <strong>the</strong>se data were originally recorded on your computer.<br />
9. A note on connections to national education st<strong>and</strong>ards: This tutorial/website is primarily a<br />
resource for underst<strong>and</strong>ing <strong>the</strong> use of <strong>the</strong> <strong>AmaSeis</strong> software <strong>and</strong> related data access tools so that<br />
seismic data can be used to learn about earthquakes, seismology <strong>and</strong> related Earth science. This<br />
software, <strong>the</strong> included tools <strong>and</strong> <strong>the</strong> data sources will allow <strong>the</strong> user to perform educational<br />
activities related to earthquakes <strong>and</strong> seismology <strong>and</strong> to explore real seismological data. Activities<br />
<strong>and</strong> lessons related to earthquake location, wave <strong>and</strong> energy propagation, natural hazards, data<br />
analysis <strong>and</strong> interpretation, <strong>and</strong> use of technology can be utilized with <strong>the</strong>se resources. These<br />
activities, skills <strong>and</strong> topics are included in Teaching St<strong>and</strong>ards, Earth science <strong>and</strong> physical science<br />
Content St<strong>and</strong>ards of <strong>the</strong> National Science Education St<strong>and</strong>ards (NSES; NRC, 1996) as listed<br />
below.<br />
Teaching St<strong>and</strong>ards: inquiry-based (A, B).<br />
Professional Development St<strong>and</strong>ards: opportunity for learning new Earth science content (A, C).<br />
Content St<strong>and</strong>ards: Science as Inquiry – practice inquiry <strong>and</strong> fundamental science skills (grades<br />
5-8 <strong>and</strong> 9-12, A); Physical Science – properties of matter, motion, transfer of energy (grades 5-8,<br />
B), structure of matter, motion, interactions of energy <strong>and</strong> matter (grades 9-12, B); Earth <strong>and</strong><br />
Space Science – relate to energy in <strong>the</strong> Earth system (grades 9-12, D).
<strong>Using</strong> <strong>AmaSeis</strong>… Page 69 of 69<br />
10. References:<br />
Bolt, B.A., Earthquakes <strong>and</strong> Geological Discovery, Scientific American Library, W.H. Freeman,<br />
New York, 229 pp., 1993.<br />
National Research Council, National Science Education St<strong>and</strong>ards, National Academy of Sciences,<br />
Washington, D.C., 262 pp., 1996.<br />
Shearer, P. M., Introduction to Seismology, Cambridge University Press, Cambridge, UK, 260pp,<br />
1999.