Using the AmaSeis seismogram viewer and downloading - QuarkNet
Using the AmaSeis seismogram viewer and downloading - QuarkNet
Using the AmaSeis seismogram viewer and downloading - QuarkNet

Create successful ePaper yourself
Turn your PDF publications into a flip-book with our unique Google optimized e-Paper software.
<strong>Using</strong> <strong>AmaSeis</strong>… Page 10 of 69<br />
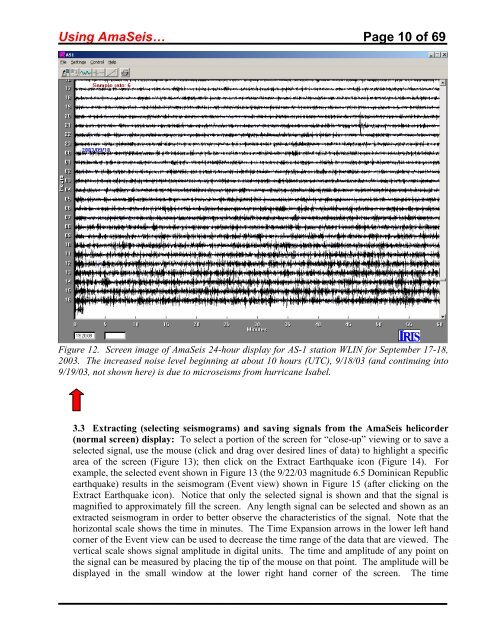
Figure 12. Screen image of <strong>AmaSeis</strong> 24-hour display for AS-1 station WLIN for September 17-18,<br />
2003. The increased noise level beginning at about 10 hours (UTC), 9/18/03 (<strong>and</strong> continuing into<br />
9/19/03, not shown here) is due to microseisms from hurricane Isabel.<br />
3.3 Extracting (selecting <strong>seismogram</strong>s) <strong>and</strong> saving signals from <strong>the</strong> <strong>AmaSeis</strong> helicorder<br />
(normal screen) display: To select a portion of <strong>the</strong> screen for “close-up” viewing or to save a<br />
selected signal, use <strong>the</strong> mouse (click <strong>and</strong> drag over desired lines of data) to highlight a specific<br />
area of <strong>the</strong> screen (Figure 13); <strong>the</strong>n click on <strong>the</strong> Extract Earthquake icon (Figure 14). For<br />
example, <strong>the</strong> selected event shown in Figure 13 (<strong>the</strong> 9/22/03 magnitude 6.5 Dominican Republic<br />
earthquake) results in <strong>the</strong> <strong>seismogram</strong> (Event view) shown in Figure 15 (after clicking on <strong>the</strong><br />
Extract Earthquake icon). Notice that only <strong>the</strong> selected signal is shown <strong>and</strong> that <strong>the</strong> signal is<br />
magnified to approximately fill <strong>the</strong> screen. Any length signal can be selected <strong>and</strong> shown as an<br />
extracted <strong>seismogram</strong> in order to better observe <strong>the</strong> characteristics of <strong>the</strong> signal. Note that <strong>the</strong><br />
horizontal scale shows <strong>the</strong> time in minutes. The Time Expansion arrows in <strong>the</strong> lower left h<strong>and</strong><br />
corner of <strong>the</strong> Event view can be used to decrease <strong>the</strong> time range of <strong>the</strong> data that are viewed. The<br />
vertical scale shows signal amplitude in digital units. The time <strong>and</strong> amplitude of any point on<br />
<strong>the</strong> signal can be measured by placing <strong>the</strong> tip of <strong>the</strong> mouse on that point. The amplitude will be<br />
displayed in <strong>the</strong> small window at <strong>the</strong> lower right h<strong>and</strong> corner of <strong>the</strong> screen. The time