Using the AmaSeis seismogram viewer and downloading - QuarkNet
Using the AmaSeis seismogram viewer and downloading - QuarkNet
Using the AmaSeis seismogram viewer and downloading - QuarkNet

You also want an ePaper? Increase the reach of your titles
YUMPU automatically turns print PDFs into web optimized ePapers that Google loves.
<strong>Using</strong> <strong>AmaSeis</strong>… Page 21 of 69<br />
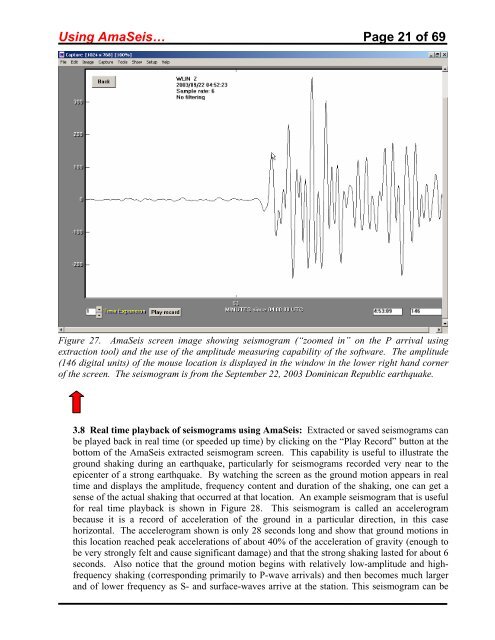
Figure 27. <strong>AmaSeis</strong> screen image showing <strong>seismogram</strong> (“zoomed in” on <strong>the</strong> P arrival using<br />
extraction tool) <strong>and</strong> <strong>the</strong> use of <strong>the</strong> amplitude measuring capability of <strong>the</strong> software. The amplitude<br />
(146 digital units) of <strong>the</strong> mouse location is displayed in <strong>the</strong> window in <strong>the</strong> lower right h<strong>and</strong> corner<br />
of <strong>the</strong> screen. The <strong>seismogram</strong> is from <strong>the</strong> September 22, 2003 Dominican Republic earthquake.<br />
3.8 Real time playback of <strong>seismogram</strong>s using <strong>AmaSeis</strong>: Extracted or saved <strong>seismogram</strong>s can<br />
be played back in real time (or speeded up time) by clicking on <strong>the</strong> “Play Record” button at <strong>the</strong><br />
bottom of <strong>the</strong> <strong>AmaSeis</strong> extracted <strong>seismogram</strong> screen. This capability is useful to illustrate <strong>the</strong><br />
ground shaking during an earthquake, particularly for <strong>seismogram</strong>s recorded very near to <strong>the</strong><br />
epicenter of a strong earthquake. By watching <strong>the</strong> screen as <strong>the</strong> ground motion appears in real<br />
time <strong>and</strong> displays <strong>the</strong> amplitude, frequency content <strong>and</strong> duration of <strong>the</strong> shaking, one can get a<br />
sense of <strong>the</strong> actual shaking that occurred at that location. An example <strong>seismogram</strong> that is useful<br />
for real time playback is shown in Figure 28. This <strong>seismogram</strong> is called an accelerogram<br />
because it is a record of acceleration of <strong>the</strong> ground in a particular direction, in this case<br />
horizontal. The accelerogram shown is only 28 seconds long <strong>and</strong> show that ground motions in<br />
this location reached peak accelerations of about 40% of <strong>the</strong> acceleration of gravity (enough to<br />
be very strongly felt <strong>and</strong> cause significant damage) <strong>and</strong> that <strong>the</strong> strong shaking lasted for about 6<br />
seconds. Also notice that <strong>the</strong> ground motion begins with relatively low-amplitude <strong>and</strong> highfrequency<br />
shaking (corresponding primarily to P-wave arrivals) <strong>and</strong> <strong>the</strong>n becomes much larger<br />
<strong>and</strong> of lower frequency as S- <strong>and</strong> surface-waves arrive at <strong>the</strong> station. This <strong>seismogram</strong> can be