Using the AmaSeis seismogram viewer and downloading - QuarkNet
Using the AmaSeis seismogram viewer and downloading - QuarkNet
Using the AmaSeis seismogram viewer and downloading - QuarkNet

You also want an ePaper? Increase the reach of your titles
YUMPU automatically turns print PDFs into web optimized ePapers that Google loves.
<strong>Using</strong> <strong>AmaSeis</strong>… Page 15 of 69<br />
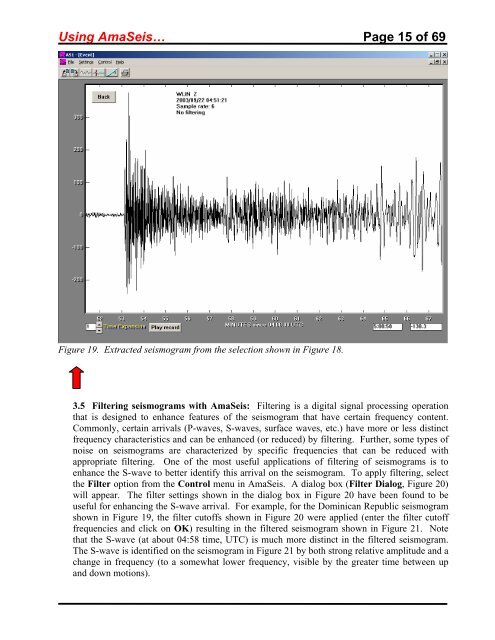
Figure 19. Extracted <strong>seismogram</strong> from <strong>the</strong> selection shown in Figure 18.<br />
3.5 Filtering <strong>seismogram</strong>s with <strong>AmaSeis</strong>: Filtering is a digital signal processing operation<br />
that is designed to enhance features of <strong>the</strong> <strong>seismogram</strong> that have certain frequency content.<br />
Commonly, certain arrivals (P-waves, S-waves, surface waves, etc.) have more or less distinct<br />
frequency characteristics <strong>and</strong> can be enhanced (or reduced) by filtering. Fur<strong>the</strong>r, some types of<br />
noise on <strong>seismogram</strong>s are characterized by specific frequencies that can be reduced with<br />
appropriate filtering. One of <strong>the</strong> most useful applications of filtering of <strong>seismogram</strong>s is to<br />
enhance <strong>the</strong> S-wave to better identify this arrival on <strong>the</strong> <strong>seismogram</strong>. To apply filtering, select<br />
<strong>the</strong> Filter option from <strong>the</strong> Control menu in <strong>AmaSeis</strong>. A dialog box (Filter Dialog, Figure 20)<br />
will appear. The filter settings shown in <strong>the</strong> dialog box in Figure 20 have been found to be<br />
useful for enhancing <strong>the</strong> S-wave arrival. For example, for <strong>the</strong> Dominican Republic <strong>seismogram</strong><br />
shown in Figure 19, <strong>the</strong> filter cutoffs shown in Figure 20 were applied (enter <strong>the</strong> filter cutoff<br />
frequencies <strong>and</strong> click on OK) resulting in <strong>the</strong> filtered <strong>seismogram</strong> shown in Figure 21. Note<br />
that <strong>the</strong> S-wave (at about 04:58 time, UTC) is much more distinct in <strong>the</strong> filtered <strong>seismogram</strong>.<br />
The S-wave is identified on <strong>the</strong> <strong>seismogram</strong> in Figure 21 by both strong relative amplitude <strong>and</strong> a<br />
change in frequency (to a somewhat lower frequency, visible by <strong>the</strong> greater time between up<br />
<strong>and</strong> down motions).