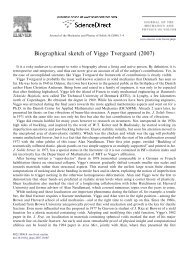
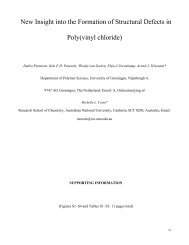
Semicond. Sci. Technol. 28 (2013) 025006(a)(c)Figure 3. (a) Model for <strong>the</strong> resistance <strong>of</strong> an <strong>ohmic</strong> contact as afunction <strong>of</strong> <strong>annealing</strong> time at constant temperature. The resistanceR Ge <strong>of</strong> <strong>the</strong> Al x Ga 1−x As layers (dashed line) decreases in time due <strong>to</strong>increased Ge doping. The interface resistance R if between <strong>the</strong>surface metalization and <strong>the</strong> Ge-doped Al x Ga 1−x As layers (solidblack line) increases in time due <strong>to</strong> a decreasing<strong>Ni</strong>-grain–Al x Ga 1−x As interface area. The time where <strong>the</strong> sum <strong>of</strong><strong>the</strong>se <strong>two</strong> resistances (gray solid line) shows a minimum defines <strong>the</strong>optimum <strong>annealing</strong> time t A,Opt . (b) Effective velocity <strong>of</strong> optimalcontact formation v ocf as a function <strong>of</strong> temperature (equation (6)),plotted for parameters that give <strong>the</strong> best fit in (c). (c) Optimal<strong>annealing</strong> times as <strong>the</strong> 2DEG depth and <strong>annealing</strong> temperature isvaried (same experimental data as in figure 1(c)). The solid graylines (left <strong>to</strong> right for 500, 450 and 400 ◦ C) represent fits using <strong>the</strong>model <strong>of</strong> equations (5) and (6) (see text for details).proportional <strong>to</strong> <strong>the</strong> doping concentration [6]. Thus, we assumethat∫1R Ge ∝dz, (3)C(z)/C 0where C(z)/C 0 is <strong>the</strong> local Ge concentration at depth z as inequation (1), and where <strong>the</strong> integral runs from <strong>the</strong> depth <strong>of</strong> <strong>the</strong><strong>Au</strong> and <strong>Ni</strong> grains <strong>to</strong> <strong>the</strong> depth <strong>of</strong> <strong>the</strong> 2DEG. The behavior <strong>of</strong>this equation is that R Ge first rapidly decreases, and <strong>the</strong>n curves<strong>of</strong>f <strong>to</strong> saturate at a level that is proportional <strong>to</strong> d (dashed curvein figure 3(a)).To model R if , we assume that <strong>the</strong> increase in resistance forover annealed <strong>contacts</strong> is related <strong>to</strong> <strong>the</strong> decrease in <strong>Ni</strong>-grain–Al x Ga 1−x As interface area. Imagine, for simplicity, a single,square-shaped <strong>Ni</strong>-rich grain with area A <strong>Ni</strong> = L<strong>Ni</strong> 2 . We model<strong>the</strong> reduction <strong>of</strong> this area as a sideways diffusion process <strong>of</strong> <strong>Au</strong>,again with a time-dependence as simple diffusion analogues<strong>to</strong> equation (1). The length <strong>of</strong> a side is <strong>the</strong>n reduced as(b)E J Koop et alL <strong>Ni</strong> (t) ≈ L 0 − 2 √ 4D <strong>Au</strong> t, where L 0 is <strong>the</strong> initial grain size,and D <strong>Au</strong> <strong>the</strong> diffusion constant for this process, such thatR if ∝1(L 0 − 2 √ 4D <strong>Au</strong> t ) 2 . (4)For a very wide parameter range, this model gives that R ifincreases more or less linearly in time (solid black curve infigure 3(a)) 8 . A resistance increase that is much stronger thanlinear only sets in when <strong>the</strong> <strong>to</strong>tal interface area approacheszero, when <strong>the</strong> contact is already strongly over annealed. The<strong>to</strong>tal contact resistance is <strong>the</strong> sum <strong>of</strong> R Ge and R if (gray solidcurve figure 3(a)), and <strong>the</strong> optimal <strong>annealing</strong> time is <strong>the</strong>ndefined as <strong>the</strong> time where this sum shows a minimum value.We can reduce <strong>the</strong> number <strong>of</strong> fitting parameters for thismodeling <strong>to</strong> only <strong>two</strong> with <strong>the</strong> following approach. For R Ge inequation (3), we assume parameters where R Ge saturates at avalue below, but on <strong>the</strong> order <strong>of</strong> <strong>the</strong> optimal contact resistanceR opt . We also assume that this saturation occurs in a timescale on <strong>the</strong> order <strong>of</strong> a few times <strong>the</strong> optimal <strong>annealing</strong> time.For R if in equation (4), we assume that it has a value belowR opt for t = 0, and that it increases more or less in a linearfashion <strong>to</strong> a value <strong>of</strong> order R opt . This increase should takeplace in a time scale on <strong>the</strong> order <strong>of</strong> <strong>the</strong> optimal <strong>annealing</strong>time. Numerically investigating this model <strong>the</strong>n shows thatit has for a very wide parameter range <strong>the</strong> behavior that <strong>the</strong>increase <strong>of</strong> optimal <strong>annealing</strong> time t A,Opt with increasing 2DEGdepth d is close <strong>to</strong> linear. We can express this using an effectivevelocity for optimal contact formation v ocf ,t A,Opt = d/v ocf . (5)Fur<strong>the</strong>rmore, numerical investigation <strong>of</strong> <strong>the</strong> temperaturedependence shows that v ocf behaves according <strong>to</strong>(v ocf (T) = v 0 exp − E )a(6)k B Twhen <strong>the</strong> diffusion processes that underlie equations (3) and(4) are both <strong>the</strong>rmally activated with a similar activation energyE a . We can now fit this model <strong>to</strong> our experimental data onlyusing equations (5) and (6), such that we only have v 0 and E aas fitting parameters. In doing so, we take again in<strong>to</strong> accountthat <strong>the</strong> temperature T(t) is not constant during <strong>annealing</strong>, anduse again pr<strong>of</strong>iles as in figure 1(a).The results <strong>of</strong> this fitting are presented in figure 3(c), andv ocf as a function <strong>of</strong> temperature for <strong>the</strong>se fitting parameters(E a = 0.6 eV and v 0 = 7.6 × 10 −5 m s −1 ) is plotted infigure 3(b). While it is a crude model, <strong>the</strong> fits are veryreasonable, showing that <strong>the</strong> model is useful for predictingoptimal <strong>annealing</strong> times (note that we use here <strong>the</strong> sameactivation energies and diffusion constants for <strong>Au</strong> and Ge,this is a reasonable approach since <strong>the</strong> values are found <strong>to</strong> bevery close <strong>to</strong> each o<strong>the</strong>r [30–32]). Fur<strong>the</strong>rmore, <strong>the</strong> value forE a is a realistic number [30–32]. Our model also predicts that<strong>the</strong> minimum value <strong>of</strong> <strong>the</strong> resistance that can be achieved for8 We note that an alternative model, with only a term R Ge that increases atlong <strong>annealing</strong> times because <strong>the</strong> available area for current reduces in <strong>the</strong>same manner as for R if in equation (4), can also capture <strong>the</strong> behavior <strong>of</strong> ourobservations. However, we choose <strong>to</strong> work with a separate term R if since wecannot rule out that <strong>the</strong> interface resistance between <strong>the</strong> metalization and <strong>the</strong>AlGaAs above <strong>the</strong> 2DEG gives a significant contribution <strong>to</strong> <strong>the</strong> full contactresistance.6
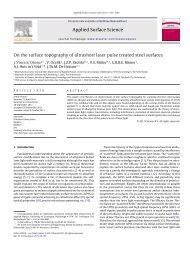
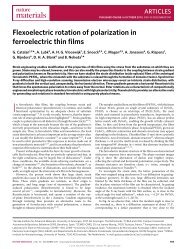
Semicond. Sci. Technol. 28 (2013) 025006optimally annealed <strong>contacts</strong> increases with increasing 2DEGdepth. We did not observe such a clear trend, probably because<strong>the</strong> resistance <strong>of</strong> optimal <strong>contacts</strong> is so low that one needs <strong>to</strong>include contributions from 2DEG square resistance aroundand underneath <strong>the</strong> contact when evaluating absolute values(fur<strong>the</strong>r discussed below).(a)(b)E J Koop et al7. Contact-shape dependenceOur model for <strong>the</strong> <strong>annealing</strong> <strong>mechanism</strong> implies that optimal<strong>contacts</strong> have a ra<strong>the</strong>r uniform Ge concentration throughout<strong>the</strong> Al x Ga 1−x As layers, and that this results in a value for R Ge<strong>of</strong> order 10 . This implies that <strong>the</strong> bulk resistivity in <strong>the</strong>doped Ge-doped Al x Ga 1−x As layer is around 4 m. In turn,this implies that in-plane electron transport under an optimalcontact from <strong>the</strong> metalization on <strong>the</strong> surface <strong>to</strong> 2DEG on <strong>the</strong>side <strong>of</strong> <strong>the</strong> contact still mainly takes place in <strong>the</strong> original 2DEGlayer. If <strong>the</strong> square resistance R □ for transport in <strong>the</strong> original2DEG layer below <strong>the</strong> contact does not strongly increaseduring <strong>annealing</strong>, and if it is smaller than <strong>the</strong> contact resistance,this also implies that <strong>the</strong> resistance <strong>of</strong> optimal <strong>contacts</strong> shouldbe inversely proportional <strong>to</strong> <strong>the</strong> contact area. Thus, measuringwhe<strong>the</strong>r <strong>the</strong> contact resistance depends on contact area or on<strong>the</strong> circumference <strong>of</strong> a contact can give fur<strong>the</strong>r insight in <strong>the</strong><strong>annealing</strong> <strong>mechanism</strong> and contact properties.We carried out such a study, by varying <strong>the</strong> shape <strong>of</strong><strong>contacts</strong>. All results that we discussed up <strong>to</strong> here were obtainedwith square <strong>contacts</strong> with an area A <strong>of</strong> 0.04 mm 2 and acircumference C L = 4L <strong>of</strong> 0.8 mm (on <strong>the</strong> side <strong>of</strong> a Hall bar).For <strong>the</strong> dependence on contact shape, we measured various setswhere we varied <strong>the</strong> circumference C L while keeping <strong>the</strong> areaconstant at 0.04 mm 2 , and various sets where we varied <strong>the</strong>area while keeping <strong>the</strong> circumference constant at 0.8 mm. Wevaried <strong>the</strong> shape from smooth circular shape <strong>to</strong> square shapeswith a zig-zag edge at <strong>the</strong> 50 micron scale, <strong>to</strong> avoid getting <strong>to</strong>omuch resistance contribution from square resistance <strong>of</strong> 2DEGright next <strong>to</strong> a contact (for <strong>the</strong>se devices we used electronbeamlithography). The study only used wafer A. All <strong>contacts</strong>were fabricated and annealed in one single batch <strong>to</strong> ensure thatit is meaningful <strong>to</strong> compare <strong>the</strong> values <strong>of</strong> contact resistance.For this study, we inject again current in<strong>to</strong> <strong>the</strong> contactthat is measured, and extract <strong>the</strong> current using ano<strong>the</strong>r contact.However, <strong>the</strong> dependence on contact shape can only give anunambiguous result if <strong>the</strong> resistance from each side <strong>of</strong> <strong>the</strong>studied contact <strong>to</strong> <strong>the</strong> place in <strong>the</strong> 2DEG where <strong>the</strong> currentis extracted is sufficiently similar. This can be achieved bymaking <strong>the</strong> distance between <strong>the</strong> <strong>contacts</strong> larger than <strong>the</strong> size<strong>of</strong> <strong>the</strong> <strong>contacts</strong>. Thus, we now fabricated <strong>contacts</strong> in <strong>the</strong> middle<strong>of</strong> 2 mm × 3 mm cleaved wafer pieces (<strong>two</strong> rows <strong>of</strong> four<strong>contacts</strong>, with center-<strong>to</strong>-center distance between rows 1 mmand center-<strong>to</strong>-center distance between <strong>contacts</strong> within a row0.6 mm). Using four different <strong>contacts</strong> for a four-terminalmeasurement on <strong>the</strong> 2DEG (with <strong>the</strong> current biased from onerow <strong>to</strong> <strong>the</strong> o<strong>the</strong>r) gives on <strong>the</strong>se samples indeed low valuesaround 8 , in reasonable agreement with <strong>the</strong> value <strong>of</strong> <strong>the</strong>2DEG square resistance R □ <strong>of</strong> about 20 . Contact resistancevalues were again determined in a current-biased four-terminalconfiguration, with <strong>two</strong> terminals connected <strong>to</strong> <strong>the</strong> bond wireFigure 4. Contact resistance 〈R〉 as a function <strong>of</strong> (a) contact area Afor constant circumference 4L and (b) contact circumference C forconstant area A. The error bars here represent <strong>the</strong> standard deviationfrom measuring R on eight identical <strong>contacts</strong>. The dashed line in (a)is a fit using 〈R〉 ∝ 1/A.on <strong>the</strong> contact, <strong>the</strong> second current terminal on <strong>the</strong> oppositecontact in <strong>the</strong> o<strong>the</strong>r row and <strong>the</strong> second voltage terminal on aneighboring contact in <strong>the</strong> same row.<strong>On</strong> <strong>contacts</strong> that are not annealed, we can observe a tunnelcurrent, as expected for Schottky barriers. Here, <strong>the</strong> effectiveresistance is inversely proportional <strong>to</strong> area. For optimallyannealed <strong>contacts</strong>, we found that <strong>the</strong> contact resistance wasindependent on circumference, while only showing a weakdependence on area (weaker than inversely proportional <strong>to</strong>area), see figure 4. The fact that <strong>the</strong> dependence on shape heredoes not show a clear dependence as 〈R〉 ∝ 1/A agrees with <strong>the</strong>fact that <strong>the</strong> 〈R〉 values are comparable <strong>to</strong> <strong>the</strong> square resistance<strong>of</strong> <strong>the</strong> 2DEG, such that <strong>the</strong> latter gives a significant contribution<strong>to</strong> <strong>the</strong> <strong>to</strong>tal contact resistance. Fully understanding <strong>the</strong> contactresistance <strong>the</strong>n requires incorporating all square resistancecontributions from underneath and around <strong>the</strong> 2DEG. Sincewe found it impossible <strong>to</strong> estimate <strong>the</strong>se effects with a smallerror bar, we tried <strong>to</strong> demonstrate a clear dependence on areaby measuring slightly under annealed <strong>contacts</strong> instead.<strong>On</strong> <strong>two</strong> sets <strong>of</strong> under annealed <strong>contacts</strong> on wafer A,where we used shorter anneal times than t A,Opt (average contactresistance <strong>of</strong> 30 and 500 ), we found (within error bar) nodependence on area or circumference. We can only explainthis result if we assume that <strong>the</strong> 2DEG square resistanceunderneath <strong>the</strong> contact is significantly increased (<strong>to</strong> valuescomparable <strong>to</strong> <strong>the</strong> <strong>to</strong>tal observed contact resistance) for underannealed <strong>contacts</strong>. This probably results from <strong>the</strong> in-diffusingGe (and a<strong>to</strong>mic <strong>Au</strong> and <strong>Ni</strong> [15, 27]), which already introducesstrain and scatter centers in <strong>the</strong> 2DEG layer before optimalcontact conditions are reached. For optimal annealed <strong>contacts</strong>(here, with <strong>to</strong>tal resistance <strong>of</strong> typically 7 , independent <strong>of</strong>circumference), <strong>the</strong> square resistance underneath a contactmust have returned <strong>to</strong> a low value <strong>of</strong> order 10 . Apparently,<strong>the</strong> resistance increase due <strong>to</strong> strain and scatter centers iscompensated by increased Ge doping near <strong>the</strong> 2DEG layer.The summary <strong>of</strong> this study is that <strong>the</strong> resistance <strong>of</strong>annealed <strong>contacts</strong> never shows a clear dependence oncircumference, and only a weak dependence on area foroptimal <strong>contacts</strong>. We can, never<strong>the</strong>less, draw <strong>the</strong> followingconclusions. For an optimal <strong>ohmic</strong> contact, it is not <strong>the</strong> casethat electron transport between <strong>the</strong> surface metalization and<strong>the</strong> surrounding 2DEG mainly occurs at <strong>the</strong> edge <strong>of</strong> a contact.Instead, <strong>the</strong> full contact area plays a role, and in-plane electron7