CIPA HERITAGE DOCUMENTATION - CIPA - Icomos
CIPA HERITAGE DOCUMENTATION - CIPA - Icomos
CIPA HERITAGE DOCUMENTATION - CIPA - Icomos

You also want an ePaper? Increase the reach of your titles
YUMPU automatically turns print PDFs into web optimized ePapers that Google loves.
<strong>CIPA</strong> <strong>HERITAGE</strong> <strong>DOCUMENTATION</strong> · BEST PRACTICES AND APPLICATIONS · Series 1, 2007 & 2009<br />
The ICOMOS & ISPRS Committee for<br />
Documentation of Cultural Heritage<br />
The ISPRS International Archives of the<br />
Photogrammetry, Remote Sensing and Spatial Information Sciences<br />
Volume XXXVIII-5/C19 • ISSN 1682-1750<br />
<strong>CIPA</strong> <strong>HERITAGE</strong> <strong>DOCUMENTATION</strong><br />
BEST PRACTICES AND APPLICATIONS<br />
Series 1, 2007 & 2009<br />
Editors: Efstratios Stylianidis, Petros Patias, Mario Santana Quintero<br />
ICOMOS
The ICOMOS & ISPRS Committee for<br />
Documentation of Cultural Heritage<br />
<strong>CIPA</strong> <strong>HERITAGE</strong> <strong>DOCUMENTATION</strong><br />
BEST PRACTICES AND APPLICATIONS<br />
Series 1, 2007 & 2009<br />
XXI International Symposium – <strong>CIPA</strong> 2007, Athens<br />
XXII International Symposium – <strong>CIPA</strong> 2009, Kyoto<br />
Published by <strong>CIPA</strong><br />
Editors: Efstratios Stylianidis, Petros Patias, Mario Santana Quintero<br />
THE INTERNATIONAL ARCHIVES OF PHOTOGRAMMETRY, REMOTE SENSING AND SPATIAL INFORMATION SCIENCES<br />
INTERNATIONALES ARCHIV FÜR PHOTOGRAMMETRIE, FERNERKUNDUNG UND RAUMBEZOGENE INFORMATIONS WISSENSCHAFTEN<br />
ARCHIVES INTERNATIONAL DES SCIENCES DE LA PHOTOGRAMMÈTRIE, DE LA TÈLÈDÈTECTION ET DE L’ INFORMATION SPATIALE<br />
Volume XXXVIII-5/C19 • ISSN 1682-1750
Copies of this volume are available from:<br />
UNESCO – ICOMOS Documentation Centre<br />
49-51 rue de la Federation<br />
F - 75015 Paris (France)<br />
Tel: +33 (0) 1 45 67 67 70<br />
Fax: +33 (0) 1 45 66 06 02<br />
E-mail: centre-doc-icomos@unesco.org<br />
GITC bv<br />
P.O. Box 112<br />
NL – 8530 AC Lemmer (Netherlands)<br />
Tel: +31 514 561854<br />
Fax: +31 514 563898<br />
E-mail: mailbox@gitc.nl<br />
<strong>CIPA</strong> Treasurer<br />
Prof. José Luis Lerma García<br />
Universidad Politéchica De Valencia (UPV)<br />
Departamento de Ingeniería Cartográfica, Geodesia y Fotogrametría<br />
Camino de Vera s/n. Edificio 7i. 46022 Valencia, Spain<br />
Tel: +34 96387707<br />
Fax: +34 963877559<br />
E-mail: jllerma@cgf.upv.es<br />
ISSN: 1682-1777<br />
Printed in Greece by Ziti Publications<br />
Copyright © 2011 by <strong>CIPA</strong> – The ICOMOS/ISPRS Committee for Documentation of Cultural Heritage<br />
All rights reserved. Reproduction of this volume or any parts thereof, excluding short quotations for the use in<br />
preparation of reviews and technical and scientific papers, may be made only by specific approval of the editor.<br />
Copyright of each individual paper resides with the author(s). The editor is not responsible for any opinions or<br />
statements made in the technical papers, nor can be held responsible for any typing or conversion errors.
<strong>CIPA</strong>’s Sustaining Members<br />
VERMESSUNG<br />
ARCHEOTECH SA<br />
Chemin des Croisettes 23<br />
CH 1066 Epalinges, Switzerland<br />
www.archeotech.ch<br />
The Getty Conservation Institute<br />
1200 Getty Center Drive, Suite 700<br />
Los Angeles, CA 90049-1684, USA<br />
www.getty.edu/conservation/institute<br />
ART GRAPHIQUE et PATRIMOINE<br />
15, Avenue Jean Jaurès<br />
94340 Joinville-le-Pont, France<br />
www.artgp.fr<br />
English Heritage<br />
37 Tanner Row<br />
York, YO1 6WP, UK<br />
www.english-heritage.org.uk<br />
Josef LINSINGER ZT-Gmbh<br />
Hauptstr. 31<br />
A 5600 St. Johann / Pg, Austria<br />
www.linsinger.at<br />
ArcTron GmbH<br />
Ringstraße 8<br />
D-93177 Altenthann, Germany<br />
www.arctron.com<br />
TPLM3D<br />
132 avenue Franklin Roosevelt<br />
69500 BRON, France<br />
www.tplm-3d.fr<br />
Riegl Laser Measurement Systems GmbH<br />
Riedenburgstr. 48<br />
A-3580 Horn, Austria<br />
www.riegl.com<br />
Metria Digital, S.L.<br />
New Techniques for Heritage Documentation<br />
Parque Tecnologico de Asturias, CEEI Building<br />
33428 Llanera – Principality of Asturias, Spain<br />
www.metria.es
Preface<br />
The ICOMOS Scientific Committee, <strong>CIPA</strong> Heritage Documentation, is proud to present this first in a<br />
series of publications presenting state-of-the-art research and applications in the discipline of Cultural<br />
Heritage documentation.<br />
The intention of this publication is to record and archive the progress in documentation techniques<br />
and products during the two-year cycle of the <strong>CIPA</strong> symposia. In addition, the <strong>CIPA</strong>-HD Board would like<br />
to acknowledge the important contributions made during these symposia which, besides their theoretical<br />
and technical rigor, also provide examples of good practice or important applications in Cultural Heritage<br />
documentation.<br />
The publication starts with an introduction to heritage documentation by presenting the state-of-theart,<br />
the different approaches and the tools engaged in heritage documentation procedures.<br />
The first section includes papers presented in the 2007 <strong>CIPA</strong> Symposium in Athens, Greece. All papers<br />
have been selected by a special jury and awarded Best Paper awards in various categories at the<br />
Symposium. The six (6) selected papers concern Best Practices and Applications. All the papers present<br />
different aspects, applications, technical problems and novel approaches to CH documentation.<br />
The second section is dedicated to papers presented in the 2009 <strong>CIPA</strong> Symposium in Kyoto, Japan.<br />
As in the case of Athens, all papers have been selected by a special jury. The seven (7) selected papers<br />
concern Best Practices and Applications. All selected papers present different aspects, applications,<br />
technical problems and novel approaches to CH documentation, mainly in Asia.<br />
The publication concludes with a brief description on the future trends in heritage documentation.<br />
It is our belief that this publication will prove useful for those working in Cultural Heritage documentation<br />
and we wish again to congratulate the authors for their contribution.<br />
We would also like to acknowledge the contributions of the Sustaining Members of <strong>CIPA</strong>-HD, whose<br />
financial support has made this publication possible.<br />
C. Ogleby, <strong>CIPA</strong> President<br />
E. Stylianidis, P. Patias, M. Santana, Editorial committee<br />
5
Table of Contents<br />
1. Introduction to heritage documentation<br />
–––––––––––––––––––––––––––––––––––––––––––––––––––––––––––––––––––––––––––––––– 9<br />
P. Patias, M. Santana<br />
1.1 State-of-the-art –––––––––––––––––––––––––––––––––––––––––––––––––––––––––––––– 9<br />
1.2 Training approaches ––––––––––––––––––––––––––––––––––––––––––––––––––––––––– 10<br />
1.2.1 The training objectives and contents ––––––––––––––––––––––––––––––––––––– 10<br />
1.2.2 What is a baseline record of heritage places? –––––––––––––––––––––––––––––– 10<br />
1.2.3 Practical issues when recording heritage places –––––––––––––––––––––––––––– 11<br />
1.2.3.1 Defining scope: levels of detail –––––––––––––––––––––––––––––––––– 11<br />
1.2.3.2 The Reconnaissance Record –––––––––––––––––––––––––––––––––––– 11<br />
1.2.3.3 The Preliminary Record –––––––––––––––––––––––––––––––––––––––– 11<br />
1.2.3.4 The Detailed Record –––––––––––––––––––––––––––––––––––––––––– 11<br />
1.2.4 Tools: level of engaged with a heritage place –––––––––––––––––––––––––––––– 12<br />
1.2.5 Documentation dossier or site atlas –––––––––––––––––––––––––––––––––––––– 12<br />
References ––––––––––––––––––––––––––––––––––––––––––––––––––––––––––––––––––––– 13<br />
2. Best Practices and Applications (2007) –––––––––––––––––––––––––––––––––––––––– 15<br />
2.1 Introduction –––––––––––––––––––––––––––––––––––––––––––––––––––––––––––––––– 15<br />
Filling lacunas in terrestrial laser canning data:<br />
the “Cavallo ligneo” of the “Palazzo della Ragione” (Padua, Italy)<br />
–––––––––––––––––––––––––––––––––––––––––––––––––––––––––––––––––––––––––––––––– 17<br />
M. Fabris, V. Achilli, D. Bragagnolo, A. Menin, G. Salemi<br />
The multi-image spherical panoramasas a tool for architectural survey<br />
–––––––––––––––––––––––––––––––––––––––––––––––––––––––––––––––––––––––––––––––– 21<br />
Gabriele Fangi<br />
Architectural patrimony management in Yemen<br />
–––––––––––––––––––––––––––––––––––––––––––––––––––––––––––––––––––––––––––––––– 29<br />
R. Héno, Y. Egels<br />
3D modelling of heritage objectsby fringe projection and laser scanning systems<br />
–––––––––––––––––––––––––––––––––––––––––––––––––––––––––––––––––––––––––––––––– 35<br />
H.-J. Przybilla, J. Peipe<br />
Evaluation of structural damages from 3d laser scans<br />
–––––––––––––––––––––––––––––––––––––––––––––––––––––––––––––––––––––––––––––––– 41<br />
J.I. San José, J. Martínez, J.J. Fernández, J. Finat, J.D. Perez-Moneo<br />
Simple Tools for Architectural Photogrammetry<br />
–––––––––––––––––––––––––––––––––––––––––––––––––––––––––––––––––––––––––––––––– 49<br />
V. Tsioukas<br />
7
3. Best Practices and Applications (2009) –––––––––––––––––––––––––––––––––––––––– 53<br />
3.1 Introduction –––––––––––––––––––––––––––––––––––––––––––––––––––––––––––––––– 53<br />
Application of a low cost laser scannerfor archaelogy in Japan<br />
–––––––––––––––––––––––––––––––––––––––––––––––––––––––––––––––––––––––––––––––– 55<br />
Akihiro Kaneda<br />
A study on the gps tracking analysis for information management on heritage site<br />
–––––––––––––––––––––––––––––––––––––––––––––––––––––––––––––––––––––––––––––––– 59<br />
S. Kim, J. Kim<br />
Multispectral image analysis for bas-relif at the inner gallery of bayon temple<br />
–––––––––––––––––––––––––––––––––––––––––––––––––––––––––––––––––––––––––––––––– 65<br />
T. Morimoto, M. Chiba, Y. Katayama, K. Ikeuchi<br />
Introducing EDM survey for recording vernacular heritage and sites in Pakistan<br />
–––––––––––––––––––––––––––––––––––––––––––––––––––––––––––––––––––––––––––––––– 73<br />
Salman Muhammad<br />
3D model of gedongsongo templeand topography using terrestrial laser<br />
scanner technology<br />
–––––––––––––––––––––––––––––––––––––––––––––––––––––––––––––––––––––––––––––––– 79<br />
Adi J. Mustafa, Fahmi Amhar<br />
Digital Construction for Spatial Documentation of Beijing Old City<br />
–––––––––––––––––––––––––––––––––––––––––––––––––––––––––––––––––––––––––––––––– 85<br />
Ruoming Shi, Guang Zhu, Ling Zhu, Ruiying Wang, Yuqing Mu<br />
Laser scan documentation and virtual reconstruction of the Buddha figures<br />
and the archaeological remains (Bamiyan)<br />
–––––––––––––––––––––––––––––––––––––––––––––––––––––––––––––––––––––––––––––––– 93<br />
G. Toubekis, I. Mayer, M. Döring-Williams, K. Maeda, K. Yamauchi,<br />
Y. Taniguchi, S. Morimoto, M. Petzet, M. Jarke, M. Jansen<br />
4. Future trends in heritage documentation<br />
–––––––––––––––––––––––––––––––––––––––––––––––––––––––––––––––––––––––––––––––– 101<br />
P. Patias<br />
8 <strong>CIPA</strong> <strong>HERITAGE</strong> <strong>DOCUMENTATION</strong> BEST PRACTICES AND APPLICATIONS Series I, 2007 & 2009
1<br />
1.1 State-of-the-Art<br />
Introduction<br />
to Heritage Documentation<br />
P. Patias 1 , M. Santana 2<br />
1. Aristotle University of Thessaloniki, Department of Cadastre, Photogrammetry and Cartography,<br />
Univ. Box 473, GR-54124 Thessaloniki, patias@auth.gr<br />
2. Department of Architecture, Urban and Regional Planning - R.Lemaire International Center<br />
for Conservation - University of Leuven (KU Leuven), president@cipa.icomos.org<br />
Cultural documentation is a complicated process, and includes<br />
a wide suite of activities that include surveying, testing<br />
and monitoring and gathering textual and other information.<br />
“The geometry of the object is not the only parameter to be recorded.<br />
All specificities making the object unique are meaningful;<br />
all potential values – architectural, artistic, historical,<br />
scientific and social – are parameters to consider”, (D’Ayala<br />
and Smars, 2003).<br />
The guiding concepts of cultural heritage documentation<br />
have been detailed by D’Ayala and Smars (2003) (Patias,<br />
2007) as:<br />
➧ Objectivity: “… an objective basis is a guarantee to having<br />
a firm ground on which to debate the conservation choices…”<br />
and “…the use of any specific set of data necessarily<br />
influences any decision-making process. The manner in<br />
which a survey is executed significantly influences further<br />
actions”.<br />
➧ Values: “The recorder’s choices are critical…… What is<br />
seen today as uninteresting may appear tomorrow as extremely<br />
valuable. The importance of thorough recording is<br />
emphasised by the common loss of minor details which<br />
may disappear at the moment of new conservation work,<br />
leading to loss of integrity or of historical evidence.”<br />
➧ Learning process.<br />
➧ Continuity: “… Documentation should not be seen as an<br />
activity confined within a set time…. Therefore, a basic requirement<br />
is that the results of documentation should be<br />
available for future use.”<br />
➧ Fabric: “Documentation should not stop at the surface....<br />
Integration with other documentation techniques is necessary.”<br />
➧ Documentation sets: “Information gathered during documentation<br />
may be large and manifold…. thus it is critical to<br />
organise the available information, for which the metric<br />
survey is a natural support. Sets of thematic drawings (geometry,<br />
materials, pathologies etc.) can be prepared. A<br />
specific set prepared by one specialist can bring insight to<br />
other specialists who are working on other sets.”<br />
➧ Redundancy: “… Every piece of information is associated<br />
with uncertainty. Documentation data should be supplemented<br />
by information about the quality of the data. Control<br />
procedures offer a way to assess quality.”<br />
These concepts lead to increasing needs for recording and<br />
documentation of CH, which put briefly are:<br />
➧ recording of a vast amount of four dimensional (i.e. 3-D<br />
plus time) multisource, multi-format and multi-content information,<br />
with stated levels of accuracy and detail;<br />
➧ digital inventories in 3-D and, as far as available, dated historical<br />
images;<br />
➧ management of the 4-D information in a secure and rational<br />
way, making it available for sharing and distribution to<br />
other users; and<br />
➧ visualization and presentation of the information in a userfriendly<br />
way, so that different kinds of users can actually retrieve<br />
the data and acquire useful information, using Internet<br />
and visualization techniques.<br />
<strong>CIPA</strong>’s main objective is to provide an international focal<br />
point for efforts in the improvement of all methods for surveying<br />
of cultural monuments and sites. The combination of all<br />
aspects of photogrammetry with other surveying methods is<br />
regarded as an important contribution to recording and monitoring<br />
cultural heritage, to the preservation and restoration of<br />
any valuable architectural or other cultural monument, object<br />
or site, and to provide support to architectural, archaeological<br />
and other art-historical research.<br />
1. IntroductIon to HerItage documentatIon<br />
9
In contrast to most conventional photogrammetric applications,<br />
cultural heritage documentation is much more challenging,<br />
due specifically to the varying size of the objects to be<br />
documented as well as the different quality and resolution requirements.<br />
Choosing the appropriate technology (sensor,<br />
hardware, software), the appropriate procedures, designing<br />
the production workflow and assuring that the final output is<br />
in accordance with the set technical specifications is a challenging<br />
matter in cultural heritage documentation (Patias,<br />
2004, Patias 2007). For this, the leading parameters are the<br />
size and the complexity of the object and the level of accuracy<br />
required. These two are the major factors, which crucially<br />
influence the procedure to be followed and, sometimes, even<br />
the viability of photogrammetry itself. Other secondary factors,<br />
which may have an impact (and are sometimes crucial)<br />
are speed/time limitations for the documentation and budget<br />
limitations. The reason that these factors are secondary in nature<br />
is that they do not influence the viability of photogrammetry<br />
as the techniques to be followed (since photogrammetry already<br />
has a distinct advantage over other techniques concerning<br />
the above factors) but they may influence the technicalities<br />
of the procedure which should be followed.<br />
These strict and of varying type requirements gave rise to<br />
a palette of techniques and instrumentation for CH applications.<br />
Nowadays image acquisition systems are almost exclusively<br />
based on digital sensors. Even non-standard imaging<br />
principles such as panoramic cameras, fisheye systems, rotating<br />
cameras and other vision techniques are used. Beside this,<br />
archives with thousands of analogue images demand the need<br />
of precise digitization of film, photo prints or even glass plates<br />
for further digital photogrammetric workflow (Patias, et. al.,<br />
2008).<br />
In addition to digital image based sensors (satellite, aerial<br />
and close range), different kinds of range based sensors like<br />
3-D scanners (airborne, mid and close range), IR-sensors,<br />
thermal systems, geophysical sensors and many more are<br />
used to collect a whole spectrum of information on cultural<br />
heritage objects and sites.<br />
1.2 Training Approaches<br />
Heritage places are a unique and irreplaceable source of information.<br />
The process of acquiring heritage information serves<br />
for the identification of heritage places with significance at the<br />
local, national and/or international community.<br />
The documentation of cultural heritage requires a multidisciplinary<br />
approach, ensuring that recording and documentation<br />
tools. As well as, the preparation of information systems<br />
provides appropriate and timely information enabling to understand<br />
the significance and to detect and monitor the integrity<br />
of heritage places.<br />
1.2.1 The training objectives and contents<br />
Information collected by recording and documentation for<br />
conservation projects play an essential role in safeguarding<br />
our cultural heritage, it permits:<br />
➧ Understanding of significant and integrity of heritage<br />
places;<br />
➧ Transmission of this understanding thus increasing public<br />
awareness;<br />
➧ Informing decisions for conservation;<br />
➧ Creating records for posterity in case of destruction;<br />
➧ Providing timely and sufficient information for preventive<br />
maintenance<br />
The teaching strategy should involve an innovative role-playing<br />
technique, which empowers students and instructors to:<br />
➧ Develop an understanding of the role of information in conservation,<br />
addressing national and international standards;<br />
➧ Review the potential limitations of recording and documentation<br />
techniques, including simple and advanced tools,<br />
and the financial constraints.<br />
➧ Develop a practical approach to the use of these tools and<br />
documentation techniques in order to capture information<br />
from cultural heritage resources;<br />
➧ Include the use of information systems in cultural heritage<br />
resources management;<br />
➧ Design reports for presenting information to stakeholders<br />
and decision makers.<br />
A training programme should consider explaining:<br />
➧ Key definitions in cultural heritage documentation;<br />
➧ Type of cultural heritage documentation assessments;<br />
➧ Definition of a the heritage place baseline documentation;<br />
➧ Definition of scope and level of detail;<br />
➧ Cultural heritage Conservation workflow;<br />
➧ Selection of recording tools;<br />
➧ Explanation of heritage recording tools;<br />
➧ Preparation of a ‘documentation dossier or site atlas’ of the<br />
heritage place using recording tools.<br />
1.2.2 What is a baseline record of heritage places?<br />
A training approach should identify and define the parameters<br />
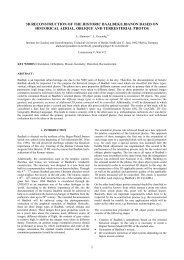
relevant in particular heritage assessment. The chart in Figure<br />
1 depicts the components of a baseline record.<br />
This baseline, additionally, could be use as starting<br />
point for designing and implementing plan monitoring strategy,<br />
allowing detecting changes affecting the statement of<br />
significance of the heritage place. A baseline is defined by<br />
both a site report and a dossier of measured representations<br />
that could include a site plan, emplacement plan,<br />
plans of features, sections, elevations, three-dimensional<br />
models, etc.<br />
The following checklist can be used as guideline to adequate<br />
requirements of information required defining the baseline<br />
and training purposes:<br />
➧ Identify site location (centroid, boundaries, elements and<br />
buffer zone);<br />
10 <strong>CIPA</strong> <strong>HERITAGE</strong> <strong>DOCUMENTATION</strong> BEST PRACTICES AND APPLICATIONS Series I, 2007 & 2009
➧ Identify and map evidences of criteria;<br />
➧ Significance and integrity assessment;<br />
➧ Risk assessment: threats and hazards associated to indicators;<br />
➧ Administrative and management issues (current and<br />
passed mitigations);<br />
➧ Other assessments.<br />
1.2.3 Practical issues when recording heritage<br />
places<br />
Figure 1: Defining a baseline, author.<br />
A good understanding of the recording heritage places requires<br />
the development of skills that recognize the following<br />
issues:<br />
➧ Nothing is straight, square or horizontal, heritage places<br />
are affected by weathering and their design might not be<br />
regular;<br />
➧ One should record from the wide to the small (fault theory);<br />
➧ Records should be referenced, it is advisable to link and establish<br />
a Basis and Control system;<br />
➧ The site baseline means that the heritage recording is to<br />
collect information of ‘as-built condition’, one should record<br />
only what is visible, although assumptions deduced from<br />
“logical” way of fabric should be mentioned;<br />
➧ Define an appropriate level of detail of the information to<br />
be provided;<br />
➧ All records should provide provenance information.<br />
1.2.3.1 Defining scope: levels of detail<br />
The following levels, developed by Letellier0 are presented<br />
here to provide an essential guide to define the amount of heritage<br />
information required for a specific objective in understanding<br />
heritage places. Each training course to be developed<br />
should specify, which of these levels are been taught.<br />
The levels are:<br />
➧ Reconnaissance;<br />
➧ Preliminary;<br />
➧ Detailed.<br />
1.2.3.2 The Reconnaissance Record<br />
Usually, the reconnaissance record is an overview photo survey<br />
that will allow conservationists to visualize, in their entirety, a<br />
site and its related buildings and features in sufficient detail to<br />
understand the site’s overall general characteristics. It should<br />
permit rapid identification of significant features and problem<br />
areas. The quantity of photos taken will vary with the size of the<br />
site and related structures and features, and the client’s requirements.<br />
For a building, a reconnaissance record would normally<br />
include elevations together with significant details. More<br />
complex sites such as cultural landscapes or archaeological excavations<br />
will require general views from all compass points<br />
and at various height elevations (that is heights of land), supplemented,<br />
as needs dictate, by representative details.<br />
1.2.3.3 The Preliminary Record<br />
Preliminary recording will complement the reconnaissance<br />
record by providing more complete information pertaining to<br />
the most significant elements of a site. The purpose of this<br />
record is to produce a record of the resource’s major features.<br />
Additionally, the preliminary record could include data necessary<br />
for preliminary analysis, and define areas for further investigation<br />
and future ‘detailed recording’. The accuracy of data is<br />
approximately ± 10 cm for plans, elevations, and cross sections,<br />
and ± 2 cm for structural and other structural details.<br />
1.2.3.4 The Detailed Record<br />
Detailed recording may take place prior to, during or after a<br />
conservation activity so as to record a site’s physical configuration,<br />
condition and significant features. Detailed recording<br />
occurs when a highly significant resource becomes the subject<br />
of directed research and analysis, or intervention planning<br />
and conceptual design. To ensure cost-effective detailed recording,<br />
completeness should be tailored to the immediate<br />
needs of a conservation team. Detailed recording may be<br />
phased over a number of years depending on planning requirements<br />
and related budget. The accuracy of a detailed record<br />
can vary between approximately ±5 mm (for details) and ±25<br />
mm (for building plans).<br />
1. IntroductIon to HerItage documentatIon<br />
11
Figure 2: Heritage information’s levels of detail for conservation (based on research by R. Letellier).<br />
1.2.4 Tools: level of engaged with a heritage place<br />
The use of tools for recording heritage places can be also<br />
classified according to the selection, time, skills and level of<br />
engagement required with the fabric to capture data from<br />
the site being studied.<br />
Selection: deals with the type of geometry captured by the<br />
sensor, for instance using hand-survey we are capturing<br />
points, distances, profiles, etc, with laser scanning we are<br />
capturing three-dimensional shapes, points, and to some extend<br />
the colour of the fabric. Defining the type of information<br />
to be selected is of primarily importance when recording heritage<br />
places.<br />
Time: relates to the time it takes to record features from<br />
the heritage place’s fabric, for instance when using hand-survey<br />
the time required onsite will be considerably more than the<br />
at the office, while using photogrammetry, the onsite time is<br />
limited to taking photographs and defining a control system<br />
and the office time is larger to restitute the geometry and colour<br />
of the fabric.<br />
Level of engagement: this relates to the time of control<br />
system necessary to be defined and the knowledge required<br />
of the site prior to record the heritage place. For instance with<br />
a GPS unit, the operator requires to select the points to define<br />
the boundaries of the site, while when using laser scanning,<br />
the 3D-shape of the object is fully recorded, although it is important<br />
to point out that knowledge of the site is always required,<br />
see reconnaissance as the first level of detail required<br />
when studying heritage places.<br />
Skills: it relates to the expertise required to operate a capturing<br />
tool to record the fabric of heritage places. For instance<br />
to record the centroid of a site using GPS and transfer that to<br />
a database, is a simple task that does not required much training,<br />
while if using a GPS equipped with a mobile GIS application<br />
might required much more training but certainly the resulting<br />
survey will be more complete.<br />
In addition, to the requirements defined to prepare a site<br />
baseline, these parameters should be fully studied when considering<br />
recording heritage places.<br />
1.2.5 Documentation dossier or site atlas<br />
The training approach should encourage to work around several<br />
case studies, in which the participants will prepare dossier<br />
that should contain an initial understanding of the building’s<br />
current condition, history and baseline measured maps,<br />
several examples of theses dossiers exist already:<br />
12 <strong>CIPA</strong> <strong>HERITAGE</strong> <strong>DOCUMENTATION</strong> BEST PRACTICES AND APPLICATIONS Series I, 2007 & 2009
English Heritage ‘Understanding Historic Buildings: A guide to good recording practice’ (2006):<br />
Part 1:<br />
http://www.english-heritage.org.uk/upload/pdf/Understanding_Historic_Buildings_1.pdf<br />
Part 2:<br />
http://www.english-heritage.org.uk/upload/pdf/Understanding_Historic_Buildings_2.pdf<br />
Part 3:<br />
http://www.english-heritage.org.uk/upload/pdf/Understanding_Historic_Buildings_3.pdf<br />
Guidelines for Local Surveys: A Basis for Preservation Planning bulletin (28 MB)<br />
http://www.cr.nps.gov/nr/publications/bulletins/nrb24/nrb24.pdf (last visited 2/2/2007)<br />
The Secretary of the Interior’s Standards and Guidelines for Archaeology and Historic Preservation<br />
http://www.nps.gov/history/local-law/arch_stnds_0.htm<br />
The Secretary of the Interior’s Standards and Guidelines for Preservation Planning<br />
http://www.cr.nps.gov/hps/pad/PlngStds/guideintro.htm (last visited: 2/2/07)<br />
The Secretary of the Interior’s Standards for Architectural and Engineering Documentation<br />
http://www.nps.gov/history/local-law/arch_stnds_6.htm<br />
NPS-28: Cultural Resource Management Guideline<br />
Chapter 8: Management of Historic and Prehistoric Structures<br />
This chapter specifies contents of Historic Structure Reports<br />
http://www.nps.gov/history/history/online_books/nps28/28chap8.htm<br />
HABS/HAER Documentation Programs:<br />
http://www.nps.gov/history/hdp/standards/habsguidelines.htm<br />
Sample Projects:<br />
http://www.nps.gov/hdp/samples/index.htm<br />
References<br />
D’Ayala, D. and Smars, P. 2003. Minimum requirement for metric<br />
use of non-metric photographic documentation, University of<br />
Bath Report. See http://www.english-heritage.org.uk/server/<br />
show/conWebDoc.4274.<br />
Demas, M. ‘Site unseen’: the case for reburial of archaeological<br />
sites’, Conservation and Management of Archaeological Sites<br />
(2004), Vol. 6, pages 137-154.<br />
Eppich, E. Chabbi, A. ed. Illustrated Examples Recording, Documentation,<br />
and Information Management for the Conservation<br />
of Heritage Places, The Getty Conservation Institute, 2007 J.<br />
Paul Getty Trust.<br />
ICOMOS ‘Principles for the Recording of Monuments, Groups of<br />
Buildings and Sites’ http://www.international.icomos.org/recording.htm<br />
(accessed: 15/11/2008).<br />
ICOMOS ‘Venice Charter’, http://www.icomos.org/venice_charter.<br />
html (accessed: 15/11/2008).<br />
Letellier, R. Schmid, W. LeBlanc, F. Guiding Principles Recording,<br />
Documentation, and Information Management for the Conservation<br />
of Heritage Places, Getty Conservation Institute, 2007<br />
J. Paul Getty Trust.<br />
Parks Canada Periodic Report on the Application of the World Heritage<br />
Convention http://www.pc.gc.ca/docs/pm-wh/rspm-whsr/<br />
sec3/sec3c_e.asp (Last reviewed 19/06/2008).<br />
Patias, P. 2004, Overview of applications of close-range Photogrammetry<br />
and Vision techniques in Architecture and Archaeology,<br />
C. McGlone (ed), Manual of Photogrammetry, 5th edition, ISBN<br />
1-57083-071-1, American Society of Photogrammetry Publ.,<br />
Maryland, USA, chapter 14.5, pp 1044-1050.<br />
Patias, P. 2007, “Cultural Heritage Documentation”, Chapter 9 in<br />
“Applications of 3D measurement from images”, J. Fryer, H.<br />
Mitchell, J. Chandler, editors, pp. 225-250, Whittle Publishing<br />
Co., ISBN 10: 1-870325-69-9, ISBN 13: 978-1-870325-69-<br />
1.<br />
Patias, P., P. Grussenmeyer, K. Hanke, 2008, “Applications in cultural<br />
heritage documentation”, in ISPRS Book series, Vol. 7,<br />
“Advances in Photogrammetry, Remote Sensing and Spatial Information<br />
Sciences; 2008 ISPRS Congress Book”, Zhilin Li;<br />
Jun Chen; Emmanuel Baltsavias (Edts), Chapter 27, pp. 363-<br />
384, CRC Press, Taylor & Francis Group, ISBN: 978-0-415-<br />
47805-2 (hbk), ISBN: 978-0-203-88844-5 (ebook).<br />
RecorDIM initiative, http://www.getty.edu/conservation/field_<br />
projects/recordim/index.html, http://www.getty.edu/conservation/publications/pdf_publications/recordim.html<br />
and http://<br />
cipa.icomos.org/index.php?id=395 (accessed: 15/11/2008).<br />
Santana Quintero, M., The Use of Three-dimensional Documentation<br />
and Dissemination Techniques in Studying Built Heritage,<br />
R. Lemaire International Centre for Conservation (KU Leuven),<br />
Leuven, 2003.<br />
UNESCO’s World Heritage Convention, http://whc.unesco.org/en/<br />
conventiontext/ (accessed: 15/11/2008).<br />
1. IntroductIon to HerItage documentatIon<br />
13
2<br />
Best Practices and Applications<br />
(2007)<br />
2.1 Introduction<br />
The following six papers are presented as “Best Practises and Applications” in the next pages.<br />
The selection is based on the papers presented to the <strong>CIPA</strong> Symposium in Athens (2007).<br />
1. Filling lacunas in terrestrial laser canning data:<br />
the “Cavallo ligneo” of the “Palazzo della Ragione” (Padua, Italy)<br />
(M. Fabris, V. Achilli, D. Bragagnolo, A. Menin, G. Salemi)<br />
2. The multi-image spherical panoramasas a tool for architectural survey<br />
(Gabriele Fangi)<br />
3. Architectural patrimony management in Yemen<br />
(R. Héno, Y. Egels)<br />
4. 3D modelling of heritage objectsby fringe projectionand laser scanning systems<br />
(H.-J. Przybilla, J. Peipe)<br />
5. Evaluation of structural damages from 3d laser scans<br />
(J.I. San José, J. Martínez, J.J. Fernández, J. Finat, J.D. Perez-Moneo)<br />
6. Simple Tools for Architectural Photogrammetry<br />
(V. Tsioukas)<br />
15
ABSTRACT<br />
Laser scanning methodology allows to reconstruct the metric<br />
characteristics of objects at different LOD (Level Of Detail) providing<br />
spatially dense points clouds. In particular, the terrestrial<br />
applications carried out in the last years have demonstrated the<br />
potentialities of the methodology useful in many different sectors.<br />
This technique has been used also for the “Cavallo ligneo”<br />
of the “Palazzo della Ragione” (Padua, Italy) survey, providing<br />
useful data for the restoration of the wooden horse. Due to the<br />
morphologic complexity of the object, some lacunas were created<br />
during the points clouds acquisition phase: different procedures<br />
to filling lacunas were stressed out providing a complete<br />
3D model of the wooden statue.<br />
Introduction<br />
Filling lacunas in terrestrial laser<br />
canning data: the “Cavallo ligneo” of the<br />
“Palazzo della Ragione” (Padua, Italy)<br />
M. Fabris, V. Achilli, D. Bragagnolo, A. Menin, G. Salemi<br />
Università degli Studi di Padova, Dipartimento di Architettura, Urbanistica e Rilevamento,<br />
Laboratorio di Rilevamento e Geomatica, via Marzolo, 9, 35131 Padova, Italy, massimo.fabris@unipd.it<br />
Terrestrial laser scanner devices represent one of the most<br />
widely investigated instruments in many fields of architectural<br />
and archaeological surveying applications. In order to allow<br />
photo-realistic navigation and presentation of cultural heritage<br />
objects, 3D models with good geometric accuracy, large<br />
amount of details, different LOD (Level Of Detail) and high<br />
resolution textures are required (Boehler et al., 2001; Boehler<br />
et al., 2003; Schulz, Ingensand, 2004; Staiger, 2005). Since<br />
several years, laser scanning techniques are used for different<br />
purposes also in the framework of cultural heritage (Bitelli,<br />
2002; Lichti, Gordon, 2004). Terrestrial laser data acquisition<br />
allows to collect a very huge amount of measurements with an<br />
accuracy in the range of centimetres or even millimetres,<br />
which produces dense, accurate and detailed models. On the<br />
other hand, for specific geometric conditions of survey or for<br />
the objects interposition during the acquisition, the point<br />
clouds could be not homogeneous and could have sub-areas<br />
with absence of data (holes or lacunas). In these cases, some<br />
interpolation algorithms can be applied to reconstruct the nodata<br />
areas and to define a more uniform support grid.<br />
In this paper, the surveying operations related to data collection<br />
and data analysis of the “Cavallo ligneo” of “Palazzo<br />
della Ragione” in Padua (Italy) are described and discussed in<br />
order to generate a 3D complete model of the wooden horse<br />
for its restoration.<br />
The Wooden Horse Surveying<br />
Documents which have been preserved to the present day tell<br />
us that it was built in 1466 for a roundabout, commissioned<br />
by Conte Annibale Capodilista. It was erroneously attributed to<br />
Donatello, as the inscription on the base shows, but was in<br />
fact the work of an unknown artist. The construction is hollow<br />
inside and built like the hull of a ship, resting on the four sturdy<br />
legs which were made using a technique similar to today’s<br />
segmented beams; i.e. the wooden boards are glued together<br />
on the long side to exploit the tractive force of the wood in full<br />
and minimise the warping typical of solid wood as much as<br />
possible (Fischer, 2004). The wooden horse is characterized<br />
by relevant dimension: 5.75 m height and 6.20 m circumference<br />
of the body (Figure 1).<br />
The object has been planned in order to go inside and to<br />
park in quite comfortably: a trap-door allows the access inside<br />
to the body of the horse, while from the mouth air and<br />
light enter.<br />
The hinge of equilibrium for this complex structure seems<br />
to be the cast iron sphere with a radius of about 27 cm and<br />
weight of about 615 kg. This sphere is the principal point of<br />
anchorage of the horse to the wood basement (along about<br />
6.42 m). In 2004 the structure seemed very degrated and a<br />
complete survey was necessary to plan and to perform restoration<br />
operations for the wood statue.<br />
FIllIng lacunas In terrestrIal laser cannIng data: tHe “cavallo lIgneo” oF tHe “Palazzo della ragIone” (Padua, Italy)<br />
17
Figure 1: The “Cavallo ligneo” of the “Palazzo della Ragione” (Padua, Italy).<br />
The surveys were performed by means of a Leica HDS (ex<br />
Cyrax) 2500 laser scanner which provides an accuracy of 6<br />
mm (single point) for distance ranging from 1.5 to 50 m. The<br />
single scans were acquired from eight different stationing<br />
points (located in the four corners and in the medium points<br />
of the four sides) with a mean grid size of 1 cm. Also specific<br />
reflective targets (useful for the semi-automatic identification)<br />
were acquired and used as control points; the coordinates<br />
were measured in a local reference frame by a total station<br />
Leica TC2003. The targets (5 for each scan) were positioned<br />
outside the wooden horse surface but inside the window acquisition<br />
of the laser scanner to survey the whole object without<br />
artificial element which covers some portions.<br />
Data Processing<br />
The allignment of the point clouds were performed using the<br />
Cyclone v. 5.4 software (Leica Geosystems) to generate the<br />
3D global model. The software allows to co-register different<br />
scans using three different procedures: cloud registration, target<br />
registration and survey registration. The first one needs a<br />
large overlapping percentage between two adjacent different<br />
scans in order to roto-traslate the point clouds in the same reference<br />
frame. The second one uses the targets as reference<br />
points in order to execute the allignment and, again, a large<br />
overlapping percentage between scans must be taken in account.<br />
In this case lower computational time is necessary and<br />
more accuracy is obtained; furthermore, more time is needed<br />
in the surveying in order to acquire also high resolution scans<br />
of the targets. The last one procedure needs integration between<br />
laser data and topographic measurements: each target<br />
must be acquired with a total station in order to obtain the coordinates<br />
in the same reference system.<br />
So, no relevant overlapping percentage between adjacent<br />
scans is needed; nevertheless, minimum overlapping is required<br />
in order to guarantee the model continuity. In this approach,<br />
the measurement time is increased, but also the final<br />
accuracy is scaled up. This survey registration method has<br />
been used to align the “Cavallo ligneo” point clouds: each<br />
scan was roto-traslated in a local reference frame imposing<br />
the targets coordinates as control points. The final 3D model<br />
has been processed using RapidForm2004 software (INUS<br />
Technology): the data redudancy between subsequent scans<br />
has been reduced, performing data fusion and extracting a polygonal<br />
mesh without discontinuities. Therefore, the data was<br />
reduced of the 64% without information loss. The Figure 2<br />
shows three different meshes obtained by point reduction of<br />
60%, 40% and 10%.<br />
Filling Holes<br />
Due to the limited available space around the object, some<br />
portions of the wooden horse statue were not acquired. Some<br />
of these areas with data gaps have no relevant dimensions,<br />
while others (like the back and the top of the horse) need affordable<br />
algorithms to close the lacunas. The reconstruction of<br />
these areas is performed using different schemes based on<br />
different interpolation algorithms.<br />
Using the Inverse Distance to a Power, Kriging, Radial Basis<br />
Function, Local Polynomial (linear), Natural Neighbor, Nearest<br />
Neighbor, Polynomial Regression (cubic surface) and Triangulation-linear<br />
interpolation algorithms, several tests were conducted<br />
on the scans of the lateral portion of the wooden horse.<br />
However, the application of this method for reconstructing the<br />
back and the top of the horse provides not so good results<br />
(Fabris et al., 2005).<br />
Further analysis was conducted with the RapidForm2004<br />
software; the lacunas filling can be performed with automat-<br />
Figure 2: Three different meshes of the “Cavallo ligneo” head obtained reducing the point clouds: (a) 60%; (b) 40%; (c) 10%.<br />
18 <strong>CIPA</strong> <strong>HERITAGE</strong> <strong>DOCUMENTATION</strong> BEST PRACTICES AND APPLICATIONS Series I, 2007 & 2009
Figure 3: Results from automatic closing of large lacunas using the Rapid-<br />
Form2004 software.<br />
ic, manual or combined procedures. The filling of simple and<br />
small dimensions holes were conducted automatically, while<br />
for the complex and large lacunas the procedure was performed<br />
with the semi-automatic modality. The automatic procedure,<br />
applied in correspondence of the back of the wooden<br />
horse, carried out unsatisfactory results (Figure 3): the obtained<br />
surface is characterized by non adequate continuity<br />
with the adjacent surfaces and some topological anomalies<br />
are evident.<br />
The semi-automatic procedure allows to close the large<br />
lacunas (Figure 4a) respecting the topology of the adiacent<br />
surfaces. At first, a carrying skeleton has been created (Figure<br />
4b), taking in account the curved closing of the lacuna<br />
and, subsequently, the holes with small dimensions have<br />
been closed automatically (Figure 5).<br />
Mesh and Nurbs Surfaces Generation<br />
The lacunas filling have provided a global 3D model; the polygonal<br />
mesh has been simplified reducing the faces number<br />
and preserving the surface shape. In fact, the flat areas not<br />
need a large amount of data and allow to construct a lighter<br />
model with low computational effort.<br />
Adopting a 10% mesh-reduction, an increased smoothing<br />
is observed; moreover, the comparison between the decimated<br />
mesh and the original mesh provides residuals lower of the<br />
instrumental precision. This mesh has been used to extract<br />
nurbs surfaces. The operation is needed because the mesh<br />
modification is a slow and laborious procedure which involves<br />
also thousands of triangular faces. Using nurbs surfaces, the<br />
procedure is easier dealing with single elements covering the<br />
object.<br />
The nurbs surfaces extraction has been performed using<br />
an automatic procedure from the polygonal mesh; subsequently,<br />
the number and the control points’ distribution have<br />
been adjusted (Figure 6).<br />
Cross Sections and Profiles Extraction<br />
The polygonal mesh has been used to extract cross sections by<br />
means of the intersection between the 3D model with horizontal<br />
or vertical planes in the local reference system adopted (Figure<br />
7). Moreover, the same approach allows to generate profiles, pro-<br />
Figure 4: The big lacuna<br />
(a) on the back<br />
of the wooden horse<br />
was artificially subdivided<br />
in smaller lacunas<br />
(b) using a transversal<br />
skeleton structure.<br />
Figure 5: a) Construction<br />
of the longitudinal<br />
carrying skeleton;<br />
b) automatic reconstruction<br />
of the<br />
new lacunas (small<br />
dimension).<br />
FIllIng lacunas In terrestrIal laser cannIng data: tHe “cavallo lIgneo” oF tHe “Palazzo della ragIone” (Padua, Italy)<br />
19
Figure 6: Control points management for Nurbs surfaces.<br />
jecting the contours of the wooden horse respect to a reference<br />
plane. The cross sections and profiles allow to reconstruct the<br />
metric and the features of the wooden horse in AutoCAD software<br />
(Autodesk) for the restoration plan of this structure.<br />
Conclusions<br />
The application of the laser scanning methodology and its integration<br />
with the classical topographic procedures has allowed to<br />
generate a 3D model of the “Cavallo ligneo” of the “Palazzo della<br />
Ragione” in Padua; the wooden horse, built in 1466, characterized<br />
by relevant dimensions and morphological complexity,<br />
has a very degraded wood and restoration work has been<br />
planned. The laser scanner HDS 2500 have been used and the<br />
specific reflective targets were acquired in a local reference system<br />
and used as control points. Due to the limited available<br />
space around the object, some lacunas (no data areas) were located;<br />
the allignment has been obtained using the Cyclone software<br />
and the performances of some interpolation algorithms<br />
have been evaluated. Some of these methods have allowed to<br />
filling lacunas with precision comparable with the laser scanner<br />
accuracy (the improvement was obtained considering some<br />
points of the surveyed data inside the lacuna). However, the application<br />
of the kriging algorithm to reconstruct the back and<br />
the top of the horse in this case has not provided good results.<br />
These methods can be used with small lacunas, taking advantage<br />
by the automatic procedures. Using the RapidForm2004<br />
software the lacuna on the back of the wooden horse was filled<br />
by means of a semi-automatic procedure: at first, has been create<br />
by the operator an carrying skeleton in respect to the curving<br />
and subsequently the holes have been filled automatically.<br />
On the final 3D model a decimated polygonal mesh has been<br />
generated preserving the laser scanner accuracy; subsequently<br />
nurbs surfaces, profiles and cross sections have been extracted<br />
to work as input data for further analysis in AutoCAD environment<br />
for the restoration of the wooden horse.<br />
Figure 7: Generation of the cross sections by means of the intersection of the 3D<br />
Figure<br />
model<br />
7: Generation<br />
with vertical<br />
of the<br />
plans.<br />
cross sections by means of the intersection<br />
of the 3D model with vertical plans.<br />
References<br />
G. Bitelli, 2002. Moderne tecniche e strumentazioni per il rilievo dei<br />
beni culturali. Atti della 6a Conferenza Nazionale ASITA, 1, pp.<br />
IX-XXIV.<br />
W. Boehler, M. Bordas Vicent, A. Marbs, 2003. Investigating laser<br />
scanner accuracy. Proceedings of the XIXth <strong>CIPA</strong> Symposium<br />
at Antalya, Turkey, 30 september – 4 october, 2003.<br />
http://www.group.slac.stanford.edu/met/Align/Laser_Scanner/laserscanner_accuracy.pdf<br />
(accessed 13 Mar. 2007).<br />
W. Boehler, G. Heinz, A. Marbs, 2001. The potential of non-contact<br />
close range laser scanners for cultural heritage recording. Proceedings<br />
of the <strong>CIPA</strong> Symposium at Potsdam University, Germany,<br />
18 – 21 september 2001.<br />
http://cipa.icomos.org/fileadmin/papers/potsdam/2001-11-wb01.<br />
pdf (accessed 2 Mar. 2007).<br />
M. Fabris, V. Achilli, D. Bragagnolo, A. Menin, G. Salemi, 2005. Interpolazione<br />
di nuvole di punti ad alta risoluzione da rilievi laser<br />
scanner: applicazione a beni culturali ed architettonici. Atti della<br />
9° Conferenza Nazionale ASITA, 2, pp. 1037-1044.<br />
Fischer, 2004. Il Cavallo ligneo. Palazzo della Ragione.<br />
D. Lichti, J. Gordon, 2004. Error Propagation in Directly Georeferenced<br />
Terrestrial Laser Scanner Point Clouds for Cultural Heritage<br />
Recording. Proceedings of FIG Working Week 2004, Athens,<br />
Greece, May 22-27, 2004.<br />
http://www.fig.net/pub/athens/papers/wsa2/WSA2_6_Lichti_Gordon.pdf<br />
(accessed 26 Apr. 2007).<br />
T. Schulz, H. Ingensand, 2004. Influencing Variables, Precision and<br />
Accuracy of Terrestrial Laser Scanners. Proceedings of INGEO<br />
2004 and FIG Regional Central and Eastern European Conference<br />
on Engineering Surveying, Bratislava, Slovakia, November<br />
11-13, 2004.<br />
http://www.group.slac.stanford.edu/met/Align/Laser_Scanner/<br />
SchulzT_TS2_Bratislava_2004.pdf (accessed 13 Mar. 2007).<br />
R. Staiger, 2005. The Geometrical Quality of Terrestrial Laser Scanner<br />
(TLS). Proceedings of Pharaohs to Geoinformatics FIG<br />
Working Week 2005 and GSDI-8 Cairo, Egypt, April 16-21,<br />
2005. http://www.fig.net/pub/cairo/abstracts/ts_38/ts38_05_<br />
staiger_abs.pdf (accessed 2 Mar. 2007).<br />
20 <strong>CIPA</strong> <strong>HERITAGE</strong> <strong>DOCUMENTATION</strong> BEST PRACTICES AND APPLICATIONS Series I, 2007 & 2009
ABSTRACT<br />
The multi-image spherical panoramas<br />
as a tool for architectural survey<br />
Gabriele Fangi<br />
Polytechnical University of Marche, Ancona, Italy, g.fangi@univpm.it<br />
The surveys of the interior of two churches in Italy, the<br />
Magdalene’s church in Pesaro, and San Dominic church in Arezzo,<br />
are shown and described as examples of a new photogrammetric<br />
technique. The first church is one of the most noticeable<br />
baroque architecture in the Marche region and it has been designed<br />
by the famous architect Luigi Vanvitelli in 18th century,<br />
the second one is a large and simple church in Arezzo. The proposed<br />
technique is based on the multi-image spherical panoramas.<br />
For the formation of the plane image of the spherical panoramas<br />
the commercial software has been used. The spherical<br />
panorama can be regarded as the analogical recording of the angular<br />
observations of a theodolite having its center in the center<br />
of panorama. But to be set in operational conditions as a theodolite,<br />
the spherical panorama has to recover two rotation angles<br />
to set the verticality of its principal axis. The estimation of such<br />
rotation angles can be performed both in a preliminary phase prior<br />
to the plotting or in a unique phase in a block adjustment.<br />
Control points, control directions, geometric constraints such as<br />
verticality and horizontality of space lines, can be used. In these<br />
study-cases almost no one of such control information was necessary,<br />
but the only block adjustment was sufficient. The block<br />
adjustment finally furnishes the estimation of the unknown points<br />
coordinates together with the six orientation parameters per panorama,<br />
three translations and three rotations, by means of the<br />
known geodetic equations of the horizontal direction and the zenith<br />
angle, (modified to take into account the two horizontal correction<br />
angles), that are nothing else than the collinearity equations<br />
of the spherical panoramas. The technique of the spherical<br />
panoramas has previously been experimented and used for the<br />
survey of two of the most noticeable Italian squares, Piazza del<br />
Popolo in Ascoli Piceno and Piazza del Campo in Siena. By that<br />
time, to be able to use the panoramas, besides the angular corrections,<br />
further polynomial corrections were necessary, gotten<br />
from a dense network of control points (100-200), (Fangi, 2006).<br />
In the case under examination not only such corrections were not<br />
needed but also no control point was used. The procedure improvement<br />
can be explained with the shorter distances, with the<br />
good improvement of the Stitching software, (that thanks also to<br />
the ceiling texture, produced better panoramas), and finally with<br />
the improvement of the adjustment algorithms, via the block adjustment.<br />
The image distortion is automatically corrected by the<br />
software itself in the rendering phase, by merging the overlapping<br />
image frames. The interior orientation is skipped. For the time<br />
being, the final plotting accuracy is limited by the quality of the<br />
panoramas and by the resolution of the spherical images. In the<br />
shown examples the width was 10.000 and 15.000 pixels for all<br />
the panoramas, corresponding to an angular accuracy of 0.04-<br />
0.03 g, therefore very scarce. The 3d plotting was performed<br />
with monoscopic multi-image observations. In the first example<br />
the block adjustment supplied, besides the orientation parameters,<br />
the coordinates of about 600 points, observed in at least<br />
three panoramas. The achieved accuracy is in the order of few<br />
the centimetres say σ x = σ y = ±0.02 m and σ z = ± 0.03m. The<br />
advantage of the spherical panorama in comparison to classical<br />
photogrammetry consists in the greater completeness of the information<br />
due to its 360° amplitude, giving a synoptic view of the<br />
whole environment. A single panorama can replace many image<br />
frames; a couple of panoramas can substitute many photogrammetric<br />
models. The spherical panoramas are very simple, fast<br />
and easy to realize, they are very economic, and they are a very<br />
useful and powerful tool for the documentation and survey of the<br />
cultural heritage.<br />
Key words: Multi-image spherical panoramas, simulation, adjustment,<br />
simple systems.<br />
Introduction<br />
Till now the only metric applications of images panning to<br />
360°, were mainly those gotten with high resolution rotating<br />
cameras (5, Luhmann, Tecklenburg, 2004, 6, 7, Schneider,<br />
Maas, 2004). The technique here proposed uses on the con-<br />
tHe multI-Image sPHerIcal Panoramas as a tool For arcHItectural survey<br />
21
Figure 1. The latitude-longitude projection.<br />
Relationship between spherical<br />
coordinates and the image coordinate<br />
of a spherical image.<br />
trary panoramas realized with images taken with normal digital<br />
cameras and then mosaicate with common commercial<br />
software. The projection sphere of the images is mapped in<br />
the cartographic plane with the so-called longitude-latitude<br />
representation from which the angular directions can be<br />
drawn that one would measure with a theodolite whose center<br />
coincides with the center of the sphere. The greatest difference<br />
consists in the fact that while the theodolite is set<br />
with its principal axis vertical, in the case of the sphere it is<br />
not possible to sufficiently make vertical the principal axis.<br />
One must estimate and apply two correction angles around<br />
the two horizontal axes (as it is done by a biaxial compensator<br />
in the theodolite). After the correction, the restitution of<br />
the object takes place with the normal topographical methods<br />
as intersection and resection. The parameters of orientation<br />
of a panorama are six, the three coordinates of the center<br />
and three angles, of which one, around the z axis, is the<br />
zero bearing, common to all the angular theodolite stations.<br />
Among the center of projection, the image point and the object<br />
point the collinearity equations are written, which are<br />
nothing but the traditional equations to the horizontal direction<br />
and the zenith angle, corrected to take into account of<br />
the missed verticality of the principal axis of the sphere. One<br />
can also write the coplanarity equations between two panoramas<br />
and estimate the five parameters of the relative orientation<br />
of one panorama to the other one and to proceed therefore<br />
to the computation of the model coordinates. In this approach<br />
the phase of interior orientation is completely omitted.<br />
The pattern of the errors has practically been observed<br />
in all the real panoramas as a consequence of the missing axis<br />
verticality. The survey with the spherical panoramas has<br />
been in fact experimented for the first time for two noticeable<br />
Italian squares, Plaza of the People to Ascoli Piceno and<br />
Piazza del Campo in Siena (3, Fangi, 2006). In the tests<br />
here proposed, realized for the survey of the interior of some<br />
churches, almost no control point was needed. The improvement<br />
of the technique can be explained with the particular<br />
geometry of the objects but above all with the block adjustment<br />
of the observations.<br />
X<br />
Ο<br />
Z<br />
φ<br />
P´<br />
θ<br />
The Multi-Image Spherical Panoramas<br />
The theory of the multi-image spherical panorama has been<br />
developed by Szelisky in 1994 for the Apple Computers (8,<br />
Szelisky, Shum, 1997). The whole extension to 360° around<br />
the taking point is covered by photos, all of them having the<br />
same center of taking, and partially overlapping. The ray connecting<br />
this center with the object point intersects the two<br />
adjacent photos in the corresponding image point. Such ray<br />
projects the image points on a sphere of arbitrary radius. The<br />
sphere is then mapped on the cartographic plane with the socalled<br />
latitude - longitude representation (figure 1).<br />
x = r. u e y = r. f<br />
[1]<br />
with the angles expressed in radiant. Such representation is<br />
not conform, nor equivalent. The poles of the sphere are represented<br />
by two segments of equal length to the circumference<br />
of the sphere, and therefore equator and poles have the<br />
same length. The height of the map is equal to the development<br />
of a meridian. From such representation the angles of direction<br />
of the projective line can be drawn. In fact, knowing<br />
the extension, the radius of the generating sphere is derived.<br />
22 <strong>CIPA</strong> <strong>HERITAGE</strong> <strong>DOCUMENTATION</strong> BEST PRACTICES AND APPLICATIONS Series I, 2007 & 2009<br />
Y<br />
P<br />
y<br />
x<br />
θr<br />
r<br />
a<br />
= [2]<br />
2p<br />
x y<br />
= fu<br />
= [3]<br />
r r<br />
They are the same that would be measured with a theodolite.<br />
Two are the differences: the first one is the achievable precision,<br />
in fact maximum width is around the 20.000 pixels, and<br />
every pixel corresponds to 0.02 gon, therefore very inferior to<br />
the one of a theodolite. The second difference is that in the<br />
sphere, contrarily to what happens in the theodolite, the axis<br />
cannot be set vertical with sufficient accuracy. It is necessary<br />
therefore before derive the angular directions, to estimate and<br />
correct two rotation angles around the horizontal axes. Such<br />
operation is equivalent to a biaxial compensator of a theodolite.<br />
The estimation of such angles can be done with different<br />
methods (6, Fangi 2006) such as control directions, control<br />
points, geometric constraints such as horizontality and verticality<br />
and finally block adjustment.<br />
φr<br />
P´<br />
a=2πr<br />
πr
X<br />
Z<br />
Ο T<br />
x*<br />
The Collinearity Equations or the<br />
Corrected Equations of the Horizontal<br />
Direction and of the Vertical Angle<br />
The point coordinates<br />
Y<br />
Let’s considerer three orthogonal reference systems (figure 2):<br />
a) a local terrain system [OT;X,Y,Z] with vertical Z axis (“terrain<br />
system”);<br />
b) an auxiliary system [O;X´,Y´,Z´] parallel to the terrain system<br />
with vertical Z axis, with origin in the centre<br />
O(X0,Y0,Z0) of the sphere, (“sphere system”);<br />
c) a system [O;X*,Y*,Z*] centred in the centre O of the sphere<br />
and oriented parallel to the panorama borders, with Z axis<br />
not vertical, from now on called “panorama system”.<br />
Given an arbitrary object point P(X,Y,Z), it is:<br />
x´<br />
z´<br />
O<br />
X´ = X – X0 Y´ = Y – Y0 [4]<br />
Z´ = Z – Z0 The spherical coordinates of the point P in the panorama<br />
system, are (figure 2):<br />
The angular corrections<br />
X*=d · sin φ · sin θ<br />
Y*= d · sin φ · cos θ [5]<br />
Z*= d · cos φ<br />
The corrected spherical coordinates (Xʹ,Yʹ,Zʹ) can be derived<br />
from Xʹ,Yʹ,Zʹ of the sphere system, with a rotation matrix where<br />
the angular corrections, da x, da y around the two horizontal axes,<br />
are small enough:<br />
R<br />
X*<br />
V R<br />
1 0 -da V R<br />
y X-X V R<br />
V<br />
d sinusin f<br />
S W S<br />
W S 0 W S<br />
W<br />
SY*<br />
W = S 0 1 da .<br />
xW<br />
S Y-Y0W= S d cos usin fW<br />
S<br />
W S<br />
S S<br />
Z* W<br />
W W<br />
W<br />
Sday<br />
-dax<br />
1 W S Z-Z0WS d cos f W<br />
T X T<br />
X T X T<br />
X<br />
Y´<br />
Z´ X´<br />
Figure 2. Relationship between object coordinates, spherical coordinates,<br />
before and after the correction of verticality.<br />
z*<br />
y*<br />
P0<br />
Z*<br />
P<br />
Y´<br />
X*<br />
y*<br />
[6]<br />
By dividing the first by the second one we get:<br />
x X*<br />
r1( X- X0) + r2( Y- Y0) + r3( Z-Z0) u = u0+ = atg = atg =<br />
r Y*<br />
r ( X- X ) + r ( Y- Y ) + r ( Z-Z) 4 0 5 0 6 0<br />
Xl-daZ y l<br />
= atg<br />
Yl+ da .<br />
[7]<br />
Zl<br />
x<br />
Where θ 0 is the zero bearing of the origine, R radius, x and<br />
y image coordinates of the panorama. As it is known, the zero<br />
bearing is the clokwise angle between the northern direction<br />
and the direction of the origine of the angles, the left border of<br />
the panorama in this case. We derive:<br />
. X*<br />
Xl-daZ x atg .<br />
y l<br />
= R b- u0+ l = R f-<br />
u atg<br />
Y*<br />
0+<br />
Yl+ da . p [8]<br />
Zl<br />
From the third:<br />
Zl<br />
r3( X- X0) + r6( Y- Y0) + r9( Z-Z0) f = a cos = a cos<br />
=<br />
d<br />
d<br />
=<br />
O´<br />
z´<br />
a cos<br />
P´<br />
K´<br />
- dayXl+ daY x l+ Zl<br />
[9]<br />
d<br />
2 2 2 2 2 2<br />
where d = Xl + Yl + Zl= X* + Y* + Z*<br />
is the distance of the sphere center O from point P, invariant<br />
in the two reference systems.<br />
The preceding equations are the equations of collinearity<br />
for the spherical panoramas or the correct equations of the<br />
horizontal direction and the vertical angle corrected to take<br />
into account the missed verticality of the axis of the sphere.<br />
They must be linearized near approximate values of the parameters<br />
and coordinates and then adjusted in block, according<br />
to a surveying technique already set-up (2, Fangi,<br />
2004). The restitution takes places by means of the eqns.<br />
[7] and [9]. The approximated values are supplied by a classical<br />
procedure where the initial values of the correction angles<br />
are set to zero, or by means of the relative orientation<br />
described in 4.<br />
tHe multI-Image sPHerIcal Panoramas as a tool For arcHItectural survey<br />
P<br />
y´<br />
x´<br />
b<br />
K´´<br />
P´´<br />
O´´<br />
Figure 3. The coplanarity of two spherical panoramas.<br />
z´´<br />
x<br />
y´´<br />
x´´<br />
23
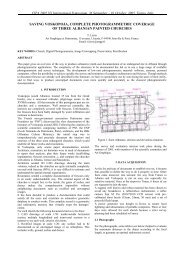
Figure 5. Church of the Holy<br />
Magdalene, Pesaro -<br />
The observation network<br />
done from the<br />
five panoramas<br />
(left).<br />
Figure 6. Distribution<br />
of the<br />
error vectors<br />
amplified 10<br />
times. It is evident<br />
a systematic<br />
effect (right).<br />
The Coplanarity Condition<br />
The two corresponding image points Pʹ(xʹ,yʹ,zʹ) and Pʹʹ(xʹʹ,yʹʹ,zʹʹ)<br />
of the arbitrary object point P on the two spheres lay on the<br />
same epipolar plane OʹPO” and their coordinates satisfy the<br />
coplanarity condition:<br />
g = x´ T R´ T bR´´ x´´ = 0 [10]<br />
R<br />
V R V<br />
S 0 -bz<br />
by W S xmW<br />
T<br />
6xl<br />
yl zl@ Rl S bz 0 - bxW Rm<br />
S ymW<br />
= 0 [11]<br />
S<br />
W S<br />
S-by<br />
bx 0 W S<br />
W<br />
zmW<br />
T<br />
X T X<br />
where Rʹ and Rʹʹ are the rotation matrix of the two bundles, bx,<br />
by, bz, the components of the base b. Eqn. [10] is linearized<br />
and divided by the value of the two radii:<br />
R<br />
1 -dalz -dal<br />
V<br />
S<br />
yW<br />
6(<br />
sinfl. sin ul) ( sin fl. cos ul) cos fl@Sdal 1 da<br />
.<br />
z - lx<br />
W<br />
S<br />
W<br />
S-<br />
daly<br />
dalx<br />
1 W<br />
T<br />
X<br />
R<br />
S 0 -bz<br />
S bz 0<br />
S<br />
S-<br />
by bx<br />
T<br />
Figure 4. The central panorama of the Church of the Holy Magdalene in Pesaro, with the errors amplified 10 times.<br />
V<br />
by<br />
R<br />
1 dam<br />
( sin .<br />
z -dam<br />
V R<br />
V<br />
W S<br />
y W S fm sin um)<br />
W<br />
-bx W.<br />
S-dam<br />
1 da<br />
. ( sin f .<br />
z mx<br />
W S m cos um)<br />
W = 0<br />
W S<br />
W S<br />
W<br />
0 W S damy<br />
-damx<br />
1 W S cos fm<br />
W<br />
X T<br />
X T<br />
X<br />
[12]<br />
The procedure is similar to the one set up for the theodolite<br />
stations that was called “blind traverse” (Fangi, 1,1998),<br />
with the sole difference that the unknown parameters increase<br />
from four to six and that the relative orientation is performed<br />
with five independent parameters among the 8 possible, as in<br />
traditional photogrammetry. The solution of [12] brings to the<br />
relative orientation of one bundle with respect to the other<br />
one. The relative orientation is useful to link stations not having<br />
reciprocal observations and therefore to supply the approximated<br />
values of the unknown coordinates to input in [7] and<br />
[9] for the block adjustment. Note that no control information<br />
neither interior orientation is needed.<br />
The Church of the Holy Magdalene<br />
in Pesaro<br />
Our first tests on the metric use of the spherical panoramas<br />
date from 2005. The experiments have been done in the campus<br />
of the faculty of Engineering in Ancona, in Piazza del Popolo<br />
in Ascoli Piceno, in Piazza del Campo in Siena. The results<br />
have not been satisfactory entirely (3, Fangi, 2006). The<br />
church of the Magdalene is in Pesaro has been designed by<br />
24 <strong>CIPA</strong> <strong>HERITAGE</strong> <strong>DOCUMENTATION</strong> BEST PRACTICES AND APPLICATIONS Series I, 2007 & 2009
the architect Luigi Vanvitelli and built between 1740 and<br />
1745. It is a Baroque church of medium size (figures 4, 7 and<br />
8). Five panoramas have been taken one in the center and four<br />
according to the principal directions of the plan (figure 5). Every<br />
panorama is composed by 25 frames taken with Panasonic<br />
Lumix TZ10 camera 35mm equivalent focal length, 5Mb. The<br />
Figure 8. Church of the Magdalene – Plan and lateral view of the wire-frame.<br />
Figure 7. Church of the Holy<br />
Magdalene, Pesaro. The wireframe<br />
of the model, axonometry.<br />
software used for the formation of the panorama is Stitcher 5<br />
Realviz, the width of every panorama is 10.000 pixels. With a<br />
theodolite the position of the five centers of the panoramas<br />
has been established. A block adjustment of the observations<br />
has been done, fixing the coordinates of three station points<br />
only, and the results are the following:<br />
tHe multI-Image sPHerIcal Panoramas as a tool For arcHItectural survey<br />
25
Magdalene Project, Pesaro September 2006<br />
Number of observations = 4640<br />
Number of unknowns = 1764<br />
Redundancy = 2876<br />
Number of unknown points 583<br />
sigma zero =.0018754 rad = 0.1194g = 3 pixel.<br />
Average of sd of the adjusted points<br />
sqmx = .029m, sqmy = .032m, sqmz = .043m<br />
After the restitution, 64 check points, taken with the reflectorless<br />
total station, have been compared with those taken<br />
with the photogrammetry, table 2.<br />
In figures 4 and 6 the effects of a systematism are evident;<br />
therefore even if the average value of the module for the<br />
errors is 6 cms, when the systematic error is eliminated, a<br />
consistent reduction of such value will result. In the table 2<br />
are shown the values of the correction angles. Note that their<br />
standard deviations are of one order inferior.<br />
Only 3 fixed Stations Points<br />
(64 check points)<br />
sx = 0.0234, sy = -0.0333, sz = 0.0044<br />
mean module = 0.0639<br />
Table 1: Average of RMS errors on check points (in m).<br />
3 SP+ 3 Control Points<br />
(58 check points)<br />
sx = 0.0190, sy =-0.0197, sz =0.0081<br />
mean module = 0.0470<br />
The Church of St. Dominic in Arezzo<br />
Church of rectangular plan with narrow high gothic windows<br />
was built at the end of the 1200; it guards in the altar the famous<br />
painted Crucifix of Cimabue (XIII sec.). The inside,<br />
with one nave only with beamed ceiling, is decorated with<br />
frescos of the 13 th and 14 th centuries (figure 9). On the right<br />
wall the Gothic chapel Dragondelli stands. Two panoramas<br />
with Lumix Panasonic FZ50 camera, 35 mm equivalent focal<br />
length, 10Mb, were taken by the A. only for tourist purposes.<br />
The panorama formation is by Autopano Pro, the<br />
width of every panorama is 15.000 pixels. Since no one<br />
measure nor control point were available, the plotting was<br />
carried out with the procedure of the relative orientation, described<br />
in 4, where an arbitrary value of 100 was given to the<br />
base. As can be seen, the building frame is oriented according<br />
to the relative symmetric system and it is not levelled. It<br />
was not possible to plot the abse, for the bad quality of the<br />
intersection and for the lack of photographic coverage. Obviously<br />
it is not possible to give some qualitative parameter of<br />
the restitution. The geometric congruence can serve as sole<br />
verification.<br />
Table 2: Values of the correction angles and their standard deviations (gon).<br />
Figure 9. Church of St. Dominic, Arezzo, one of the two spherical panoramas utilized for the plotting.<br />
Test 3 SP+ 10 CP<br />
(51 check points)<br />
sx = 0.0203, sy = -0.0246, sz=0.0065<br />
mean module = 0.0537<br />
panorama 1 2 3 4 5<br />
Alfax -0.5323 ±0.0148 -0.2807 ±0.0104 0.1954±0.0096 -0.24620 ±0.0111 0.0560 ±0.0097<br />
alfay -0.3198±0.0148 -0.3877±0.0104 0.0332±0.0096 -0.42673±0.0111 -0.4414 ±0.0097<br />
26 <strong>CIPA</strong> <strong>HERITAGE</strong> <strong>DOCUMENTATION</strong> BEST PRACTICES AND APPLICATIONS Series I, 2007 & 2009
Conclusions<br />
Y<br />
Figure 10. The network of observations of St. Dominic for the relative orientation, with the two panoramas Pan1s and Pan2 and the relative system.<br />
Figure 11. Church of St. Dominic, Arezzo, axonometry of the plotting (wireframe).Due<br />
to the bad configuration of the intersection, the front and back<br />
walls are characterized by a scarce precision.<br />
The accuracy of the here proposed photogrammetric procedure<br />
is the one typical of the monoscopic systems. The advantages<br />
are many: the great speed of execution, every couple of<br />
panorama includes or replaces many photogrammetric models,<br />
the completeness of documentation, every panorama constitutes<br />
the ideal image extending 360°. The possibility to skip<br />
the interior orientation, due to the spherical form of the equivalent<br />
sensor or pseudo-sensor, permits the direct plotting from<br />
relative orientation. Finally the great inexpensiveness of the<br />
system, being the equipment very economic and light. On the<br />
other side the limit is in the low spatial resolution and in the<br />
X<br />
prevailing use for indoor environments, where the construction<br />
of the panorama is facilitated by the presence of the ceiling. All<br />
these advantages with the possibility to perform a plotting with<br />
very simple measurements only, like tape distances, make the<br />
procedure to be a very useful tool for recording and classification<br />
of cultural heritage, even for non expert people.<br />
Besides the possibility not to employ expensive instrumentation<br />
as the theodolite and the capability to perform the<br />
plotting in relative orientation, the sizing and the levelling can<br />
be done afterwards by simple means, make the procedure a<br />
precious tool for the survey and the cataloguing cultural heritage<br />
in the developing countries.<br />
tHe multI-Image sPHerIcal Panoramas as a tool For arcHItectural survey<br />
z<br />
27<br />
y
Thanks<br />
I am grateful to Giuseppe Di Carlo for the help in the plotting of<br />
the church of the Holy Magdalene, to Marco Giacinti for supplying<br />
the CreatePoints software for the image measurements.<br />
References<br />
1. Fangi G. (1998) The Coplanarity Condition For The Orientation In<br />
Surveying - ISPRS Arch. WG VI/3.<br />
2. G. Fangi (2004) - Block bundle adjustment for theodolite stations<br />
in control networks - The case of the Guggenheim museum in<br />
Bilbao, - ISPRS Archives vol. XXXV part B5, pg 372-376 – ISSN<br />
1682 - 1750.<br />
3. G.Fangi (2006) - Investigation On The Suitability Of The Spherical<br />
Panoramas By Realviz Stitcher For Metric Purposes, ISPRS<br />
Archive vol.XXXVI Part 5.<br />
4. H.Haggrén, H. Hyyppä, O. Jokinen, A. Kukko, M. Nuikka, T.<br />
Pitkänen, P.Pöntinen, R. Rönnholm (2004) – Photogrammetric<br />
Application of Spherical Imaging - ISPRS Archives Vol. XXXIV,<br />
part 5/W16.<br />
5. T.Luhmann, W. Tecklenburg (2004) – 3-D Object Reconstruction<br />
from Multiple-Station Panorama Imagery - ISPRS Archives Vol.<br />
XXXIV, part 5/W16.<br />
6. D.Schneider, H.-G. Maas (2004) – Application and Accuracy Potential<br />
of a Strict Geometric Model for rotating Lines Cameras<br />
–ISPRS Archives Vol. XXXIV, part 5/W16.<br />
7. D.Schneider, H.-G. Maas (2005) – Combined Bundle Adjustment<br />
of Panoramic and Central Perspective Images –, – ISPRS Archives<br />
Vol XXXVI-5/W8.<br />
8. R. Szeliski and H. Shum. (1997) Creating full view panoramic image<br />
mosaics and environment maps. In Proc. of SIGGRAPH, pages<br />
251-258.<br />
28 <strong>CIPA</strong> <strong>HERITAGE</strong> <strong>DOCUMENTATION</strong> BEST PRACTICES AND APPLICATIONS Series I, 2007 & 2009
ABSTRACT<br />
On the initiative of Marylène Barret, archaeologist and art restorer<br />
working at the French embassy in Sana’a Yemen, and detached<br />
at the SFD (Social Fund for Development) of Yemen, professors<br />
of the French ENSG (Ecole Nationale des Sciences Géographiques),<br />
together with some of their students went twice to<br />
Yemen since October 2004 to survey five historic mosques on<br />
the point of being restored. The goal of both field operations and<br />
post-processing of the collected data was to provide a specific<br />
training and to enable a transfer of technology to a Yemeni team<br />
who should soon be in charge of organizing by themselves similar<br />
operations as part of a specific unit at the SFD. Today, according<br />
to an agreement between the ENSG and the SFD, trainings<br />
should go on to make that unit operational as soon as possible.<br />
Introduction<br />
Context<br />
In the south of the Arabian Peninsula lies Yemen, formerly<br />
known as an important step on the Frankincense Road, well<br />
known today for its astonishing mountainous landscape, and<br />
much less so for its very rich architectural heritage. This richness<br />
is a result of the country’s former prosperity, and needs<br />
to be transmitted to future generations. Any action of safeguarding<br />
this cultural heritage is of course valuable. The first<br />
step to preserving a monument is simply to produce a complete<br />
and precise documentation of it.<br />
Partners<br />
Architectural patrimony management<br />
in Yemen<br />
R. Héno 1 , Y. Egels 2<br />
1. Ecole Nationale des Sciences Géographiques, Département d’Imagerie Aérienne et Spatiale,<br />
Cité Descartes, F-77455 Marne-la-Vallée CEDEX, France, raphaele.heno@ensg.ign.fr<br />
2. Professeur, consultant, 99 rue de Charonne F-75011 Paris, France, yves.egels@free.fr<br />
Marylène Barret, archaeologist and art restorer working at the<br />
French embassy in Sana’a (Barret, 2004), the capital of Yemen,<br />
and detached at the Social Fund for Development of Yemen<br />
(SFD), was the first to introduce the idea of creating in the<br />
country one team able to use traditional techniques of closerange<br />
photogrammetry to produce the documentation.<br />
The SFD is an autonomous agency with financial and administrative<br />
independence, governed by a Board of Directors,<br />
representing the government, NGOs, and the private sector<br />
under the chairmanship of the Yemeni Prime Minister. The<br />
SFD seeks to reduce poverty by improving living conditions<br />
and providing income generating opportunities for the poor. It<br />
should be noted that it already has a department for Cultural<br />
Heritage.<br />
Having read about the particular works previously done by<br />
French IGN (Institut Géographique National) on prestigious archeological<br />
sites, Marylène Barret invited its technical university,<br />
the ENSG (Ecole Nationale des Sciences Géographiques),<br />
to survey the first monument in order to convince the Yemeni<br />
authorities of its interest. In that context, four ENSG teachers,<br />
Figure 1: Yemen in the Arabian Peninsula.<br />
arcHItectural PatrImony management In yemen<br />
29
Great Mosque<br />
of Sana’a,<br />
size: 75×66m.<br />
together with six post-graduates (Photogrammetry, Positioning<br />
and Measures of Deformations), went to Yemen twice to do a<br />
photogrammetric survey of historic mosques on the point of<br />
being restored.<br />
Sites of interest<br />
Five mosques were completely surveyed: at first, in October<br />
2004, the small mosque of Asnaf, the great mosques of Sana’a<br />
(7-8 th /9 th /12 th century) and Shibam-Kawkaban (9 th /10 th century),<br />
then, in October 2005, the mosques of Al Ahsrafieh<br />
(13 th century) and Al Muzzafar (13 th century) in Taez.<br />
Recording the Monuments<br />
Field work using a combination of topometry,<br />
photogrammetry and lasergrammetry<br />
Methodology<br />
In order to obtain a reliable and accurate survey, being faithful<br />
to the shape and appearance of the monument, it has<br />
been decided to use topometry, photogrammetry and 3D laser<br />
scanning altogether.<br />
Mosque of Asnaf, recently restored, size: 9×8m.<br />
The two mosques surveyed in Taez, Al Ahsrafieh (size: 35×30m)<br />
and Al Muzzafar (size: 54×54m).<br />
Figure 2: The surveyed monuments.<br />
Setting up a local topometric system<br />
A local network of both flat and spherical targets has been set<br />
up and measured to ensure that images and laser scenes could<br />
be used later and combined into a common 3D coordinate system.<br />
Reference points were located inside (and even in a part of<br />
the underground floors) and outside the mosques, links between<br />
them being made through the doors (between inner and<br />
outer mosque, and also between the inner mosque and the<br />
courtyard) and the terrace. A basic network in 3D was thus<br />
formed on which all the measurements depend. The team used<br />
Trimble 5600 DR, Trimble 3600 DR, and LEICA TCR 803 (Direct<br />
Reflex) total stations for the control survey. The total stations’<br />
direct reflex capabilities also enabled the team to take<br />
measurements of distance without prisms and accurately determine<br />
the position of the spherical targets by direct measurement.<br />
In total, 450 control points were established at Sana’a,<br />
200 at Shibam and around 200 also in the two mosques in<br />
Taez. The 3D coordinates of all the network points were computed<br />
with COMP3D, a software program for global bundle adjustment,<br />
for micro-geodesy, photogrammetry, and 3D scanning<br />
developed by Yves Egels, ENSG’ professor. Results were<br />
validated on the site and the precision achieved was approx.<br />
30 <strong>CIPA</strong> <strong>HERITAGE</strong> <strong>DOCUMENTATION</strong> BEST PRACTICES AND APPLICATIONS Series I, 2007 & 2009
Figure 3: Extract of the wooden steep sided ceilings (real and schematic<br />
views) and cross-section. Figure 4: Image shooting of the ceilings.<br />
5-6 mm (0.2 in) on the Shibam site and approx. 1 cm (0.4 in)<br />
on the Sana’a site; these differences being mainly due to the<br />
size difference of the surveyed sites (a 75-m-long (246-ft) side<br />
for the Sana’a mosque, 35-m-long (115-ft) for Shibam).<br />
Image shooting<br />
Although a terrestrial 3D laser scanner was available (Trimble<br />
GS100), traditional photogrammetry was considered for at<br />
least two reasons. For one thing, some nicely decorated details<br />
obviously required high resolution images that the scanner<br />
could not ensure. Secondly, the configuration of the<br />
mosque itself, like the wooden steep sided ceilings (Figure 3),<br />
was so complex that a complete 3D laser scanning would have<br />
been much more tedious than a regular stereoplotting.<br />
Thus, traditional stereoscopic image coverage has been<br />
made on the ceilings, as well as the facade walls, and the particular<br />
details, such as the “mihrab”. A Minolta Dimage previously<br />
calibrated at the ENSG, equipped with an outer flash<br />
was used, producing approximately 400 images on the site of<br />
Sana’a, and 200 in Shibam. In order to be as productive as<br />
possible, images have been taken from ground level, which resulted<br />
in an average ceilings pixel size of 3mm.<br />
3D laser scanning<br />
A Trimble 3D Scanner was used to survey the general architecture<br />
of the buildings (columns, arches, interior and exterior<br />
walls, and terraces) shaped without decoration but with lots of<br />
hidden parts. The measurement interval was approx. 15 mm<br />
(0.6 in). 3D scanning is well suited to the walls as well as terraces<br />
and pillars in which detail density is fairly low, enabling<br />
rapid scanning at a low resolution. In contrast to photogrammetry<br />
techniques, the scanner’s acquisition time is proportional<br />
to the detail desired. However, it is also less sensitive to<br />
hidden areas (no need for stereoscopy, precision independent<br />
of distance). Its main advantage is its ability to rapidly supply<br />
large amounts of data without major processing. For instance,<br />
the team completed 100 hours of scanning over two weeks to<br />
acquire the necessary data for the mosques of Sana’a and<br />
Shibam.<br />
Data processing in France<br />
Vertigeo<br />
A tacit agreement between the SFD and the ENSG first stipulated<br />
that five mosques be surveyed by ENSG’ students, their<br />
expenses such as plane tickets and local accommodation being<br />
paid by SFD. Further data processing was subject to another<br />
contract signed in 2005 by Vertigeo, the ENSG company<br />
managed by students. Since that time, ENSG’ students<br />
helped by their professors have worked in their free time to<br />
produce and deliver the expected results.<br />
Products to deliver<br />
The list of results to be produced was vague at the beginning,<br />
as the SFD as a sponsor knew little about the possible results<br />
of topometry, photogrammetry and lasergrammetry, and as the<br />
ENSG itself was making its first life-size field survey with a laser<br />
scanner. Traditional outputs of an architectural survey were<br />
Republic of Yemen<br />
City of Sana’a<br />
Great mosque<br />
ORTHOIMAGE OF THE CEILING<br />
F01-L01<br />
Scale : 1/10<br />
Data process : Topography-Photogrammetry-3D Laser scanner<br />
Coordinates : Local system<br />
Elevation : Local system<br />
Orientation : True North<br />
© IGN-ENSG 2006<br />
Direction générale<br />
de la Coopération<br />
Internationale et<br />
du Développement<br />
Figure 5: Box out<br />
of the graphical<br />
rules retained<br />
by Vertigeo.<br />
arcHItectural PatrImony management In yemen<br />
31
however required: horizontal plane at ground level, vertical elevations,<br />
main cross-sections, and orthoimage for the wooden<br />
ceilings and for the façades. Results had to be delivered digitally<br />
and in hardcopy according to graphical rules that Vertigeo<br />
was free to design (Figure 5).<br />
Orthoimages were computed at the closest resolution to<br />
the ground resolution of raw images, that is to say 3mm for<br />
the ceilings of the mosques of Sana’a and Shibam, and 5mm<br />
for the façades. Ceilings were printed at the scale of 1/10 (Figure<br />
6), and façades at the scale of 1/50.<br />
Figure 6:<br />
One row<br />
being printed<br />
at the scale<br />
of 1/10.<br />
Figure 7: alpha layers<br />
Photogrammetric tools<br />
Aerotriangulation<br />
An IGN software, Topaéro, normally designed to compute<br />
georeferencement of aerial images with the bundle adjustment<br />
method, has been successfully used for computing the<br />
aerotriangulation of the wooden ceilings and of the façades.<br />
Tie points had been previously measured in a semi-automatic<br />
way, using LPS.<br />
Orthorectification<br />
Automatic correlation was tested on the wooden ceilings to<br />
produce DSM, which is necessary to compute a true orthoimage.<br />
As a matter of fact, the ceilings look very much like a<br />
dense urban area, although it is seen from below rather from<br />
the top. But because of the repetitive aspect of the ceilings,<br />
both in shape and drawing, the correlation results were so poor<br />
that the interactive editing task would probably have been longer<br />
than direct manual stereoplotting! Nevertheless the volume<br />
of traditional stereoplotting would have lead to unacceptable<br />
delivery time. Thus, a simplified method was adopted : only the<br />
lowest wooden beams have been recorded into the DSM, while<br />
in Adobe Photoshop, the central area of the images were defined,<br />
limited at both extremities by the lowest beams, and<br />
saved into alpha layers (Figure 7), that the software later used<br />
to compute the orthoimage, was able to understand as such.<br />
Taking only the central part of the images easily allowed the orthoimage<br />
to look like a “true” one, while limiting the area of interest<br />
to the lowest beam avoided possible ghosting effects or<br />
any wrong edge matching artifacts.<br />
This simplified methodology was only applied for the ceilings,<br />
because it was acceptable regarding the cost and the<br />
geometric accuracy, satisfying the architects at the same<br />
time. As a matter of fact, even if the delivered orthoimage<br />
32 <strong>CIPA</strong> <strong>HERITAGE</strong> <strong>DOCUMENTATION</strong> BEST PRACTICES AND APPLICATIONS Series I, 2007 & 2009
was not 1cm accurate as it was first expected, it gave the restorers<br />
a precious overview document, (Figure 8). Of course<br />
for the façades and other more usual areas, rigorous orthorectification<br />
was normally used at a reasonable cost.<br />
New products for architects and restorers<br />
Cumulus<br />
Furthermore, even if a huge potential of the dense laser scanning<br />
was assumed since the beginning, no efficient and user<br />
friendly tool was available yet on the market. Yves Egels, at<br />
that time head of the DIAS (photogrammetry department at<br />
the ENSG), already familiar with software development, decided<br />
to write a new one, mainly dedicated to terrestrial 3D laser<br />
Figure 8:<br />
Orthoimage<br />
of the ceilings<br />
of the<br />
Great Mosque<br />
of Sana’a.<br />
data processing. Rapidly operational, Cumulus was able to visualize<br />
laser data using any color, or scanning intensity, or color<br />
from the scanner low resolution camera, or even color from<br />
outer high resolution images whenever georeferenced in the<br />
same topometric system as the laser data. Cumulus was also<br />
able to georeference laser scenes using the spherical target of<br />
the topometric network, to compute sections through the laser<br />
data in any specified direction, and also to compute true<br />
orthoimages, taking into account both occlusions in the laser<br />
data and in georeferenced outer images. Y. Egels made his<br />
software also usable for 3D data captured by traditional stereoplotting,<br />
which, as mentioned above was helpful in producing<br />
orthoimages on the wooden ceilings.<br />
Graphical rendering of the data<br />
Since it became, thanks to Cumulus, rather simple to produce,<br />
among other things, sections and orthoimages, which<br />
are the traditional results that architects and restorers ask for,<br />
some of the people in charge of the restoration operations<br />
asked for more than was initially required, like more cross-sections<br />
(fourteen cross-sections were asked for the Great Mosque<br />
of Sana’a), and horizontal planes at different levels (ground<br />
level of course, but also pillar capital level). The raw output<br />
from Cumulus is unfortunately a bit rough, because of the unexpected<br />
objects which have been scanned together with the<br />
intended objects (the mosques were usually full of bookshelves<br />
which were too cumbersome to move), and also because<br />
of the intrinsic noise of the scanning.<br />
Moreover, there always remain occlusions that produce<br />
holes in the final products. All this makes it inevitable to clean<br />
the raw output from Cumulus, for use by most architects apparently<br />
not prepared to deal with such data. This step has<br />
been very little tried out so far at ENSG, mainly through lack<br />
of time and manpower. However, a student is expected to work<br />
on that specific subject at SFD during the summer 2007, to<br />
produce real cartographic data out of the raw output from Cumulus,<br />
and also to work out its methodology. However, one<br />
may expect that architects will slowly come to appreciate the<br />
very rich content of raw data, in spite of the above mentioned<br />
defects.<br />
Transfer of technology<br />
Yemeni pool of experts<br />
Figure 9: One raw cross-section in the Mosque of Sana’a.<br />
Besides proving to Yemeni authorities the validity of 3D modelling<br />
techniques, Marylène Barret also intended to set up in<br />
arcHItectural PatrImony management In yemen<br />
33
Yemen, and first in SFD, a specific unit specialized in advanced<br />
documentation techniques for the historical architectural<br />
heritage of Yemen. For that purpose, ENSG teachers<br />
have identified four Yemeni experts from among various specialists<br />
(architects, surveyors, engineers) as being sensitive to<br />
the urgent need to produce complete and accurate documentation<br />
of the rich Yemeni architectural heritage and able to understand<br />
the methods to produce this documentation.<br />
Training sessions<br />
In order to have that team operational as soon as possible,<br />
training sessions have been organized. Trainees first attended<br />
the two week field operation in Taez, where each of them<br />
worked together with one French student. This organization,<br />
apart from leading to friendships, gave the opportunity to<br />
Yemeni trainees to efficiently learn the basics of a field survey<br />
and to French students to clarify the knowledge they had to<br />
teach. After that, two more training sessions were given in<br />
Sana’a by ENSG teachers, during which basic theory required<br />
to use the photogrammetric tools for the whole process where<br />
taught. Most of these tools, like Cumulus, were translated into<br />
Arabic for the occasion. Finally the trainees came to France<br />
for one month, where they surveyed almost alone a part of the<br />
Chartreuse of Villeneuve-Lez-Avignon. This included field survey<br />
and data processing.<br />
Agreement of cooperation between the SFD<br />
and the ENSG<br />
An agreement between the SFD and the ENSG should be<br />
signed very soon, making the already very good relationships<br />
between these two official institutions. Training sessions will<br />
be regularly given in Yemen for at least two years, by ENSG<br />
professors and professionals. Some engineers or high level students<br />
could take part in implementing the documentation unit<br />
in SFD in their ENSG practical training (possible duration from<br />
two to six months). For instance, two ENSG students make<br />
their practical training in SFD during the summer of 2007, one<br />
to help organize the newly funded unit, the other to redraw<br />
some rough cross-sections and to write its methodology.<br />
SFD unit specialized in advanced documentation techniques<br />
for the historical architectural heritage of Yemen<br />
Although the documentation unit was first set up in SFD, it<br />
may well be transferred later on to other organizations. This will<br />
of course require the current Yemeni trainees to have a good<br />
knowledge of all steps in the production process, so that they<br />
can become trainers themselves. It seems to be safe to keep<br />
the documentation in SFD in its early stages, since SFD already<br />
invested in training sessions, and provided the first necessary<br />
basic equipment, that is to say, besides existing printers<br />
and computers, a semi-professional camera –Canon EOS<br />
5D-, a total station –Leica TCR 803- and topometric accessories.<br />
Purchasing a 3D terrestrial laser scanner will be considered<br />
only when the documentation unit works smoothly.<br />
Conclusion<br />
Although the idea of creating in Yemen an autonomous documentation<br />
unit was first looked on with some doubt, Marylène<br />
Barret worked hard and finally succeeded in having SFD support<br />
this project actively. Today, thanks to the SFD’s sincere<br />
involvement combined with great enthusiasm and long-term<br />
involvement of ENSG’ professors to see that unit work, tangible<br />
results may already be seen: on the one hand documents<br />
essential for the preservation of a still little-known heritage<br />
have been produced, and authorities are beginning to see its<br />
importance. On the other hand, the Yemeni team has received<br />
most of the equipment, and is starting already to work properly.<br />
Once the documentation unit is fully operational, which is<br />
expected to happen within two years, the next stage will be to<br />
see that unit itself becoming expert in the field of 3D documentation<br />
for Yemen and for the neighboring Middle-Eastern<br />
countries.<br />
References<br />
Barret M., 2004: Aga Khan award for the restoration of the Abbas<br />
mosque in Asnaf http://www.akdn.org/agency/akaa/ninthcycle/<br />
page_02txt.htm<br />
34 <strong>CIPA</strong> <strong>HERITAGE</strong> <strong>DOCUMENTATION</strong> BEST PRACTICES AND APPLICATIONS Series I, 2007 & 2009
ABSTRACT<br />
The treasure of the Essen cathedral in Germany is one of the few collections<br />
of medieval art completely preserved in the course of history,<br />
including approximately 250 objects such as crosses, crowns,<br />
swords, statues, manuscripts, and reliquaries. These precious works<br />
of art show a great variety in size, shape, material, and complexity. In<br />
the paper, ideas and concepts for recording the manifold objects of<br />
the treasure by optical methods such as photogrammetry, fringe projection<br />
and laser technique are reported on. The measurement systems<br />
used are described as well as calibration aspects, difficulties of<br />
data acquisition and processing are mentioned, and virtual models of<br />
the treasure are presented.<br />
Introduction<br />
3D modelling of heritage objects<br />
by fringe projection<br />
and laser scanning systems<br />
H.-J. Przybilla 1 , J. Peipe 2<br />
1. Lab. for Photogrammetry, Dept. of Surveying and Geoinformatics, Bochum University of Applied Sciences,<br />
Germany, heinz-juergen.przybilla@fh-bochum.de<br />
2. Institute for Photogrammetry and Cartography, Bundeswehr University Munich,<br />
Germany, j-k.peipe@unibw-muenchen.de<br />
The recording and modeling of cultural heritage objects for the<br />
purpose of conservation, structural investigation, restoration, visualization,<br />
documentation, and archiving is, by common consent, an<br />
important task. Mobile and flexible optical 3D measuring systems<br />
based on techniques such as photogrammetry, fringe projection,<br />
laser scanning, and combinations of these image-based or rangebased<br />
systems can successfully be applied to the measurement<br />
and virtual reconstruction of objects in art and cultural heritage.<br />
Recently, it was decided to establish a digital archive of the<br />
treasure of the Essen cathedral by means of optical 3D measurement<br />
methods. The treasure of the Essen cathedral is one of the<br />
most significant collections of ecclesiastical art in Germany. It<br />
originates from the former canoness convent’s treasure which<br />
passed into the property of the parish after the secularisation in<br />
1803. Since 1957 the diocese of Essen has been responsible for<br />
the treasure. Because only a few pieces have got lost in the course<br />
of history, the collection is exemplary due to its completeness.<br />
However, the treasure includes approximately 250 objects comprising<br />
some outstanding works, in particular from the Ottonian<br />
epoch (Figs. 1 & 2). A great number of significant works of art var-<br />
Figure 1:<br />
Otto-Mathilden-Cross,<br />
10th century,<br />
different materials,<br />
44.5 cm<br />
high, 29.5 cm<br />
wide (© Martin<br />
Engelbrecht).<br />
Figure 2: Child‘s Crown, made for Otto III., 10th century, different materials,<br />
e.g. gold sheets, jewels, and pearls (© Martin Engelbrecht).<br />
3d modellIng oF HerItage objects by FrInge ProjectIon and laser scannIng systems<br />
35
ying in size, shape, material, and complexity are to be measured.<br />
The artifacts provide more or less cooperative surfaces:<br />
a challenge for any measurement system. The 3D reconstruction<br />
is to be performed with high accuracy (0.1 to 1.0 mm, depending<br />
on the size of the object) at large scales (1:1 to 1:5).<br />
The paper overviews both the main objects of interest being<br />
among the treasure and the measurement systems or techniques,<br />
respectively, to be used for the recording. A chapter<br />
dealing with difficulties and drawbacks when digitizing artefacts<br />
is included. Finally, the state of the project as up to now<br />
is reported on.<br />
Measurement Systems<br />
“We can safely say that at the moment, for all types of objects<br />
and sites, there is no single modeling technique able to satisfy<br />
all requirements, like high geometric accuracy, portability,<br />
full automation, photorealism, low costs as well as flexibility<br />
and efficiency.” (Remondino & El-Hakim, 2006)<br />
The authors of this paper entirely confirm the above statement<br />
from their own practical experience. Therefore, several<br />
measurement techniques are proposed for the project<br />
➧ photogrammetry,<br />
➧ fringe projection technique,<br />
➧ laser scanning.<br />
Active sensors using fringe projection or laser technique<br />
accomplish the very fast and precise digitization of an object<br />
surface resulting in a dense 3D point cloud. The combination<br />
of image-based and range-based methods is appropriate to all<br />
tasks where a single technique by itself fails. So the structure<br />
of an object can be measured by photogrammetry, complex<br />
details of the object surface with a range sensor. Texture information<br />
for generating a realistic 3D model is provided by high<br />
resolution digital colour images.<br />
Subsequent to the point cloud generation, software is used<br />
for a topologically correct surface reconstruction, for texturing<br />
and visualization, in this case by means of the RapidForm and<br />
Geomagic software packages (Inus, 2007; Geomagic, 2007).<br />
Fringe projection systems<br />
about 0.2 mm when digitizing object surfaces. Base length<br />
and lenses can be changed to capture different fields of view.<br />
Calibration data and accuracy figures of the triTOS system<br />
were determined by test measurements published in a previous<br />
paper (Bange et al., 2007).<br />
A series of scans has to be generated to cover the complex<br />
artefacts, including a lot of detailed views to acquire more or<br />
less hidden regions, too. The single views can be combined<br />
within the triTOS software by a best fit approach based on iterative<br />
closest point algorithm (ICP). Moreover, a network of<br />
reference points precisely determined by photogrammetric<br />
means may serve to merge all the scans of the object captured<br />
with the range-based system. Furthermore, a Nikon D2Xs digital<br />
SLR camera was used to take colour images for texturing<br />
the 3D model.<br />
Laser scanning<br />
In addition to the fringe projection system, a laserscanner will<br />
be applied for point cloud generation. Laserscanners have<br />
been very expensive, but newly developed devices may change<br />
this situation. For example, the MicroScan laser sensor is a<br />
powerful but affordable measuring tool (RSI, 2007; Fig. 4).<br />
The scanner is connected to the MicroScribe measuring<br />
arm, i.e. it is attached to the stylus of the 6DOF MicroScribe.<br />
The portable MicroScribe + MicroScan combination provides<br />
an accuracy of approx. 0.2 mm within a reach of about 1.5 m.<br />
28.000 3D points per second are registered while the laser<br />
line is navigated over the object. The camera of the MicroScan<br />
records the deformations of the scanning line caused by shape<br />
variations of the object surface. Point clouds originating from<br />
different scans can be merged by the system software.<br />
In addition to the laserscanning, the MicroScribe measuring<br />
arm can also be utilized as a touch probe device for digitizing<br />
single 3D point positions.<br />
First results of laserscanner calibrations (by means of tools<br />
included in the system) and measurements show a good accordance<br />
with the specifications given by the manufacturer of<br />
the system. Further investigations have to be performed concerning<br />
calibration procedures, especially those defined by<br />
the German VDI/VDE guideline 2634 (VDI/VDE, 2002). An<br />
example of object scanning with MicroScan in comparison to<br />
an image taken with the Nikon camera is shown in Fig. 5.<br />
For the data acquisition of the treasure of the Essen cathedral<br />
mainly fringe projection systems have been applied so far. At<br />
the beginning of the project, a Breuckmann optoTOP<br />
HE-600 was used to digitize the Golden<br />
Madonna, the oldest known statue of Virgin<br />
Mary dating from around the year 990 A.D.<br />
(Peipe & Przybilla, 2005). Since then a Breuckmann<br />
triTOS has been employed (Fig. 3;<br />
Breuckmann, 2007). The system consists of a<br />
mechanically stable base connecting a 1.3<br />
megapixel camera and the fringe projection<br />
unit, and a high-end PC or notebook with the<br />
operating and object reconstruction software.<br />
The triangulation angle of the system amounts<br />
to 20 degree leading to a medium accuracy of Figure 3: triTOS fringe projection system.<br />
36 <strong>CIPA</strong> <strong>HERITAGE</strong> <strong>DOCUMENTATION</strong> BEST PRACTICES AND APPLICATIONS Series I, 2007 & 2009
Figure 4: MicroScan + MicroScribe during calibration.<br />
State of the Project<br />
As mentioned in chapter 2, the Golden Madonna of the cathedral’s<br />
treasure was digitized and modeled at first. In the meantime,<br />
some more works of art have been surveyed (Figs. 6 & 7):<br />
➧ the so-called Elfenbeinpyxis, an elliptical box (10.4 cm and<br />
12.5 cm in diameter, 8.8 cm high), made of ivory, originating<br />
from the 5th/6th century,<br />
Figure 6: Digitizing the Elfenbeinpyxis.<br />
Figure 7: Digitizing the ceremonial sword<br />
Figure 5:<br />
Scan (left) and<br />
digital image<br />
(right).<br />
➧ the Ludgeruskelch, i.e. a ceremonial cup (12.2 cm high, 7<br />
cm diameter at the top), made of copper and gold, originating<br />
from the 10th century,<br />
➧ the scabbard of a ceremonial sword (94 cm in length),<br />
made from wood and covered by golden plates, originating<br />
from the 10th century.<br />
3d modellIng oF HerItage objects by FrInge ProjectIon and laser scannIng systems<br />
37
Table 1:<br />
Specifications of<br />
data acquisition.<br />
Figure 8:<br />
Detail of the Elfenbeinpyxis<br />
after reducing polygons.<br />
These objects are very different in size, structure and<br />
material. Therefore, the digitizing is complicated and<br />
time-consuming. Some difficulties appear in case of<br />
➧ reflections, especially when capturing glittering material<br />
(gold etc.)<br />
➧ more or less transparent materials (gems etc.)<br />
➧ complex surfaces providing hidden parts.<br />
Specifications of the data acquisition can be found in<br />
Table 1.<br />
Data Processing and Visualization<br />
Visualization of complex object structures cannot be<br />
done by common computer aided design programs.<br />
Tools like those used for reverse engineering and rapid<br />
prototyping have to be applied to transform scan data<br />
into accurate digital models. Favourable results could be<br />
achieved with Geomagic Studio (Geomagic, 2007). This<br />
software package includes features such as<br />
➧ point processing (data filtering, noise reduction),<br />
➧ polygon building,<br />
➧ curvature-based hole filling,<br />
➧ automatic edge sharpening,<br />
➧ surface smoothing,<br />
➧ texture mapping,<br />
➧ etc.<br />
Elfenbeinpyxis Ludgerus-Kelch Ceremonial sword<br />
Base length 50 mm 50 mm 300 mm<br />
Measuring distance 400 mm 400 mm 1000 mm<br />
Survey depth 90 mm 90 mm 180 mm<br />
Fixed sensor, object on turntable yes yes no<br />
Number of scans 36 85 83<br />
Measuring time 8 h 5 h 7 h<br />
Fitting by ICP during measurement additional 5 h additional 4 h<br />
Figure 9: Textured detail of the Elfenbeinpyxis<br />
(left: 25%, right: 1.5% of original polygons).<br />
A serious problem when digitizing and processing complex objects<br />
is the large amount of data, especially if the modeled artefact<br />
should be posted on the internet. Data reduction is an important issue.<br />
Fig. 8 presents a detail of the Elfenbeinpyxis, beginning (left)<br />
with the original resolution and, then, after reducing to 25% and<br />
3% of the primary data volume. Fig. 9 shows the same detail overlaid<br />
with photographic texture. Even a significant reduction of 3D<br />
38 <strong>CIPA</strong> <strong>HERITAGE</strong> <strong>DOCUMENTATION</strong> BEST PRACTICES AND APPLICATIONS Series I, 2007 & 2009
data is partly compensated by the overlaid texture.<br />
These experiences can be confirmed with the results of<br />
other artefacts (Fig. 10). Data processing using reverse engineering<br />
software seems to be suitable for modeling complex<br />
cultural objects (see Remondino & El-Hakim, 2006).<br />
Concluding Remarks<br />
3D data from different sources are suitable to establish a digital<br />
archive of the treasure of the Essen cathedral. Fringe projection<br />
systems have been successfully applied to generate<br />
3D models of several important and valuable works of medieval<br />
art. In addition, the combination of a touch probe digitizer<br />
and a laserscanner provides an adequate accuracy and a favourable<br />
price/performance ratio, and seems very promising<br />
for quick data collection of complex objects.<br />
Based on the geometrical reconstruction of the artefacts<br />
and additional information, multimedia processing is planned.<br />
In the near future, the data will be included in a 3D information<br />
system supporting any kind of art-historical activities and<br />
research, but also useful for the non-professional museum visitor<br />
interested in medieval art.<br />
References<br />
Bange, L., Peipe, J., Przybilla, H.-J., 2007. Genauigkeitsmaße eines<br />
Streifenprojektionssystems zur 3D-Objekterfassung. In: Photogrammetrie<br />
- Laserscanning - Optische 3D-Messtechnik. Wichmann,<br />
Heidelberg, pp. 116-122.<br />
Breuckmann, 2007. Product information optoTOP and triTOS. www.<br />
breuckmann.com (accessed 30 May 2007).<br />
Geomagic, 2007. Product information Geomagic software. www.geomagic.com<br />
(accessed 30 May 2007).<br />
Inus Technology, 2007. Product information RapidForm. www.rapidform.com<br />
(accessed 30 May 2007).<br />
Peipe, J., Przybilla, H.-J., 2005. Modeling the Golden Madonna. In:<br />
Proceedings <strong>CIPA</strong> 2005 XX Int. Symposium, Turin, Italy, ISSN<br />
1682-1777, pp. 934-936.<br />
Remondino, F., El-Hakim, S., 2006. Image-based 3D modeling.<br />
Photogrammetric Record, Vol. 21 Issue 115, pp. 269-291.<br />
RSI, 2007. Product information MicroScribe and MicroScan. www.<br />
rsi-gmbh.de (accessed 30 May 2007).<br />
VDI/VDE, 2002. VDI/VDE Guideline 2634. Beuth, Berlin.<br />
Figure 10. Detail of the ceremonial sword<br />
(left: 100%, right: 50% of original polygons).<br />
3d modellIng oF HerItage objects by FrInge ProjectIon and laser scannIng systems<br />
39
ABSTRACT<br />
There exists a very large number of damaged buildings in Cultural<br />
Heritage. Common damages are related with structural deformations<br />
(lack of verticality, crashes, e.g.) and the degradation of<br />
their support (deteriorated materials, e.g.). A dense information<br />
is needed for both of them. Non-intrusive methods based on laser<br />
scans provide 3D support with dense information with low<br />
human cost. In this work, special attention is paid to structural<br />
deformations.<br />
The software platform UVACAD has been developed for solving<br />
visualisation issues relative to sub-clouds of points extracted<br />
from the global model. Interactive visualization concerns basic<br />
projective operations (sections and projections), cell decomposition<br />
and colour re-projection of the global 3D model. Slices with<br />
constant width and extracted by means of parallel planes have<br />
provided support for a semi-automatic drawing of<br />
sections drawn over the exported slices after their<br />
ortho-projection. Structural damages can then be<br />
visualised in a transparent way by overlapping the<br />
exported ortho-images. These results are illustrated<br />
with an example taken from the gothic church of Villamorón<br />
(Burgos, Spain). The performed 3D model<br />
has proven to be an accurate survey which has allowed<br />
the assessment for an urgent intervention<br />
policy to correct serious damages observed in this<br />
study.<br />
Introduction<br />
Evaluation of structural damages<br />
from 3d laser scans<br />
J.I. San José 1 , J. Martínez 1 , J.J. Fernández 1 , J. Finat 2 , J.D. Perez-Moneo 2<br />
1. University of Valladolid, Laboratory of Architectural Photogrammetry, School of Architecture,<br />
Av. De Salamanca s/n 47014 Valladolid. jmr@ega.uva.es<br />
2. University of Valladolid, MoBiVAP research group, I+D building, lab2.2, Campus Miguel Delibes.<br />
47011 Valladolid. jfinat@agt.uva.es, juandi@ega.uva.es<br />
Due to the abandon of small villages and the lack<br />
of economic resources, the current state of Cultural<br />
Heritage buildings in rural zones show a poor<br />
state of conservation, which makes it very difficult<br />
to carry out any global intervention. Thus, some-<br />
times it is only possible to make a detailed study of the structure<br />
to prevent further damages. Despite the fact that Castilla<br />
y León is one of the the European regions with the lowest density<br />
of population, it contains more than fifty per cent of the<br />
Spain’s Cultural Heritage.<br />
Unfortunately, the high number of damaged buildings and<br />
the limited budget makes it very difficult to design a global policy<br />
of conservation or restoration. Thus, before its collapse it is<br />
imperative to make a structural diagnosis and a thorough digitization<br />
of damaged buildings. Exchange of research experiences<br />
is crucial to compare and improve our current state of<br />
knowledge, and to try to coordinate a future development of<br />
restoration and conservation policies. Some recent developments<br />
can be read in [Dequal 2005].<br />
Figure 1: One among hundreds of ruined CH goods in Castilla y León.<br />
evaluatIon oF structural damages From 3d laser scans<br />
41
Common photogrammetric records are based on imagery<br />
and total stations. Planning of network for acquisition and data<br />
capture are time consuming; furthermore, post-processing<br />
work for image-based architectural surveying is tedious and<br />
requires a very high level of expertise. However, 3D laser scanners<br />
have proved to be more efficient in three-dimensional<br />
dense modelling. Although the local accuracy of measurements<br />
taken with robotized total stations is higher, laser-scanner<br />
surveys are often more appropriate for urgent interventions<br />
as they provide massive 3D volumetric information. Information<br />
processing provides metric data which are very useful to<br />
support conservation and restoration policies.<br />
Since the 2001 edition of <strong>CIPA</strong>, there has been a very<br />
large number of works published, focusing on the laser scanner<br />
and its application to heritage recording subject. [Boehler<br />
(2002), Malinverni (2003)].<br />
On the other hand, a large number of developments in<br />
Computer Graphics and Machine Vision for complex rendering<br />
of historical buildings have been performed along the last ten<br />
years. Modern scientific visualization offers the possibility to<br />
inspect and evaluate structural properties of buildings and<br />
other information relative to their environment. Thus, it is necessary<br />
to develop multi-resolution and hybrid approaches for<br />
architectural and environmental surveying (see e.g. El-Hakim<br />
et al, 2002). The development of interoperability tools between<br />
Surveying and Information Systems, including advanced<br />
visualization techniques models is the next challenge<br />
to face. Advanced Visualization must allow the exchange,<br />
processing and analysis of metric information with object-oriented<br />
data and metadata bases relative to the information<br />
with a 2D/3D support.<br />
For dealing with such a massive data source, it is necessary<br />
to combine volumetric segmentation with 3D matching to different<br />
level-of-detail (LoD). This combination provides a semiautomatic<br />
identification of primitives appearing in buildings for<br />
each LoD. The coarsest level of the hierarchy involves the identification<br />
of geometric elements (dominant planes, quadrics,<br />
e.g.) whereas the finest level deals with complex primitives (or-<br />
Figure 2: Scanning the Church of Santiago outdoors and indoors.<br />
namental details, pinnacles, ledges, sculptures, e.g.). The automatic<br />
identification of complex primitives from basic geometric<br />
primitives is still a challenge for semi-automatic 3D recognition<br />
and modelling with a large number of applications to CAD,<br />
Architectural or Archaeological Surveying, computer animation<br />
and simulation, including VR/AR, among others.<br />
Currently, the LFA-MoBiVAP research group is developing<br />
information systems for Cultural Heritage Recording by means<br />
of advanced visualization systems. Post-processing of 3D information<br />
arising from sampling of huge clouds of points makes it<br />
possible to compare the current state of certain areas with their<br />
simple planar and quadratic primitives. Multi-resolution models<br />
have been applied in the visualization and virtual reconstruction<br />
of archaeological sites; examples of these are the<br />
analysis and ideal reconstruction of the roman theater of Clvnia<br />
(Burgos, Spain) as illustrated in [Finat et al 2005] and an<br />
extension for urban environments, in [Fernandez, 2006].<br />
The main goal of this work is to contribute to the semi-automatic<br />
3D modelling and design of architectural primitives<br />
corresponding to damaged buildings from range data files<br />
from scanning. To achieve this goal, simpler PL-models (piecewise<br />
linear) are generated from huge unorganized clouds of<br />
points captured with the laser scanner Ilris 3D (Optech). Sections<br />
of the point-clouds (understood as equispaced slices<br />
with constant width) and projections of selected ones onto reference<br />
planes are the result of the performed projective operations.<br />
These partial intermediate models are obtained with<br />
low computational cost and they are enough to identify coarse<br />
structural damages before urgent interventions.<br />
Methodology<br />
According to the methodology planned the steps performed in<br />
this and other precedent works is resumed as follows:<br />
1. Data capture and construction of a global model by means<br />
of multiple scans alignining.<br />
2. Global orientation of the model using ground control<br />
points. A high precision levelling traverse has been done.<br />
42 <strong>CIPA</strong> <strong>HERITAGE</strong> <strong>DOCUMENTATION</strong> BEST PRACTICES AND APPLICATIONS Series I, 2007 & 2009
3. Extraction of a regular sequence of longitudinal and transversal<br />
sections linked to point cloud slices small enough<br />
(in file size terms) to be exported to CAD models.<br />
4. Re-projection of some selected of the sections on a common<br />
reference plane.<br />
5. Interactive drawing of vector section onto 2D projected<br />
slices.<br />
6. Inspection and dimension of elementary symmetries for<br />
longitudinal or transversal sections.<br />
7. Quantification of deformations by comparison between actual<br />
and ideal sections.<br />
8. Inspection and conclusions report.<br />
All these steps are illustrated with examples extracted<br />
from the Gothic church of Villamorón (Burgos, Spain).<br />
Current State<br />
The church of Santiago shows some structural problems some<br />
of which are probably derived from interventions during the<br />
transition from Romanesque to early Gothic style. Indeed, the<br />
central nave may be too high compared to the side aisles;<br />
some certainly evident misalignments in columns along the<br />
transept produce strong alterations in the structure with visible<br />
crashes in the tower. This work is aimed at the identification<br />
of deviations with respect to vertical for walls and mis-<br />
Figure 3: Two views from<br />
south-west and north<br />
showing severe damage.<br />
Figure 4: Ashlars falling,<br />
vaults, archs and wall<br />
cracks, water flow…<br />
evaluatIon oF structural damages From 3d laser scans<br />
43
alignments for columns, their quantification and the<br />
analysis of crashes and structural failures in the global<br />
3D model.<br />
The western facade shows an evident list, which is<br />
responsible for two large crashes across the wall, from<br />
roof to ground. In the eastern end of the temple, there<br />
appear severe crashes along windows which threaten<br />
the stability of its structure. Inside, the vaults are apparently<br />
full of cracks and a considerable number of ashlar<br />
blocks have fallen from the arches.<br />
Crashes are also evident on the other end of the central<br />
nave, where lateral walls are literally detached from<br />
the roof. A large number of fractures also appear in the<br />
startings of arch nerves with the walls.<br />
Data Capture and Global Model<br />
In order to ensure a common general reference for the<br />
model, the scans are registered to a network of control<br />
points both in the exterior and interior of the church. Up<br />
Figure 6:<br />
Levelling<br />
traverse and<br />
side shots.<br />
Figure 7:<br />
Prof. San José<br />
as rodman.<br />
Figure 5:<br />
A crack from<br />
ground to roof<br />
in the bell tower.<br />
44 <strong>CIPA</strong> <strong>HERITAGE</strong> <strong>DOCUMENTATION</strong> BEST PRACTICES AND APPLICATIONS Series I, 2007 & 2009
to thirty level references have been surveyed with an automatic<br />
level Pentax AL320.<br />
Not having the x,y coordinates of the reference points may<br />
seem to be quite imprecise but the points we took were on<br />
near flat surfaces which are easy to locate with the help of a<br />
sketch or picture. Some of them have been taken with the rod<br />
up-side-down because it is easier to identify those being<br />
above the scanner than other on the ground which was irregular<br />
and may be hidden by plants.<br />
All of those levelled points were used for the absolute orientation<br />
of the model with the RMS of the being below<br />
0.002m for the vertical adjustment.<br />
The 145 scans covering the most of the inner and outer<br />
surfaces of the church where registered simultaneously with<br />
the help of a dedicated application Polyworks by Innovmetric<br />
which has demonstrated to be pretty capable for such as complex<br />
task. (by the time this work was done, the aligning algo-<br />
Figure 8: The final polygonal model of the outside skin.<br />
Figure 9: Vaults model registered to exterior.<br />
rithm was not yet implemented in our own developed software<br />
UVACAD).<br />
More comprehensive data, where needed to record the<br />
temple’s interior. They provide a global model of the vaults and<br />
roof. The relationship between the outer model and the inner<br />
one was possible thanks to the care taken while scanning the<br />
main entrance of the church from the outside. Some pillars<br />
and walls were captured from the exterior scans allowing to<br />
register the two models together.<br />
A correct orientation and level allows the selection of a reference<br />
system given by a trihedral associated to ideal symmetric<br />
planes. The origin of this reference system has been<br />
placed at the intersection of the building axes at ground level.<br />
Thus it is possible to obtain three-parametric families of<br />
planes which are pair wise orthogonal between them.<br />
Interestingly, during the process, we found that some modes<br />
of visualisation of the point cloud rendered as an extraordinary<br />
evaluatIon oF structural damages From 3d laser scans<br />
45
Figure 12:<br />
Longitudinal view<br />
of the church.<br />
Figure 10: The two families of parallel sections are defined by building main axes.<br />
Figure11:<br />
Transversal image<br />
of the point cloud.<br />
46 <strong>CIPA</strong> <strong>HERITAGE</strong> <strong>DOCUMENTATION</strong> BEST PRACTICES AND APPLICATIONS Series I, 2007 & 2009
Figure 14: The floor plan appears plastic-like deformed.<br />
way of highlighting some significant structural damages. In the<br />
next two images is showed how well 2D image files obtained by<br />
means of projection of the clouds and some further image<br />
processing give a short of radiography of the monument.<br />
Structural Deformations<br />
The main problems related to the identification and evaluation<br />
of structural deformations involves the principal directions for<br />
walls lean and the quantification of such a deviation. The absolute<br />
error bound is about 1 cm.. Independent analysis of<br />
transversal, longitudinal and horizontal sections has been performed..<br />
The distribution of deviations with respect to the vertical<br />
is not equally distributed across the building.<br />
Transversal sections<br />
A sample of transversal sections, makes it possible to verify<br />
that the main lean, ranging from 1.3 to 1.8 degrees corresponds<br />
to the exterior south façade.<br />
Figure 13: Inspection by cross sections. Dimensioning failures.<br />
Longitudinal sections<br />
As has been done with cross sections. The study of longitudinal<br />
sections shows that the maximum inclination is between 0.5<br />
and 2.8 degrees and corresponds to the exterior west facade.<br />
Horizontal sections<br />
The axis of the south wall of the church eastern end does<br />
present a discontinuity with respect to the axis of columns of<br />
the principal nave with a difference of 25 cm. The error originated<br />
in the transformation of the building from Romanesque<br />
to early Gothic style. In particular, pillar bases do not compose<br />
an exact orthogonal network but are displayed in different positions<br />
with angles of about 88º instead.<br />
Evaluation of structural deformations<br />
From a technical point of view, the identification and the quantification<br />
for the wall’s lean and misalignments presents two<br />
main orientations:<br />
One shown by the longitudinal axis of the principal nave<br />
towards the south wall; in the south facade the lack of verticality<br />
is maximum, and this affects also the wall which opens to<br />
the atrium.<br />
The other main gradient is showed by the wall which closes<br />
the feet of the temple<br />
Furthermore, the longitudinal axis evidences lack of continuity,<br />
with displacements along intermediate components.<br />
Some pillars present displacements towards the south, which<br />
could be the origin of the largest cracks and the critical state<br />
of conservation of the building.<br />
The most outstanding list affects some parts of the south<br />
wall where some vestiges of Roman cisternae have been identified.<br />
With the top side being 38 cm displaced from the vertical<br />
in 316 cm of height, resulting in a dangerous inclination<br />
of 6.72 degrees.<br />
evaluatIon oF structural damages From 3d laser scans<br />
47
Contribution to the Heritage.<br />
Conservation and Protection.<br />
Conclusions and Future Work<br />
As a resume, the whole structure is far from being stable. Indeed,<br />
recent corner ashlars falls and the fractures that are<br />
growing in the basement (possibly due to water filtration from<br />
an identified the Roman cisternae close to the church west)<br />
threaten to collapse the building totally or partially in the near<br />
future if there is no intervention. Fortunately, as a result of this<br />
work, some consolidation interventions have recently been executed.<br />
In this work we have developed a hybrid image- and rangebased<br />
methodology for an accurate evaluation of structural<br />
damages of buildings. This will surely be a positive contribution<br />
in the field of Cultural Heritage Conservation. The volumetric<br />
analysis performed clearly shows the effects and, consequently,<br />
helps to identify the causes of structural damages.<br />
Hence, it contributes in a decisive way to the assessment in<br />
the design and application of restoration policies. Still, there<br />
is much work to be done. Some of this, for which we are developing<br />
specific tools, such as 1) software aimed at facilitating<br />
the identification of damages to materials (i.e: state of<br />
walls, based in texture analysis), 2) the integration of basic geometric<br />
elements (piecewise dominant planes linked to walls<br />
and piecewise quadratic elements linked to vaults and dome),<br />
or 3) the identification of structural elements and software<br />
tools for Structural Analysis.<br />
Acknowledgements<br />
The authors acknowledge to the CICYT Project MAPA (Modelos<br />
y Algoritmos para el Patrimonio Arquitectónico) of the Ministry<br />
of Education and Culture for their partial financial support.<br />
References<br />
<strong>CIPA</strong>2001: Surveying and Documentation of Historical Buildings-<br />
Monuments-Sites. Traditional and Modern Methods, <strong>CIPA</strong> Intl<br />
workshop (Potsdam, Germany), 2001.<br />
Dequal, S., 2003: “International Cooperation to Save the World’s<br />
Cultural Heritage”, The Intl. Archives of the Photogrammetry ,<br />
remote sensing and spatial information sciences, Vol XXXVI,<br />
5/C 34, 2003.<br />
El-Hakim 2005, S, .Remondino, F., and Gonzo, L., eds: Virtual Reconstruction<br />
and Visualization of Complex Architectures, The<br />
Intl. Archives of the Photogrammetry , remote sensing and spatial<br />
information sciences, Vol.XXXVI, Part 5/W, 2005.<br />
Fernández 2006, J.J. et al: “Extended Digital models for planning<br />
and management of interventions in buildings and complex urban<br />
models”, 3rd Intl Conference on the Virtual City and the<br />
Territory, Bilbao (Spain), 2006.<br />
Finat, 2005 et al: “The Roman Theater of Clvnia (Burgos, Spain):<br />
Hybrid Strategies for Applying Virtual Reality on Laser Scanning<br />
3d files”, The Intl. Archives of the Photogrammetry , remote<br />
sensing and spatial information sciences}, Vol.XXXVI, Part<br />
5/W, 2005.<br />
E. Malinverni, ed, 2003: “Vision Techniques for Digital Architectural<br />
and Archaeological Archives”, The Intl. Archives of the Photogrammetry,<br />
Remote sensing and Spatial Information Sciences,<br />
Vol.XXXIV, 2003.<br />
SanJosé, J.I. et al, 2006: “Risk Analysis and Diagnosis of Damaged<br />
Structures in Historical Buildings: Strategies for Assessment<br />
and Intervention”, Proc. Intl Conf. and Brookerage event “Constructive<br />
Research Needs for the Heritage Protection”, Cavtat<br />
(Croatia), 2006.<br />
48 <strong>CIPA</strong> <strong>HERITAGE</strong> <strong>DOCUMENTATION</strong> BEST PRACTICES AND APPLICATIONS Series I, 2007 & 2009
ABSTRACT<br />
In this paper a CAD application embedding photogrammetric<br />
procedures is described. Oleg Kolbaskin has originally created<br />
the CAD application and the photogrammetric procedures were<br />
implemented in the Department of Architectural Engineering of<br />
our Institute. The software can be used from both novice and experienced<br />
users in order to provide rectified images for cultural<br />
heritage documentation in the best quality using appropriate calibration<br />
and monoscopic image processing algorithms. Since it<br />
is based on a CAD environment further restitution and drafting<br />
can be followed in order to provide the 2D top view plans and facades’<br />
plans of sites and buildings. The original images are calibrated<br />
and corrected using an advanced image processing software<br />
procedure that provides the final images to be rectified. The<br />
rectified images may be then produced using either the classical<br />
digital rectification algorithms of the central projection solution or<br />
the perspective geometry solution (geometry correction based on<br />
the determination of vanishing points).<br />
Problem Statement<br />
Simple Tools<br />
for Architectural Photogrammetry<br />
V. Tsioukas<br />
Department of Architectural Engineering, The Democritos University of Thrace,<br />
New Building of Central Library, Kimmeria 67100, Xanthi, Greece, vtsiouka@arch.duth.gr<br />
One of the main tasks of the Architects’ profession is in the<br />
field of Architectural Conservation and Restoration of Buildings<br />
and important Cultural Heritage Monuments (archaeological<br />
sites, excavation sites, traditional settlements, urban complexes<br />
of high historic value, etc).<br />
The expertise, an Architectural Engineer should have in order<br />
to have the ability to accomplish the hard task of a restoration,<br />
should include special knowledge on modern recording<br />
techniques since they will help him to prepare a proper documentation.<br />
The results of the documentation project will lead<br />
to the final restoration study of the building. The appropriate<br />
techno-economical study will give the best profit result of the<br />
restoration.<br />
A basic tool for the creation of the digital recording files of<br />
top-views, section and facade plans for the documentation of<br />
a building is a CAD software application. For the recording of<br />
flat vertical facades, the procedure of digital photogrammetric<br />
rectification has been applied with great success in several<br />
cases in the past (Dallas, 1996).<br />
AutoCAD by AutoDesk, the well-known digital design and<br />
drafting application, is the most common software tool found<br />
in an Architect’s office. It has been used with great success<br />
for the creation of 2D designs and 3D models of buildings.<br />
Although, the basic version is embedding some raster<br />
processing algorithms it does not include photogrammetric<br />
processing modules. For that reason, most of the owners of<br />
an AutoCAD software license are using an add-on module to<br />
create rectified images and mosaics of buildings’ facades<br />
(Colorview GIS ImageRectifier by Peak Geo-Design, Inc.; EL-<br />
COVISION by PMS Photo-Mess-Systeme AG; PhoToPlan by<br />
kubit GmBh; SUPER/IMPOSITION by Datem). In other cases,<br />
the users prefer to use standalone raster processing applications<br />
to create the rectified images, which are later inserted<br />
in the AutoCAD environment to produce the final restitution<br />
designs.<br />
Similar applications exist also as add-on modules for the<br />
Bentley’s Microstation CAD application (Intergraph’s IRAS/C<br />
and Bentley’s Descartes). The Microstation application has<br />
been widely used from several recorders in the past.<br />
In the past, some researchers have developed their own<br />
non-commercial applications in order to rectify digital images<br />
in architectural recording projects. Their aim was mainly to<br />
create the appropriate tools equipped with all the necessary<br />
features to accomplish their heavy research tasks and not to<br />
merchandize their applications.<br />
sImPle tools For arcHItectural PHotogrammetry<br />
49
Technological Approach<br />
Photogrammetric rectification<br />
The most of the applications that create rectified images,<br />
coming from either conventional or metric cameras, are using<br />
the projective transformation equations to define the relation<br />
between the film or digital sensor plane and the recording<br />
plane of a building’s facade. In this case, the building’s facade<br />
is considered flat and the low relief (if present) is assumed to<br />
produce negligible deformation on the final rectified image.<br />
The observation-measurements of at least four ground control<br />
points (predefined and topographically measured) on the image<br />
will lead to a solution of the unknown parameters that is<br />
connecting every point of the facade onto its digital image.<br />
The rectified image is finally generated through a resampling<br />
process.<br />
The advantages of the method are:<br />
➧ Quality control. By using more than the four minimum control<br />
points and through the statistical analysis it is possible<br />
to estimate the mean error and standard deviation of the<br />
produced rectified image. Adjustment is providing the optimal<br />
solution of the rectified image.<br />
➧ The connection of every point on the rectified image to the<br />
local coordinate system is feasible. The local coordinate<br />
system is implemented with the use of a common Total Station<br />
used to define the control points’ location on the building’s<br />
facades.<br />
➧ It is a fast and easy process.<br />
➧ It is leading to a complete digitisation, if the rectified image<br />
is used properly in a CAD environment.<br />
In the case where it is not possible to measure ground<br />
control points on the building’s facade (due to the inability to<br />
access the building, or if the image has been created from an<br />
old photograph scanning) the definition of the vanishing points<br />
on the image, through the collection of parallel horizontal or<br />
vertical lines, can determine the position of the camera in relation<br />
to the building’s facade locus (Karras, 1992). A similar<br />
product as the rectified image is generated. However, it lacks<br />
the quality control provided from the typical digital rectification<br />
process since no redundant control point measurements<br />
exist. No adjustment is applicable and only a couple of distance<br />
measurements can be used to calculate the final rectified<br />
product. The measurements that are used are horizontal<br />
and vertical distances that provide the correct scale of the rectified<br />
image (Karras, 1992; Fangi, 2001).<br />
However, the advantages of the method are the same as in<br />
the previous case of a rectified image using ground control<br />
point measurements. Additionally:<br />
➧ No complicated measuring devices and topographic networks<br />
are necessary.<br />
➧ They provide a rectified image product in a very short time.<br />
However, the users of this photogrammetric procedure<br />
might not or do not want to have any knowledge of photogrammetric<br />
theory.<br />
Figure 1: The rectified image was produced using control points measurements. In the lower right corner of the drawing space a magnifier window is displaying,<br />
in zoom, the region aground the cursor.<br />
50 <strong>CIPA</strong> <strong>HERITAGE</strong> <strong>DOCUMENTATION</strong> BEST PRACTICES AND APPLICATIONS Series I, 2007 & 2009
Our approach<br />
In the teaching process of courses concerning digitization, recording<br />
and restitution of buildings’ facades using surveying<br />
techniques and Photogrammetry, common commercial CAD<br />
applications have been used in our Department. The computers<br />
in the laboratories of our Department are equipped with the<br />
appropriate commercial applications to produce rectified images<br />
and are able to provide digital 2D designs of buildings’ facades.<br />
However, the software licenses in the laboratories do<br />
not cover the elaboration of recording projects away from the<br />
university facilities. The students have the need to execute the<br />
photogrammetric and CAD applications on their personal computers<br />
at home. This need has lead the author to develop a<br />
software application that will have the ability to provide digital<br />
rectified images using both the previously mentioned techniques<br />
and is free of charge to be used by anyone (student or<br />
not) for non-commercial applications and projects (educational<br />
and research purposes).<br />
The software has been based on the source code of VeC-<br />
AD, provided by Oleg Kolbaskin and is comprising of a full<br />
CAD application. The contribution of the author was to embed<br />
all the photogrammetric processes to produce the rectification<br />
of a central projection image, using ground control point measurements<br />
(figure 1) or vanishing point geometry correction (figure<br />
2). Many of the features of the CAD environment are very<br />
similar to the ones of the common commercial applications.<br />
Another application has been developed by the author to<br />
contribute in the best possible way to the creation of the most<br />
appropriate photogrammetric results. Since, the images that<br />
are processed are mainly coming from typical commercial digital<br />
cameras (i.e. student cameras) the low quality of their<br />
lenses are generating great radial distortion errors (figure 3a).<br />
The image calibration application, that has been developed, is<br />
used to calculate the radial distortion parameters according to<br />
the Beyer model (Beyer, 1992). Prior to the use of the camera<br />
the user is taking a snapshot of an A4 printed targets page (of<br />
circular shape) that are automatically identified and defined<br />
accurately on the image using a best fitting ellipse algorithm.<br />
Additionally, commercial software applications such as Photomodeler<br />
can be used to provide the camera calibration parameters<br />
that will be used to create the corrected images (http://<br />
www.photomodeler.com/index.htm). Using a resampling and<br />
filtering image processing procedure, every image generated<br />
through the specific camera is then corrected (figure 3b)<br />
(Sechidis, 1999).<br />
Potential Use<br />
The proposed software application can be used free of<br />
charge from any Cultural Heritage Recorder that wish to provide<br />
for non commercial purposes, rectified images and digitised<br />
drawings of buildings facades and other planar surfaces.<br />
The program is not a commercial application and thus no<br />
fee is charged for its use. It can be downloaded from the personal<br />
website of the author http://utopia.duth.gr/~vtsiouka/<br />
VeCAD-Photogrammetry/. Inside the downloadable zipped<br />
file,<br />
Figure 2: Original (left) and rectified (right) images processed in the CAD Environment. The rectified image was produced using vanishing points geometry.<br />
sImPle tools For arcHItectural PHotogrammetry<br />
51
Figures 3a and 3b:<br />
Radial distorted<br />
and corrected<br />
control images.<br />
➧ the software application executables and the necessary<br />
setting files,<br />
➧ instruction’s manuals in Greek and English language,<br />
➧ sample images and surveying data and<br />
➧ demonstration videos<br />
are included.<br />
This information will give a first guide and demonstrate the<br />
use of the program to any potential user.<br />
Contribution to the Heritage<br />
Conservation and Protection<br />
The author has developed a software module and a calibration<br />
software application to support the teaching and research activities<br />
in the Department of Architectural Engineering of the<br />
Democritos University of Thrace. The application is able to<br />
provide rectified images using typical photogrammetric processes<br />
in a CAD environment featuring:<br />
➧ No cost (but only for non-commercial applications)<br />
➧ Low hardware demands<br />
➧ Ease of use for an experienced CAD user.<br />
The main aim of this research activity was the wide spreading<br />
of photogrammetric image processing practice especially<br />
for the recording purposes of buildings and sites, by an Architect,<br />
an Archaeologist or a Surveying Engineer.<br />
References<br />
Beyer, H., 1992, Ph.D. Thesis: “Geometric and Radiometric Analysis<br />
of a CCD-Camera Based Photogrammetric Close-Range<br />
System”<br />
Dallas, R.W.A., 1996, Architectural and archaeological photogrammetry.<br />
In Close Range Photogrammetry and Machine Vision, K.<br />
B. Atkinson (ed.), Wittles Publishing, Caithness, pp. 283-302<br />
Fangi, G., Gagliardini, G., Malinverni, E.,S., 2001, Photointerpretation<br />
and Small Scale Stereoplotting with Digitally Rectified<br />
Photographs With Geometrical Constraints, Cipa 2001 XVIII International<br />
Symposium, Potsdam, Germany<br />
Nickerson, S., Chapiro, A., 2005, ASRix : A Simple Digital Image<br />
Rectifier, <strong>CIPA</strong> 2005 XX International Symposium, Torino, Italy<br />
Karras, K., Petsa, E., 1992, The use of perspective in uncalibrated<br />
images for the documentation of the fa cades of historic buildings<br />
without control. Terrestrial Photogrammetry and Spatial<br />
Information Systems for the Documentation of Cultural Heritage.<br />
Ziti Editions, Thessaloniki, Greece, pp. 199-212 (in<br />
Greek).<br />
Sechidis, L., Georgiadis, C., Patias, P., 1999, Transformations for<br />
“Calibrated image” creation using camera reports and distortion<br />
models. ISPRS Vol XXII Part 5W11, Workshop “Photogrammetric<br />
measurement, object modeling and documentation<br />
in architecture and industry”, Thessaloniki, Greece, 7-9 July,<br />
1999. pp 215-219.<br />
Streilein, A., 1991, Development of a Digital System for Architectural<br />
Photogrammetry.<br />
52 <strong>CIPA</strong> <strong>HERITAGE</strong> <strong>DOCUMENTATION</strong> BEST PRACTICES AND APPLICATIONS Series I, 2007 & 2009
3<br />
Best Practices and Applications<br />
(2009)<br />
5.1 Introduction<br />
The following seven papers are presented as “Best Practices and Applications” in the next pages.<br />
The selection is based on the papers presented to the <strong>CIPA</strong> Symposium in Kyoto (2009).<br />
1. Application of a low cost laser scannerfor archaelogy in Japan<br />
(Akihiro Kaneda)<br />
2. A study on the gps tracking analysis for information management on heritage site<br />
(S. Kim, J. Kim)<br />
3. Multispectral image analysis for bas-relif at the inner gallery of bayon temple<br />
(T. Morimoto, M. Chiba, Y. Katayama, K. Ikeuchi)<br />
4. Introducing EDM survey for recording vernacular heritage and sites in Pakistan<br />
(Salman Muhammad)<br />
5. 3D model of gedongsongo templeand topography using terrestrial laser<br />
scanner technology<br />
(Adi J. Mustafa, Fahmi Amhar)<br />
6. Digital Construction for Spatial Documentation of Beijing Old City<br />
(Ruoming Shi, Guang Zhu, Ling Zhu, Ruiying Wang, Yuqing Mu)<br />
7. Laser scan documentation and virtual reconstruction of the Buddha figures<br />
and the archaeological remains (Bamiyan)<br />
(G. Toubekis, I. Mayer, M. Döring-Williams, K. Maeda, K. Yamauchi,<br />
Y. Taniguchi, S. Morimoto, M. Petzet, M. Jarke, M. Jansen)<br />
53
ABSTRACT<br />
In order to use three-dimension data collection in archaeological<br />
studies, it is necessary to establish realistic and feasible methods.<br />
This report presents our recent trial in Japanese archaeology.<br />
Three-dimensional documentation methods have begun to be<br />
used in Japanese archaeology. However, these methods are generally<br />
expensive. Three-dimensional documentation for archeological<br />
studies needs not so much use a highly technical or expensive<br />
technology as a realistic and feasible method for documenting<br />
artefacts. Therefore, we have experimented in low-cost<br />
three-dimension documentation methods for archaeology. Several<br />
photogrammetric and laser-scanning tools were tested. The<br />
NextEngine Desktop 3D Scanner Model 2020i (NextEngine,<br />
Inc.) yielded particularly good results for pottery and roof-tile artefacts.<br />
Point clouds data are able to transform and delete easily.<br />
These data export a three dimensional drawing with a traditional<br />
information. These works show several effects and problems<br />
with scanning archaeological artefacts. Most archaeologists<br />
in Japan are unable to use three-dimensional data effectively. We<br />
have to grope for how to use such data to classify and analyze artefacts.<br />
Furthermore, three-dimensional models of archaeological<br />
artefacts should be made accessible to the public on-line,<br />
and in museums.<br />
Key words: Low cost laser scanning, NextEngine, Traditional<br />
drawing, Heijyo Capital Site, Nara.<br />
Introduction<br />
Aim of this report<br />
Application of a low cost laser scanner<br />
for archaelogy in Japan<br />
Akihiro Kaneda<br />
Independent Administrative Institution, National Institutes for Cultural Heritage, Nara National Research Institute<br />
for Cultural Properties. 2-9-1 Nijyo-cho, Nara-shi, JAPAN. akaneda@nabunken.go.jp<br />
The purpose of this report is to demonstrate a low-cost threedimensional<br />
documentation method in Japanese archaeological<br />
studies.<br />
Japanese archaeologists have conducted several archaeological<br />
excavations in recent years.<br />
Most of these excavations are rescue excavations and according<br />
to the Agency for Cultural Affairs, more than 9500<br />
such excavations were conducted in 2006.<br />
Due to the nature of rescue excavations, however, the resulting<br />
archaeological records are difficult to use effectively.<br />
In addition, the budget for such excavations is limited.<br />
A great deal of time and resources (both budgetary and<br />
human) are spent on making traditional drawings of the uncovered<br />
artefacts in the present situation.<br />
Recently, three-dimensional documentation methods have<br />
begun to be used in Japanese archaeology.<br />
However, these methods are generally expensive. It has<br />
not yet been possible to utilize the advantages of this new<br />
technology for archaeological studies.<br />
Undoubtedly, Japanese archaeologists are eager to achieve<br />
a solution to the current problem – that is, to have access to<br />
more-economical and accessible tools.<br />
Three-dimensional documentation for archeological studies<br />
needs not so much use a highly technical or expensive<br />
technology as a realistic and feasible method for documenting<br />
artefacts.<br />
It is important to compare the new methods with the old,<br />
such as hand drawing, photography, and rubbing (which is a<br />
traditional recording method used in Asian countries). For example,<br />
we must ensure that the employment of new methods<br />
for documenting artefacts does not result in the loss of essential<br />
information that has been captured in the past using old<br />
methods.<br />
Nabunken (Independent Administrative Institution, National<br />
Institutes for Cultural Heritage, Nara National Research<br />
Institute for Cultural Properties) has experimented in<br />
low-cost three-dimension documentation methods for archaeology.<br />
aPPlIcatIon oF a low cost laser scanner For arcHaelogy In jaPan<br />
55
Related Work<br />
Recently, low-cost three-dimensional documentation methods<br />
for historical heritage have been in the spotlight.<br />
Low-cost scanning equipment was examined for effectiveness<br />
in documenting archaeological artefacts (Lesk, 2007;<br />
Shear, 2008). The NextEngine scanner was reviewed by archaeologists<br />
(Abernathy, 2007). DAVID Laser scanner supplies<br />
a simple scanning tool for public use (http://www.davidlaserscanner.com).<br />
UCSD CISA3 project prosecute Digital Pottery Informatics<br />
with low-cost laser scanner (CISA3, 2009). They archive the<br />
digital Iron Age ceramics’ data using NextEngine scanner.<br />
Useful Open Source Software has been developed, such as<br />
Meshlab (http://meshlab.sourceforge.net/), Blender (http://<br />
www.blender.org/), and AutoQ3D (http://autoq3d.ecuadra.<br />
com/).<br />
The ARC 3D Web service provides an online three-dimensional<br />
modelling tool (http://homes.esat.kuleuven.be/~konijn<br />
/3d/).<br />
Methods and Results<br />
Methods<br />
Several photogrammetric and laser-scanning tools were tested.<br />
The NextEngine Desktop 3D Scanner Model 2020i (NextEngine,<br />
Inc.) yielded particularly good results for pottery and<br />
roof-tile artefacts. (These types of artefacts are common in<br />
Japanese archaeological sites.) The NextEngine Scanner is a<br />
low-cost laser scanner costing less than $3,000, including<br />
turntable and software (figure 1).<br />
First, pottery fragments and roof tiles excavated at the Heijyo<br />
Capital site (one of the ancient capitals of Japan) were<br />
scanned using this scanner. All artefacts were scanned in wide<br />
mode (dimensional accuracy is ±0.381 cm/±0.015 inch).<br />
Each piece of scanned data was trimmed, and unified using<br />
Align and Fuse command at the ScanstudioHD with RGB<br />
texture.<br />
Point clouds data were exported to .STL and .OBJ formats.<br />
These data were converted to PDF (PDF-E) file format by Acrobat3D<br />
ver.8.0 (Adobe Systems, Inc.).<br />
It is possible to display this PDF file as an orthography projection<br />
or a perspective projection under various kinds of lighting<br />
conditions.<br />
In addition, to create a bridge between the traditional approach<br />
to documentation and the new methods, it is necessary<br />
to include a traditional drawing of the artefact in a three<br />
dimensional documentation. For example, a pottery surface<br />
was drawn on the left side and the profile and inner area was<br />
drawn on the right side (This is the traditional way of presenting<br />
such information in Japanese archaeology, figure 2).<br />
Point clouds data are able to transform and delete easily.<br />
To output a three dimensional drawing with a traditional information,<br />
Point clouds data cut out quarter of a pottery by Meshlab<br />
(figure 3). This data was converted to a PDF file displayed<br />
in the shading illustration mode offered by Acrobat Reader9<br />
(Adobe Systems, Inc.).<br />
Results<br />
Figure 1. Laser Scanning by the Low-cost scanner.<br />
Figure 2. The traditional drawing (Haji ware).<br />
Many methods and types of low-cost equipment capable of<br />
capturing three-dimensional data are presently available. This<br />
capability is oftentimes more efficient than two-dimensional<br />
archaeological drawing.<br />
For decorative artefacts, in particular, our trial demonstrated<br />
that it is possible to document artefacts faster using<br />
56 <strong>CIPA</strong> <strong>HERITAGE</strong> <strong>DOCUMENTATION</strong> BEST PRACTICES AND APPLICATIONS Series I, 2007 & 2009
three-dimensional methods, than it is using traditional methods.<br />
However, documenting artefacts such as dishes and cups<br />
is relatively easy using the traditional methods, but more difficult<br />
to document using three-dimensional methods due to<br />
the difficulty of aligning scans (as a result of the absence of<br />
match points). For example, the rims of pottery are often too<br />
narrow to allow for the lining up of match points. I will attempt<br />
to find a way to resolve this problem. Possible solutions include<br />
the appropriate positioning of artefacts and scanner, the<br />
selection of suitable targets, etc.<br />
Conclusion<br />
Figure 3. Cutting out the model with texture. Figure 4. Shading illustration model from low-cost laserscanner.<br />
In order to use three-dimension data collection in archaeological<br />
studies, it is necessary to establish realistic and feasible<br />
methods. This report presents our recent trial in Japanese archaeology.<br />
Most archaeologists in Japan (including the author) are unable<br />
to use three-dimensional data effectively. It is important,<br />
therefore, that archaeologists learn how to use such data to<br />
classify and analyze artefacts. For example, pottery and clay<br />
figures can be classified by the Fourier descriptor (Iwata and<br />
Ukai 2002) under way.<br />
Furthermore, three-dimensional models of archaeological<br />
artefacts should be made accessible to the public on-line, and<br />
in museums. Our laboratory currently collaborates with archaeologists<br />
at local-government level and in foreign countries<br />
(such as China) on such projects. For example, PDF-X data<br />
generated from Ikoma Kiln sites (8th century A.D.) was presented<br />
at an annual exhibition about the excavations by the<br />
Ikoma City Board of Education.<br />
Our laboratory will continue to further develop the utilization<br />
of three-dimensional data for use in Japanese archaeological<br />
studies.<br />
References<br />
Abernathy, D., 2007. Review: The NextEngine Desktop 3D Scanner.<br />
CSA Newsletter Vol.XX, No.1.<br />
CISA3, 2009. Research Projects Digital Pottery Informatics. http://<br />
cisa3.calit2.net/arch/research/digitalpotery.php<br />
Iwata, H. and Y. Ukai (2002) SHAPE: A computer program package<br />
for quantitative evaluation of biological shapes based on elliptic<br />
Fourier descriptors. Journal of Heredity 93: 384-385.<br />
Lesk, M., 2007. 3-D scanning. Electronics in the Visual Arts conference<br />
2007.<br />
Shear, G., 2008. 3D Scanning for Profile Acquisition and Reconstruction<br />
of Mayan Ceramics.<br />
http://www.thepersistentbeat.com/Tech-Ceramics_files/3D%<br />
20Sherd%20Paper.pdf<br />
aPPlIcatIon oF a low cost laser scanner For arcHaelogy In jaPan<br />
57
ABSTRACT<br />
Depending on the concept of ‘heritage interpretation’, the significance<br />
of visitors and their behaviors on heritage site has been<br />
emphasized in recent days. The role of visitors should be redefined<br />
not only for immediate management issues of heritage site<br />
but also for long-term conservation of heritage site. This paper investigates<br />
visitors’ behaviors on Gyeongbokgung Palace using<br />
GPS to record accurate data of their spatial pattern. During the<br />
process of research, GPS logger was used to track the spatial data<br />
of 100 visitor groups. As a result, 4 typical spatial patterns (Axis,<br />
Circulation, Hybrid, Front) of visitors were derived from GPS<br />
data. By statistical analysis, visiting time and spatial pattern have<br />
no relationship with destination familiarity of the visitor, composition<br />
of travelling party, or purposes of visit. Because of the spatial<br />
characteristics of the heritage site, visitors are easily confronted<br />
with ‘ants-trail’. On the contrary, the spatial pattern of visitors<br />
can be explained by the level of provided information about<br />
buildings in Gyeongbokgung. The results of research will be applied<br />
to actual process of information management on the heritage<br />
sites. In conclusion, the structure and content of information<br />
about heritage site are the most important factors which can affect<br />
the visitor’s spatial pattern and experience. This paper suggests<br />
information system in purpose of providing contextual information<br />
to visitors and providing more meaningful experiences to<br />
each visitor.<br />
Key Words: Heritage Interpretation, Heritage management, Information<br />
management, Visitor behavior, GPS, Gyeongbokgung<br />
Palace.<br />
Introduction<br />
A study on the gps tracking analysis<br />
for information management<br />
on heritage site<br />
S. Kim, J. Kim<br />
a Graduate School of Culture Technology, KAIST, 373-1 Guseong-dong, Yuseong-gu Daejeon, 305-701,<br />
Republic of Korea, sunny1015@kaist.ac.kr, jwkim21@kaist.ac.kr.<br />
Definition of Heritage and Heritage Site<br />
Heritage is one of the most controversial concepts since heritage<br />
revealed itself as a various functioning role in our society;<br />
identity of citizens, history of region, as well as important<br />
destination of tourism industry, means of community development.<br />
These versatile, such as social, historical, touristic and<br />
economical perspectives toward heritage sites hinder defining<br />
what heritage is and what it should mean to the public. Under<br />
these circumstances, many heritage practitioners simply leave<br />
the definition as broad and malleable as possible. (Harvey,<br />
2001) Concurrently, Larkham defines heritage as “all thing to<br />
all people”. (Larkham, 1995) Lowenthal sees that “heritage is<br />
today all but defies definition”. (Lowenthal, 1998) Lastly<br />
UNESCO World Heritage Program defines heritage as “our<br />
legacy from the past, what we live with today and what we<br />
pass on to future generations”. In addition heritage site is “the<br />
works of man or the combined works of nature and man, and<br />
areas including archaeological sites which are of outstanding<br />
universal value from historical, aesthetic, ethnological or anthropological<br />
point of view”. Heritage is not substantial object<br />
which can be classified by the absolute rules irrespective of<br />
time change, but on the other hand, it is essentially accompanied<br />
with communicative process within stakeholders in society.<br />
So, Heritage refers to “value-loaded concept”, and the<br />
value is always changing within social changes. (Hardy,<br />
1988)<br />
The definition of heritage is simple but still ambiguous.<br />
Heritage studies nevertheless should imply any actual, concrete<br />
conceptual background which can be used for heritage<br />
practitioners for the purpose of management. If we only emphasize<br />
unsystemized and heterogeneous side of heritage definition,<br />
heritage studies would be confronted with “morass of<br />
case studies”. (Harvey, 2001)<br />
Heritage Interpretation as Communication<br />
ICOMOS Charters give practical guidelines to preserve, conserve,<br />
research on heritage sites. In the Charter of Venice<br />
(1964), “It is essential that the principles guiding the reservation<br />
and restoration of ancient buildings should be agreed and<br />
a study on tHe gPs trackIng analysIs For InFormatIon management on HerItage sIte<br />
59
e laid down on an international basis, with each country being<br />
responsible for applying the plan within the framework of<br />
its own culture and traditions.” Consecutive ICOMOS charters<br />
emphasize the significance of public communication to heritage,<br />
including interpretation and presentation process. Interpretation<br />
particularly refers to the full range of potential activities<br />
intended to heighten public awareness and enhance understanding<br />
of cultural heritage site. Tilden insisted that heritage<br />
interpretation is more than to interchange of information<br />
between interpretation provider and receiver. It rather inspires<br />
and provokes the receivers of information, like citizens, foreign<br />
tourists, and potential visitors. The scope of interpretation is<br />
complex, but Tilden suggests six fundamental principles of interpretation.<br />
(Tilden, 1977)<br />
➧ Any interpretation that does not somehow relate to what is<br />
being displayed or described to something within the personality<br />
or experience of the visitor will be sterile.<br />
➧ Information, as such, is not interpretation. Interpretation is<br />
revelation based upon information, but they are entirely<br />
different things. However, all interpretations include information.<br />
➧ Interpretation is an art, which combines many arts, whether<br />
the materials presented are scientific, historical or architectural.<br />
➧ The chief aim of interpretation is not instruction, but provocation.<br />
➧ Interpretation should aim to present a whole rather than a<br />
part, and must address itself to the whole man rather than<br />
any phase.<br />
➧ Interpretation addressed to different visitor segments<br />
should follow a fundamentally different approach.<br />
Antecedents<br />
The concept of heritage interpretation implies that heritage<br />
site needs such information system which is based on visitor’s<br />
behaviors and experience. This information system should<br />
give a new phase of personal experience and emotional provocation<br />
to visitors.<br />
The advent of new technology has given an opportunity to<br />
researchers to model new media for visitor’s information system,<br />
like PDA, Cellular Phone, etc. However, convergence between<br />
information technology and tourism industry often neglect<br />
the side of information users. There have been so many<br />
technological inventions for information system, but detailed<br />
knowledge of the basis of actual visitor behavior is lacking in<br />
designing the information system. (Nielsen, 2004) It impedes<br />
the system to be successful. Therefore, practical visitor studies<br />
need to be executed for establishing user-centric methodological<br />
framework in heritage information system.<br />
Recent visitor studies were based on consumer behavior<br />
theory in the field of management, and attempted to explain<br />
visitor behavior by visitor behavior model. Visitor behavior is<br />
affected by situational influences, product characteristics,<br />
and individual differences. Situational influences of visitor is<br />
determined by nature of decision making, or composition of<br />
travelling party; family, friend or lovers. Product Characteristics<br />
are determined by purpose of trip and mode of travel.<br />
Family life cycle and socio-economic status influence individual<br />
difference. (Fodness and Murray, 1999) The satisfaction<br />
process of visitor also could be measured by theoretical model<br />
that explains the interrelationships between attitudes, prior<br />
beliefs, post-experience assessments. (del Bosque and Martin,<br />
2008) The number of visiting sites also affects visitor behavior<br />
model. (Tideswell and Faulkner, 1999) However, limitation<br />
of theoretical behavior model lies in its methodology.<br />
The data which were derived from survey or questionnaire data,<br />
easily fail to describe the actual, spatial features of visitor<br />
behavior and these models remain at only theoretical level.<br />
(Mazanec, 2007)<br />
Gareth Shaw insisted that research on spatial pattern of visitors<br />
has been neglected, though spatial concentration of visitors<br />
is the phenomena in tourism recently. (Shaw and Williams,<br />
2002) Depending on the new technology, visitor behavior could<br />
be observed and analyzed. In national park, managers are confronted<br />
to organize the flux of visitors. They used ALGE system,<br />
which is used for athletic sports, to track the spatial pattern of<br />
visitors. (O’Connor and Zerger and Itami, 2005) In Akko, heritage<br />
site in Israel, 3 methods (GPS, Cellular Phone, Land Based<br />
TDOA) were experimented in tracking visitors. (Shoval, 2007)<br />
Engineers also developed computer algorithm that extract route<br />
of visitors from GPS data, and cluster groups by similar spatial<br />
pattern automatically. (Asakura and Iryo, 2007) VR and personal<br />
image, mental maps are combined to GIS recently. (Bishop<br />
and Gimblett, 2000) This kind of research is interdisciplinary<br />
approach of heritage studies.<br />
Aim of Study<br />
➧ To record spatial data of visitor on heritage site<br />
➧ To analyze characteristics of visitor behavior in heritage<br />
site compared to other tour sites.<br />
➧ To set guidelines for building interpretation system on heritage<br />
site based on visitor’s experience.<br />
Methods<br />
Gyeongbokgung Palace<br />
Gyeongbokgung, built in 1395 (the fourth year of King Taejo),<br />
is the historical site No.117 of Korea, and was the main palace<br />
of the Joseon Dynasty. It is the foremost palace of the five royal<br />
residences in Seoul, the capital of the Joseon Dynasty;<br />
Gyeongbokgung, Changdeokgung, Changgyeonggung, Gyeonghuigung<br />
and Deoksugung. The restoration project of Gyeongbokgung<br />
is in progress. As a result, the scenery of Gyeongbokgung<br />
will look differently from what it is at the current moment.<br />
However, there has been no research to observe the visitor’s<br />
spatial pattern and analyze their experience on Gyeongbokgung.<br />
The results of study must be applied to new information<br />
system of Gyeongbokgung, as it will be restored for the<br />
next few years.<br />
60 <strong>CIPA</strong> <strong>HERITAGE</strong> <strong>DOCUMENTATION</strong> BEST PRACTICES AND APPLICATIONS Series I, 2007 & 2009
Methods<br />
We used 2 methods to track the visitors in Gyeongbokgung;<br />
first, non-participatory tracking by trained researcher to record<br />
behavior of visitors, second, GPS tracking by GPS Logger to<br />
record more quantitative data of visitor’s spatial pattern. These<br />
2 methods function reciprocally. Finding only geometrical pattern<br />
from GPS data is hard to give implications about visitor’s<br />
experience. The geometrical pattern itself does not tell why<br />
visitor has stopped at specific point and what visitor did at that<br />
moment. In contrast, non-participatory tracking depends on<br />
subjective decision of researchers. Therefore, a large amount<br />
of data must be recorded by GPS logger in objective way. Nonparticipatory<br />
tracking is process to examine “Spatial Behavior”,<br />
and GPS tracking is process to examine “Behavior in<br />
Space”. (Werlen, 2000)<br />
We executed non-participatory tracking for 7 days, and 19<br />
groups of visitor were analyzed. GPS tracking was carried out<br />
for 7 days, and 100 groups of visitor were analyzed. We used<br />
GPS740 Model (http://www.ascen.co.kr) for tracking visitors.<br />
To supplement GPS data, we also executed 2 times of survey;<br />
before visiting and after visiting Gyeongbokgung. In prior<br />
survey, questions were ‘purpose<br />
of visit’, ‘composition of travelling<br />
party’, ‘first visit or prior visit<br />
experience’. In posterior survey,<br />
‘impressive spot’, ‘used information<br />
source (brochure, signage,<br />
personal guide, none)’<br />
were asked to visitors. To control<br />
the environmental features, we<br />
carried out GPS tracking only on<br />
weekends during pm 12:00 ~<br />
pm 4:00. For the same reason,<br />
the cloudy or rainy days were excluded.<br />
Figure 1. GPS Logger.<br />
Data Analysis<br />
Figure 2. Process of GPS Tracking.<br />
To analyze raw data from GPS Logger, we developed 2 algorithms.<br />
One is called Zone analysis. In Gyeongbokgung, there<br />
are 20 Zones to visit, including King’s Garden, Pavilion, Hall,<br />
and Queen’s room, etc. The outer rectangle in figure 3 shows<br />
area for the Throne hall compound. The inner rectangle shows<br />
Geunjeongjeon hall. Point A was recorded at 2009/03/28<br />
13:08:19 and Point B was recorded at 2009/03/28<br />
13:33:39. The differences between A and B refer to time of<br />
the visitors staying in the Throne hall compound. The developed<br />
algorithm calculated the visiting time of 100 groups in<br />
20 zones automatically.<br />
Figure 3. Zone Analysis.<br />
Figure 4. Grid Analysis.<br />
Zone analysis is useful only for observing behavior in<br />
zones, but Grid analysis is useful for observing the whole area<br />
of Gyeongbokgung irrespective of zones. We separated<br />
Gyeongbokgung by 5183 grids. And the developed algorithm<br />
extracts the grid where visitors stayed more than 5 minutes.<br />
a study on tHe gPs trackIng analysIs For InFormatIon management on HerItage sIte<br />
61
By Grid analysis, we found the spot where visitors spent the<br />
most of time.<br />
Result<br />
The spatial pattern of visitors in Gyeongbokgung could be<br />
classified under 4 patterns; Axis, Circulation, Front, Hybrid.<br />
Axis pattern is for visitor who walked straight from entrance<br />
and only visited buildings which are on axis line. Visitors who<br />
walk in Circulation pattern doesn’t move by axis line. They<br />
rather walk about Gyeongbokgung in clockwise or counterclockwise<br />
rotation. Front pattern is for visitors who only stayed<br />
in front of Gyeongbokgung. They usually visited only 3 or 4<br />
buildings. Hybrid pattern is the combination of Axis pattern<br />
and Circulation pattern.<br />
Table 1. Spatial Patterns<br />
N %<br />
Axis 29 29.0<br />
Circulation 22 22.0<br />
Hybrid 33 33.0<br />
Front 16 16.0<br />
Total 100 100.0<br />
Figure 5. 4 Patterns Mapping on Goole Earth. From left Axis, Circulation, Front, Hybrid.<br />
Table 2. Hypothesis Verification<br />
By cross-tabulation analysis, ‘information source’ which<br />
media visitor used in Gyeongbokgung has correlation with the<br />
spatial pattern. Each information source, like brochure, personal<br />
guide, and signage, offers particular ways for visiting the<br />
site. And also ‘desire of information’ makes difference in visiting<br />
time. Visitors who want more information about heritage<br />
site or want to access information system tend to stay longer.<br />
Otherwise ‘purpose of visit’, ‘composition of travelling party’,<br />
and ‘first visit or prior visit experience’ do not indicate any statistical<br />
relationships with the spatial pattern or the total visiting<br />
time.<br />
Spatial pattern of visitors is not only affected by the visitors<br />
themselves but also by the Supply-side. Supply-side includes<br />
the information system which heritage managers offer,<br />
and proximity of buildings. (Tideswell and Faulkner, 1999 and<br />
Shoval and Isaacson, 2007) As a result, we illustrated by GPS<br />
data which zone is the most frequently visited and which zone<br />
is not.<br />
The figure 6 shows that visitors tend to stay more in the<br />
zone near the entrance. Point A refers to the main entrance of<br />
Gyeongbokgung. Previous studies have shown that a site in a<br />
close distance to others will be more attractive to visitors as it<br />
offers more opportunities. (Fotheringham, 1985) This is called<br />
the ‘law of proximity’.<br />
H1. Purpose of Visit Different Purpose of Visit makes different pattern. Rejected<br />
H2. Prior Visit Experience Number of Prior Visit makes different pattern. Rejected<br />
H3. Composition of Travelling Party Different Travelling Party(Friend, Family, etc) makes different pattern. Rejected<br />
H4. Information Source Different Information Source makes different pattern. Accepted<br />
H5. Destination Familiarity Repeat visitors will spend more time in site Rejected<br />
H6. Heterogeneity of preferences The larger the travel party size, the more time will be spent Rejected<br />
H7. Risk and Uncertainty reduction The further the visitors’ city of origin, the more time will be spent Rejected<br />
H8. Desire of Information Desire of Information will make difference in visiting time Accepted<br />
62 <strong>CIPA</strong> <strong>HERITAGE</strong> <strong>DOCUMENTATION</strong> BEST PRACTICES AND APPLICATIONS Series I, 2007 & 2009
Figure 6. Time Spent in Each Zone.<br />
There are two findings from spatial analysis of Gyeongbokgung.<br />
First is the exception of ‘law of proximity’. Geoncheonggung<br />
Residence locates in northern side of Gyeongbokgung,<br />
but 3.34% of total visiting time is recorded. This number is<br />
quite high compared to nearby buildings. The reason is that<br />
Geoncheonggung has implicit information. Queen Myeongsung,<br />
King Gojong’s wife, was assassinated here by Japanese.<br />
Even though Geoncheonggung is far from entrance, this famous<br />
historical event functions as vital information to visitors.<br />
The Second one is that visitors tend to stay much time out of<br />
zone. 48.62% of total visiting time is being spent out of zone.<br />
Heritage managers usually presume that visitors stay in the<br />
zone. Moreover, managers concentrated to develop information<br />
about zones. However, the fact shows that information<br />
about heritage site must contain pathway, resting place, trees,<br />
as well as a void space.<br />
Discussion<br />
Figure 9. Contextual Information System.<br />
The results indicate that visitors’ behavior on heritage site are<br />
affected by the information system rather than their own features,<br />
such as purpose of visit, composition of travelling party.<br />
Previous studies showed the same results. Visitor behavior<br />
model has concentrated on the visitor’s experience in macro<br />
level, like 2 or 3 days visiting. In micro level, like visiting only<br />
one place, visitors are confronted with ‘ants-trail’. Individual<br />
Preference, purpose of visit play a vital role before visitors arrive<br />
at heritage site. But during the visit, they move in same<br />
pattern like ants. (Keul and Kuehbergerl, 1997) Therefore, the<br />
interpretation system should be designed carefully, since the<br />
information affect the visitor’s experience directly. To deduct<br />
management issues from ‘one’ heritage site, behavior model<br />
and assumptions must be modified depending on particular<br />
situation that heritage site faces.<br />
Visitors depend on the information which heritage manager<br />
offers. Visitors on heritage site are different from visitors at<br />
other tourism site or leisure site. Previous studies have shown<br />
that visitors on heritage site have a desire for leisure experience.<br />
(Prentice, 1993) And they also want to do window shopping,<br />
rather to get knowledge about heritage. (Markwell, Bennett,<br />
and Ravenscroft, 1997) But the result of previous studies<br />
was simply deducted, because heritage managers have offered<br />
only information for elite. (Bramwell, and Lane, 1993)<br />
This kind of heritage information is useless for giving more<br />
meaningful experience to visitors. Visitors need experience<br />
that is only possible on heritage site, even though they do not<br />
need ‘to study’ about heritage. Visitors have desires to participate,<br />
to walk around, to experience. Therefore, heritage interpretation<br />
is more human than researcher assumes. (Mitshce,<br />
and et al., 2008)<br />
Contextual information system which emphasizes on the<br />
situation of visitors starts with archiving. Tracking data is also<br />
a kind of archive. Digital technology could be helpful for archiving.<br />
The most important point in archiving is to decide<br />
what has to be archived about heritage. Photos, footpath, articles,<br />
and mental maps could be examples. The target of archiving<br />
is extended from past to present days, and from historical,<br />
architectural fact to visitor’s memory. Second step is<br />
to design the structure of system. The issues derived from the<br />
results must be reflected in the structure of system. There is<br />
no perfect structure, but there are storytelling methods that<br />
functions as a reference for designing structure. (Miller, 2004)<br />
Afterwards, information manager establishes strategy for each<br />
a study on tHe gPs trackIng analysIs For InFormatIon management on HerItage sIte<br />
63
media; PDA, Kiosk, Web, and also analogue media like paper<br />
brochure. The service of media is segmented for various types<br />
of visitor.<br />
Conclusions<br />
Contextual information system will be evolving as socio-technical<br />
environment changes. It contains not only explicit information<br />
but also implicit information such as ideas, experience<br />
of people, and events. The information system must be comprehensible<br />
by a present visitor as well as a future visitor.<br />
(Cameron, and Kenderdine, 2007) Building heritage information<br />
system is a lively controversy. At least, information system<br />
must be designed according to visitor’s desire and their experience.<br />
The definition of visitor must be enlarged to people<br />
who never visited the heritage site or people of future generation.<br />
For such purpose, visitor’s need and experience should<br />
be observed by studying visitor behavior constantly. This research<br />
is the first step for building sustainable heritage interpretation<br />
system.<br />
Relationships between nationality and visitor behavior, and<br />
differences among heritage sites are neglected on this research.<br />
Alongside, actual process of building information system<br />
could be the next research area. These all must be the<br />
tasks of future work.<br />
Acknowledgements<br />
The research was executed under authorization of Cultural<br />
Heritage Administration of Korea and Gyeongbokgung Office<br />
for access to Gyeongbokgung Palace.<br />
References<br />
Asakura, Y. and Iryo, T., 2007. Analysis of tourist behavior based on<br />
the tracking data collected using a mobile communication instrument.<br />
Transportation Research Part A, 41(7), pp. 684-<br />
690.<br />
Bishop, I. D. and Gimblett, H. R., 2000. Management of recreational<br />
areas: GIS, autonomous agents, and virtual reality. Environment<br />
and Planning B, 27(3), pp. 423-436.<br />
del Bosque, I. R. and Mart, H. S., 2008. Tourist satisfaction a cognitive-affective<br />
model. Annals of Tourism Research,35(2), pp.<br />
551-573.<br />
Bramwell, B. and Lane, B., 1993. Interpretation and sustainable<br />
tourism: The potential and the pitfalls. Journal of Sustainable<br />
Tourism, 1(2), pp. 20-27.<br />
Cameron, F. and Kenderdine, S. 2007. Theorizing Digital Cultural<br />
Heritage: A Critical Discourse (Media in Transition). The MIT<br />
Press.<br />
Fodness, D. and Murray, B., 1999. A model of tourist information<br />
search behavior. Journal of Travel Research, 37(3), pp. 220-<br />
230.<br />
Fotheringham, A. S., 1985. Spatial competition and agglomeration<br />
in urban modeling. Environment and Planning A, 17(2), pp.<br />
213-230.<br />
Hardy, D., 1988. Historical geography and heritage studies. Area,<br />
20(4), pp. 333-338.<br />
Harvey, D. C., 2001. Heritage pasts and heritage presents: temporality,<br />
meaning and the scope of heritage studies. International<br />
Journal of Heritage Studies, 7(4), pp. 319-338.<br />
Keul, A. and Kuehbergerl, A., 1997. Tracking the Salzburg tourist.<br />
Annals of Tourism Research, 24(4), pp. 1008-1012.<br />
Larkham, P. J., 1995. ‘Heritage as planned and conserved’, in D.T.<br />
Herbert (ed.) Heritage, Tourism and Society. London: Mansell,<br />
pp. 85.<br />
Lowenthal, D., 1998. The Heritage Crusade and the Spoils of History.<br />
Cambridge: CUP, pp. 94.<br />
Markwell, S. and Bennett, M. and Ravenscroft, N., 1997. The changing<br />
market for heritage tourism: A case study of visits to historic<br />
houses in England. International Journal of Heritage Studies,<br />
3(2), pp. 95-108.<br />
Mazanec, J. A., 2007. New Frontiers in Tourist Behavior Research:<br />
Steps toward Causal Inference from Non-experimental Data.<br />
Asia Pacific Journal of Tourism Research, 12(3), pp. 223-235.<br />
Miller, C. H., 2004. Digital Storytelling, A Creator’s Guide to Interactive<br />
Entertainment. Focal Press, pp. 165-176.<br />
Mitsche, N., and Reino, S., et al., 2008. Enhancing Cultural Tourism<br />
e-Services through Heritage Interpretation. Information<br />
and Communication Technologies in Tourism Proceedings of<br />
the International Conference in Innsbruck, pp. 418-429.<br />
Nielsen, L. B., 2004. Post Disney experience paradigm?: some implications<br />
for the development of content to mobile tourist services,<br />
ACM International Conference Proceeding Series, 60.<br />
O’Connor, A. and Zerger, A., et al., 2005. Geo-temporal tracking<br />
and analysis of tourist movement. Mathematics and Computers<br />
in Simulation, 69(1-2), pp. 135-150.<br />
Prentice, R., 1993. Heritage: A key sector of the ‘new’ tourism.<br />
Progress in Tourism, Recreation and Hospitality, 5, pp. 309-<br />
324.<br />
Shaw, G. and Williams, A. M., 2002. Critical Issues in Tourism: A<br />
Geographical Perspective, Blackwell, Oxford, pp. 135.<br />
Shoval, N., 2008. Tracking technologies and urban analysis. Cities,<br />
23(1), pp. 21.<br />
Shoval, N. and Isaacson, M., 2007. Tracking tourists in the digital<br />
age. Annals of Tourism Research, 34(1), pp. 141-159.<br />
Tideswell, C. and Faulkner, B., 1999. Multidestination travel patterns<br />
of international visitors to Queensland. Journal of Travel<br />
Research, 37(4), pp. 364-374.<br />
Tilden, F., 1977. Interpreting our heritage. University of North Carolina<br />
Press.<br />
Werlen, B., 2000. Sozialgeographie. UTB, Stuttgart, pp. 135.<br />
64 <strong>CIPA</strong> <strong>HERITAGE</strong> <strong>DOCUMENTATION</strong> BEST PRACTICES AND APPLICATIONS Series I, 2007 & 2009
ABSTRACT<br />
At the Bayon temple in Cambodia constructed by sandstone, a<br />
study on bio-deterioration is one of key tasks of conservation<br />
measures for it. Especially, the progress of the deterioration seen<br />
in the bas-relief of the inner gallery which was carved the myth<br />
world of Hinduism by outstanding description is remarkable. The<br />
purpose of this study is to investigate the kind, distribution, and<br />
reproductive cycle of biological colonization to discern the relationship<br />
with the environment attribute to deterioration and find<br />
an effective method to remove them. We assume that some of the<br />
microorganisms can be discriminated by detecting the absorbance<br />
spectra of photosynthetic pigments in them. We developed<br />
a new multispectral imaging system to analyze the spectral information<br />
of different microorganisms on the wall’s surface. Our system<br />
has a wide field of view, low noise, negligible distortion and<br />
high resolution enable us to measure the bas-relief in situ. We also<br />
developed a segmentation method in order to the spectral image<br />
allow to discriminate kind and distribution of microorganisms.<br />
Our classification results show the difference in each microorganism’s<br />
distribution between rainy and dry seasons.<br />
Key words: Microorganisms, Bio-deterioration, Multispectral image,<br />
Normalized cuts.<br />
Introduction<br />
Multispectral image analysis for bas-relif<br />
at the inner gallery of bayon temple<br />
T. Morimoto 1 , M. Chiba 2 , Y. Katayama 3 , K. Ikeuchi 1<br />
1. Institute of Industrial Science, The university of Tokyo, Japan - (tetsu23 * ,ki)@cvl.iis.u-tokyo.ac.jp<br />
2. Graduated School of the Science & Engineering, Waseda University, Japan - mayukochib@fuji.waseda.jp<br />
3. Tokyo University Agriculture and Technology, Japan - katayama@cc.tuat.ac.jp<br />
Commission VI, WG VI/4<br />
Spectral reflectance is inherent in the nature of objects. Different<br />
materials have different spectral reflectance. Object analysis<br />
based on this fact has been conducted in many fields, such<br />
as medical imaging, agriculture, remote sensing, and archaeology,<br />
to name a few.<br />
Our Digital Bayon Project (Ikeuchi and Miyazaki, 2007),<br />
which have digitized the shape and surface reflectance of the<br />
Bayon Temple in the Angkor ruin for preservation and deterioration<br />
prevention, needs to determine what kind of microorganisms<br />
are present and how widely they exist over the struc-<br />
tural surfaces. This involves the analysis of spectral reflection<br />
distribution of microorganisms living on the bas-relief of the<br />
Bayon Temple.<br />
The microorganisms are one cause of deterioration in the<br />
inner gallery of Bayon Temple. Due to deterioration, the detailed<br />
bas- reliefs on the walls are losing their shapes. We examine<br />
the kind, distribution, and reproductive cycle of the microorganisms<br />
to find an effective method to remove them. We<br />
assume that some of them can be discriminated by detecting<br />
the absorbance spectra of photosynthetic pigments in them,<br />
and we find we can calculate absorbance from reflectance.<br />
For the efficient analysis of spectral distribution over an<br />
object surface, a two-dimensional spectral image acquisition<br />
system is desirable. Traditional spectral cameras provide spectral<br />
data only from a limited area, often from a spot. It is difficult,<br />
if not impossible, to cover the entire surface of the basrelief,<br />
whose size is 800m × 4m, located in the inner corridor<br />
of the temple. This is one of the motivations for us to develop<br />
an efficient, handy, and yet high-resolution spectral imaging<br />
system. The requirements of the system are: 1) to cover a wide<br />
area for efficient measurement to be able to determine distribution<br />
of microorganisms, 2) to be able to ignore variations of<br />
illumination conditions in dramatic weather changes from<br />
bright sunshine to dark squall, and 3) to design a handy system<br />
that can be transported to a deep jungle.<br />
We developed a new multispectral imaging system using a<br />
Liquid Crystal Tunable Filter (LCTF) (Tominaga and Okajima,<br />
2000), mounted on an automatic pan/tilt platform. Compared<br />
to conventional systems, our system has not only high image<br />
quality with sufficient spectral resolution but also a wide capturing<br />
angle for efficient sampling.<br />
Preservation of cultural assets involves challenges to spectrum<br />
measurement. Cultural assets are often in severe outdoor<br />
environments, such as the environments of the pyramids<br />
multIsPectral Image analysIs For bas-relIF at tHe Inner gallery oF bayon temPle<br />
65
in Egyptian desert or the Angkor ruin in Cambodian jungle. In<br />
an outdoor environment, wide alterations in the illumination<br />
environment often occur quickly. Fixed exposure of a system<br />
causes saturation and underexposure. To tackle these problems,<br />
we developed a measuring method that can estimate<br />
optimum exposures based on noise analysis of the system.<br />
Preservation of cultural assets also needs to determine not<br />
only the kinds of microorganisms that exist but also how widely<br />
they are spread and how much they mix with each other.<br />
This requires us to segment the multispectral images into spatial<br />
segments corresponding to the distribution of these microorganisms.<br />
We propose an effective dimension reduction method by<br />
using Normalized Cuts (NCuts) (Shi and Malik, 2000), a class<br />
of non- linear dimensional reducers. NCuts methods are widely<br />
used as segmentation methods for RGB images in computer<br />
vision, but they are not used for multispectral image segmentation<br />
in general. NCuts methods are convenient in reducing<br />
dimension in a nonlinear manner, and simultaneously<br />
segmenting the data. One difficulty in applying NCuts method<br />
to our problem is the necessity of a huge memory space (N ×<br />
N) for creating an affinity matrix. We solve this issue by applying<br />
a local linear approximation (Bishop, 2008), by assuming<br />
local linearity on the tangential space of a global manifold<br />
space in the high dimension.<br />
The specific contributions of our work are to propose a<br />
multispectral image acquisition technique for obtaining panoramic<br />
multispectral images, to develop a segmentation method<br />
to handle global nonlinear dimensional reduction, and to<br />
apply our method to the microorganism analysis of bas-relief<br />
of Bayon temple actually.<br />
The structure of this paper is as follows. Section 2 describes<br />
our hardware design for panoramic multispectral imaging<br />
and capturing techniques of data acquisition for cultural<br />
assets. Section 3 derives a nonlinear dimension reduction<br />
Figure 1: Bayon temple in Cambodia.<br />
method using the ”kernel trick” and NCuts method, and applies<br />
the NCuts segmentation to a multispectral image. In<br />
Section 4, we evaluate our methods. In Section 5, we demonstrate<br />
the application for analyzing microorganisms on the<br />
bas-reliefs of the Bayon temple. Finally, we conclude the paper<br />
in Section 6.<br />
Acquisition of a Multispectral Image<br />
We developed a novel multispectral imaging system that has<br />
a wide view angle, high image quality, and an accurate spectrum.<br />
The system can efficiently measure a target object in an<br />
outdoor environment. In subsection 2.1, we describe the<br />
hardware construction of our system. In subsection 2.2, we<br />
describe the technique for capturing images in an outdoor environment.<br />
In subsection 2.3, we describe reconstruction of<br />
each band of images having different configurations, and how<br />
to stitch a multispectral image.<br />
Panoramic multispectral camera<br />
Our multispectral imaging system has been designed to be a<br />
handy system with spectrum accuracy in each pixel with a<br />
wide view angle. The system consists of a small monochromatic<br />
CCD camera with a liquid crystal tunable filter (LCTF),<br />
shown in Fig. 2, mounted on an automatic pan/tilt platform<br />
(CLAUS Inc. Rodeon VR head). The LCTF (CRI Inc. Varispec,<br />
Bandwidth 7nm) is an optical filter that allows the wavelength<br />
of the transmitted light to be electronically adjusted. The monochromatic<br />
CCD camera (Sony XCD-X710) with the LCTF<br />
mounted can obtain a series of two-dimensional spectral images<br />
by repeatedly changing the LCTF’s transmittable wavelength<br />
with image acquisitions. The captured image has high<br />
image quality without distortion. The LCTF capturing system<br />
has a narrow field of view because the LCTF is mounted in<br />
front of the lens. We compensate for this problem by using an<br />
Figure 2: Panoramic multispectral<br />
imaging system.<br />
66 <strong>CIPA</strong> <strong>HERITAGE</strong> <strong>DOCUMENTATION</strong> BEST PRACTICES AND APPLICATIONS Series I, 2007 & 2009
automatic panorama pan/tilt platform. The system captures a<br />
wide view multispectral image by synchronizing these three<br />
devices efficiently.<br />
Estimation of adaptive exposure in an outdoor<br />
environment<br />
The optimal exposure time is necessary to be determined in<br />
each wavelength due to the two reasons: uneven characteristics<br />
and varying illumination conditions. A multispectral imaging<br />
system using LCTF generally needs a fixed exposure<br />
time over the entire range of wavelengths for comparing pixel<br />
intensities over all wavelengths. However, the spectral sensitivity<br />
given by the combination of LCTF and monochromatic<br />
camera is very low in short wavelengths (e.g., 400-500 nm),<br />
as shown in Fig. 3a, and relatively high in other wavelengths.<br />
If the pixel intensity at a certain wavelength would be smaller<br />
than the dark current noise, we would not be able obtain a<br />
meaningful measurement at that wavelength. For instance,<br />
Fig. 3.b shows a measured spectrum under dark illumination.<br />
Longer exposure time is necessary for spectral accuracy with<br />
wavelengths from 400 nm to 500 nm than for other wavelengths.<br />
Varying illumination conditions occur in an outdoor environment,<br />
in which many cultural assets are located. Our sen-<br />
(a) (b)<br />
(a) (b)<br />
sor samples spectral data by changing the LCTF’s filtering<br />
characteristics and samples a series of images along the wavelengths.<br />
During this sampling period, it often occurs that the<br />
illumination condition varies due to the movement of clouds.<br />
If the intensity of illumination dramatically varies during measurement,<br />
it would induce saturation or underexposure at certain<br />
wavelengths. The dynamic determination of optimal exposure<br />
time at each wavelength is necessary for adjusting the effects<br />
of varying illumination conditions.<br />
We attempt to estimate an optimal exposure time for each<br />
wavelength based on noise analysis (Reibel et al., 2003). The<br />
noise can be categorized into signal dependent noise (SDN)<br />
and signal independent noise (SIN). In this system, we mainly<br />
consider the effect due to the SIN, since the SDN is negligible<br />
compared with SIN. The SIN is composed of fixed pattern<br />
noise (FPN) and read-out noise, and photo response non-uniformity<br />
(PRNU). FPN is a dark current noise, a dynamic component.<br />
The read-out noise is composed of the reset noise,<br />
amplifier noise, and quantization noise. We focus on the FPN<br />
and the read-out noise, since PRNU is a static component<br />
easily calibrated in the initial stage.<br />
The FPN depends on the temperature and the exposure<br />
time. Here, we assume that the sampling time is reasonably<br />
short, say 5 to 10 min, so that the temperature can be considered<br />
as constant. The FPN has a linear relation with the expo-<br />
Figure 3:<br />
(a) Spectral sensitivity<br />
function of<br />
monochromatic<br />
CCD camera and<br />
LCTF transmittance<br />
function (b)<br />
Illumination spectrum<br />
when the<br />
exposure time in<br />
all bands is fixed.<br />
Figure 4:<br />
(a) The correlation<br />
between the<br />
FPN and exposure<br />
time. (b)<br />
Captured image<br />
of panoramic<br />
multispectral imaging<br />
system.<br />
multIsPectral Image analysIs For bas-relIF at tHe Inner gallery oF bayon temPle<br />
67
sure time as shown in Fig. 4a. The linear relation can be expressed<br />
as follows e DN = at + b, where t is an exposure time, a<br />
is the amount of the FPN increase depending on exposure<br />
times, and b is the amount of the FPN with zero exposure time<br />
at that particular temperature. These values are measured at<br />
the site before sampling from a series of images with various exposure<br />
times while the lens is covered with a cup.<br />
The read-out noise appears randomly at pixel positions at<br />
each image. We model the read-out noise as a Gaussian distribution<br />
at each pixel. In order to evaluate the parameters of<br />
the Gaussian distribution, we obtain a series of lens covered<br />
images, and we calculate mean and standard deviation values.<br />
The mean value of images ε DC are the FPN, and the<br />
standard deviation value of images ε R are read-out noise. We<br />
use the upper bound of the SIN as ε DC + ε R.<br />
Based on the discussion of the noise analysis, we design<br />
the procedure to determine the optimal exposure time at each<br />
wavelength. The procedure consists of two parts. The first<br />
part finds the exposure time that gives the brightest image of<br />
a white reference while avoiding saturation over all wavelengths.<br />
The second part determines any wavelength that<br />
gives lower value in the white reference than the SIN upper<br />
boundary, and, if this wavelength exists, it increases the exposure<br />
time while avoiding saturation.<br />
The first part consists of:<br />
Step 1. Select the brightest area (m × n) on a white reference<br />
at each wavelength, λ, as shown in Fig. 4. b, and obtain<br />
the average brightness within the window, L(λ).<br />
Repeat this step over all wavelengths<br />
Step 2. Obtain the maximum value, Lmax, among all the<br />
brightness values over all wavelengths.<br />
Step 3. Determine the standard exposure time ts as the longest<br />
exposure time when all the values in the brightest<br />
area found in Step 1 are not saturated. Namely,<br />
Lmax < 216 .<br />
The second part rescues the particular wavelength image<br />
buried under the noise level. For this, we measure the FPN<br />
ε DC and read-out noise ε R by putting the cap in front of lens.<br />
Here, the average value is the FPN, and the standard deviation<br />
is considered as the boundary of the read-out noise.<br />
In each wavelength, the optimal exposure time t (λ) is<br />
adaptively estimated. The optimal exposure time t (λ) can be<br />
represented as:<br />
Z eDC + eR+ m<br />
] ts<br />
t()<br />
l = [<br />
L()<br />
l<br />
]<br />
\<br />
ts<br />
( if L(<br />
l) < e + e + m)<br />
DC R<br />
( otherwise)<br />
where μ is an offset value to bring the adjustment to the safer<br />
side.<br />
Construction of panoramic multispectral image<br />
After capturing images, we can synthesize the obtained images<br />
L(i, j, λ) to the spectral power distribution image L´(i, j, λ)<br />
(1)<br />
( Lij ( ,, l) - eDC( ij ,, l))<br />
Ll (,, i j l)<br />
= ts<br />
(2)<br />
t()<br />
l<br />
Here, the FPN image ε DC(i, j, λ) in arbitrary exposure time<br />
can be estimated by using following equation, according to the<br />
linear correlation between the FPN and exposure time, as<br />
shown in Fig.4a:<br />
ε DC(i, j, λ) = α(λ)ε s DC(i, j, λ) (3)<br />
where ε s DC(i, j, λ) is measured as the FPN image first. This<br />
can be obtained to calculate the mean image of captured images<br />
when light is intercepted from the camera. The linear<br />
correlation between the FPN and exposure time is as follows:<br />
at() l + b<br />
al () =<br />
(4)<br />
at () l + b<br />
where a and b are, respectively, slope and intercept.<br />
We calculate a spectral power distribution image L(i, j, λ)<br />
which is divided into the channel values L´ (i, j, λ) in each pixel<br />
i, j by camera sensitivity function C(λ), and LCTF transmittance<br />
function T(λ). Fig. 3 shows the actual sensitivity functions<br />
of each.<br />
L (,, i j l)<br />
Lij (,, l)<br />
=<br />
C() l T()<br />
l<br />
l<br />
Next, we stitch the multispectral images of different view<br />
angles. Stitching usually extracts image features from a pair of<br />
images, establishes correspondences among such extracted<br />
features, and calculates the translation and rotation parameters<br />
to superimpose overlapping areas for connecting these two<br />
images. Here, the features in multispectral images are different<br />
in each band image. To overcome this issue, we generate<br />
an intensity image using all the spectral images in each viewing<br />
direction. Second, we extract Scale Invariant Feature Transform<br />
(SIFT) features (interest points) (Lowe, 2004) from these<br />
intensity images and establish correspondences for obtaining<br />
the translation and rotation parameters. Finally, we stitch the<br />
spectral image of each view angle using these parameters.<br />
Fig.5 shows a synthesized panoramic multispectral image.<br />
Multispectral Image Segmentation<br />
Segmentation of a multispectral image needs dimensional reduc<br />
tion. For dimensional reduction, linear and nonlinear reduction<br />
methods exist. Our prime objects, microorganisms on<br />
the bas- relief of the Bayon temple, have a nonlinear characteristic<br />
in spectral distributions due to the combination of top<br />
and bottom layers. This nonlinear problem can be solved either<br />
by employing the ”kernel trick” such as Kernel PCA<br />
(Schölkopf et al., 1998) or extending the Ncut method.<br />
Nonlinear mixing<br />
Some of the top layer’s pixel spectra typically show mixed<br />
spectral characteristics between the top layers and bottom<br />
layer. In a remote sensing field, these cause a so-called spec-<br />
68 <strong>CIPA</strong> <strong>HERITAGE</strong> <strong>DOCUMENTATION</strong> BEST PRACTICES AND APPLICATIONS Series I, 2007 & 2009<br />
s<br />
(5)
tral mixing (Keshava and F.Mustard, 2002). The spectral mixing<br />
can be categorized into two models: linear mixing and nonlinear<br />
mixing. The linear mixing occurs when one pixel consists<br />
of sub-parts from different materials; the different materials<br />
are distributed on the image plane. Generally, the linear<br />
mixing can be solved by reducing spectral dimension by using<br />
PCA, and clustering reduced data.<br />
Our application, analysis of microorganisms, falls in the<br />
category of nonlinear mixing. This mixing occurs due to layer<br />
surfaces such as microorganisms and bottom rock surfaces.<br />
The different half-transparent materials are distributed along<br />
the line of sight. The PCA method cannot be applied to nonlinear<br />
mixing, but mixing can be achieved either by employing<br />
the kernel PCA (KPCA) (Schölkopf et al., 1998) or extending<br />
the NCuts method.<br />
Normalized cuts<br />
The NCuts method consists of nonlinear dimension reduction<br />
and clustering. Among various segmentation methods, the<br />
NCuts method has a unique feature of nonlinear dimensional<br />
reduction.<br />
For this, let I = {I 1, I 2, I 3, …, I i, …, I N}, where I is input<br />
data, of m dimension, at the node i. Then, the NCuts method<br />
calculates the weight matrix W, representing similarity among<br />
the following formula:<br />
- Ii-Ij Wij<br />
= exp f<br />
s<br />
1 2<br />
Z<br />
] - xi-xj ] exp f 2<br />
p * [ sx<br />
] 0<br />
\<br />
( if X - X < r)<br />
i j 2<br />
( otherwise)<br />
multIsPectral Image analysIs For bas-relIF at tHe Inner gallery oF bayon temPle<br />
2<br />
where Ii , Ij are input values of m dimensions at the node, i<br />
and j, s 2 I is the variance of input data, and r is the threshold<br />
of the proximity between two nodes in the image. NCuts<br />
solves the generalized eigensystem equation:<br />
2<br />
2<br />
p<br />
(6)<br />
(D – W)y = λDy (7)<br />
Next, the Laplacian matrix, L = (D — W) can be calculated<br />
from the weight matrix, W. The normalized Laplacian matrix<br />
is given by:<br />
1<br />
-<br />
2<br />
1 1 1<br />
- - -<br />
2 2 2<br />
LJ = D LD = I-D<br />
WD<br />
(8)<br />
where D is N × N diagonal matrix D j = diag (W (1, j), W (2, j) …),<br />
j = 1, 2, … ,N, and W is N × N a symmetric matrix W (i, j) =<br />
W (j, i). We can transform Eq. 8 into the standard eigensystem<br />
as follows:<br />
1 1<br />
- -<br />
2 2<br />
Figure 5:<br />
Constructed panoramic<br />
multispectral image by<br />
pro posed system: this<br />
image has 81-dimensional<br />
spectrum in each pixel.<br />
D WD z = (1 - l)<br />
z<br />
(9)<br />
We can span a low dimensional space, of E dimensions,<br />
with the eigenvectors from the E + 1 least significant eigenvalues,<br />
where E is the partition number, and we ignore the least<br />
69
significant eigenvalue and the corresponding eigenvector. In<br />
the least significant space, all the input data have roughly<br />
same values due to the data normalization. We map the input<br />
data onto this low dimensional space.<br />
zi+<br />
1,<br />
j<br />
yE<br />
= , ( i= 1, f, E+ 1,,<br />
j f,<br />
N)<br />
ij<br />
D<br />
jj<br />
(10)<br />
Finally, we can segment y Eij into E clusters using the k-means<br />
method.<br />
Applying NCuts to multispectral segmentation<br />
Dimensionality is one of the issues in applying the NCuts method<br />
to the multispectral image segmentation method. The NCuts<br />
method requires making a weight matrix of a high-resolution<br />
image, of which the dimensions are (N × N), where N is the<br />
number of image pixels, typically more than 250,000. The<br />
NCuts method handles this issue by effectively using the proximity<br />
threshold, ignoring remote nodes for calculation, and ending<br />
up solving a sparse matrix of a high-dimensional image.<br />
We employ a two-step method to overcome this high-dimensional<br />
issue. In our microorganism analysis, we cannot<br />
apply the proximity threshold because two remotely located<br />
regions from the same kind of microorganism should be classified<br />
into the same class. We assume that a nonlinear manifold<br />
of high dimension has a linear subspace in a low dimension<br />
such as local linear embedding (Roweis and Saul, 2000),<br />
or ISOMAP (Tenenbaum et al., 2000). First, we oversegment<br />
the multispectral image using a standard PCA method and knearest<br />
neighbor method, and form super-pixels corresponding<br />
to each segment. Then, we apply the NCuts method to<br />
these super-pixels.<br />
Our implementation is as follows: First, we compute M super-pixels<br />
by over-segmentation using PCA dimension reduction<br />
and k-nearest neighbor method. Second, we calculate M<br />
mean spectra for all M super-pixels. Let I = {I 1, I 2, I 3, ., I i, ..,<br />
I M }, where I is spectrum data of m dimensional. Third, we<br />
compute the weight matrix W from M (M < N) super-pixel values<br />
using the following equation:<br />
- Ii () -Ij<br />
()<br />
Wij<br />
= exp f p<br />
2 (11)<br />
t<br />
In our experiment, we set t, a normalization<br />
factor, at 70% of the maximum<br />
distance in the weight graph. Finally,<br />
we can segment a multispectral<br />
image into material regions by using this<br />
weight matrix and NCuts.<br />
Expeirmental Results<br />
In this section, we describe two experiments.<br />
We conducted accuracy verification<br />
of Obtained multispectral image.<br />
We compared proposed segmentation<br />
method with a conventional method.<br />
2<br />
Accuracy verification of multispectral image<br />
In this subsection, we evaluate image noise and spectral accuracy<br />
of a multispectral image given by our system.<br />
Image Noise. Fig. 6a and b show, respectively, the captured<br />
image in fixed exposure, and the captured image by the proposed<br />
dynamic exposure method. The captured image from<br />
the fixed exposure method provides much noisier data. This effect<br />
is more apparent in the short wavelength area. On the other<br />
hand, the captured image given by our method is less noisy.<br />
Spectral Accuracy. Table 1 shows the spectral accuracy of<br />
our system. In this experiment, we captured multispectral images<br />
of a color chart (X-lite Color checker), under artificial sunlight<br />
(Seric XC-100), by using both fixed exposure and the proposed<br />
dynamic exposure methods, respectively. Then, we<br />
measured the spectrum of each patch using a spectrometer<br />
(PhotoResearch PR-655) as the ground truth.<br />
Table 1: Spectral accuracy<br />
70 <strong>CIPA</strong> <strong>HERITAGE</strong> <strong>DOCUMENTATION</strong> BEST PRACTICES AND APPLICATIONS Series I, 2007 & 2009<br />
RMSE<br />
Color Fix AE Color Fix AE<br />
DarkSkin 4.469 1.301 YellowGreen 0.914 0.764<br />
LightSkin 1.347 1.064 OrangeYellow 0.915 0.870<br />
BlueSky 1.254 0.909 Blue 0.627 0.398<br />
Foliage 3.060 0.850 Green 1.204 0.657<br />
BluishFlower 1.196 0.885 Red 0.953 0.887<br />
BluishGreen 0.916 0.516 Yellow 1.102 0.914<br />
Orange 1.460 0.987 Magenta 1.002 0.885<br />
PurplishBlue 1.420 1.074 Cyan 0.619 0.449<br />
ModerateRed 0.937 0.892 White 1.174 0.892<br />
Purple 1.109 1.029 Mean 1.352 0.854<br />
Second, we calculated the root mean square error (RMSE)<br />
between the obtained spectral data and the ground truth in<br />
each patch.<br />
Compared with the RMSE values by the fixed exposure<br />
method, the RMSE values by the proposed method are much<br />
(a) (b)<br />
Figure 6: Image quality of obtained image (a) Captured multispectral image in fixed exposure time.<br />
(b) Proposed method.
(a) (b) (c) (d)<br />
Figure 9: Absorbance of photosynthesis pigments: green algae mainly has<br />
chlorophyll A and B. Cyanobacteria mainly has chlorophyll A and phycocyanins.<br />
lower. The result also showed that our system is effective for<br />
spectral analysis.<br />
Compared with Conventional Segmentation Methods<br />
We compared conventional segmentation methods with the<br />
proposed method. Figs. 7 show the segmentation results of<br />
layered surfaces for examining the effect on the nonlinear mixture.<br />
The input image is four watercolor pigments painted on<br />
a white paper. First, we calculated reflectance spectra from<br />
the input multispectral image by using our method. Second,<br />
we segmented the reflectance spectra image into different<br />
materials using three methods.<br />
This image has complex color between the top layers and<br />
the bottom layer. Fig. 7b, by Method 1, and c, by Method 2,<br />
include significant segmentation error.<br />
Figure 7: Segmentation results<br />
of layered surfaces.<br />
(a) Input image<br />
(b) Method 1: PCA + k-means<br />
(c) Method 2: KPCA + k- means<br />
(d) Method 3: Proposed method.<br />
Multispectral Image Analysis<br />
for Bas-Relief<br />
Figure 8: Microbial<br />
growth on the wall<br />
surface: microscope<br />
images of<br />
microorganisms<br />
observed at each<br />
spot.<br />
This section describes how we applied our proposed multispectral<br />
imaging system and segmentation method to analyze<br />
a cultural asset. At the Bayon Temple in Cambodia, microorganisms<br />
are one cause of deterioration in the inner gallery.<br />
Fig. 8 show the microscope images of microorganisms observed<br />
at each spot. Due to deterioration, the detailed bas-reliefs<br />
on the walls are losing their shapes. We examined the<br />
kind, distribution, and reproductive cycle of the microorganisms<br />
to find an effective method to remove them.<br />
Microorganisms perform photosynthesis by absorbing the<br />
light of a specific absorbance spectrum via sunlight, so the<br />
waveforms of absorbance spectra vary according to the type of<br />
photosynthetic pigment in each microorganism, as shown in<br />
Fig. 9. For example, the absorbance spectrum of gleen agle is<br />
shown as the linear sum of the absorbance spectra of chlorophyll<br />
A and B. And, Cyanobacteria mainly has chlorophyll A and<br />
phycocyanins. Based on above understanding, we assumed<br />
that some of them could be discriminated by detecting the absorbance<br />
spectra of photosynthetic pigments in them, and we<br />
found we could calculate absorbance from reflectance.<br />
Figure 10a shows the image of the scene we observed.<br />
Then, we found correspondences among multispectral images<br />
in different seasons to the same area through 3D data.<br />
The results in Fig. 10b show the measured absorbance<br />
spectrum of each segmented area. The three areas, depicted<br />
using blue, white, and red colors in the figure, should be differentiated<br />
by the quantity of phycocyanin. This is because<br />
multIsPectral Image analysIs For bas-relIF at tHe Inner gallery oF bayon temPle<br />
71
Figure 10:<br />
(a) Observed scene<br />
image: this scene was<br />
made by mapping a<br />
multispectral image<br />
onto 3D data.<br />
(b) Absorbance<br />
spectrum in each<br />
class area.<br />
Figure 11:<br />
Segmentation results<br />
of microorganisms.<br />
(a) Rainy season<br />
(b) Dry season.<br />
the areas’ absorption has large differences at around 600 nm,<br />
which coincides with the phycocyanin’s absorbance spectrum<br />
as shown in Fig. 9. As for Fig. 11 shows, white and blue areas<br />
decrease in a dry season compared to a rainy season, which<br />
implies that the quantity of phycocyanin has decreased in the<br />
dry season. The results indicate that the cyanobacteria, the<br />
main source of phycocyanin, increase in a rainy season and<br />
decrease in a dry season.<br />
Summary<br />
This paper proposed a novel multispectral imaging system<br />
and a segmentation method for multispectral images. Our system<br />
can efficiently obtain a wide view angle image in an outdoor<br />
environment, and also segment a high-dimensional spectral<br />
image effectively. In our experimentation, we found that<br />
our proposed multispectral imaging system has sufficient accuracy<br />
for material segmentation. Furthermore, our multispectral<br />
image segmentation method could effectively segment<br />
layered surfaces into different spectra. The system also<br />
analyzed microorganisms on bas-reliefs in the Bayon Temple.<br />
Our experimental results showed the reproductive cycle of microorganisms<br />
in rainy and dry seasons.<br />
Our next task using the proposed system is to consider the<br />
relationship between the reproductive cycle of microorganisms<br />
and the environment of bas-relief.<br />
(a) (b)<br />
(a) (b)<br />
References<br />
Bishop, C. M., 2008. Pattern recognition and machine learning.<br />
Springer.<br />
Ikeuchi, K. and Miyazaki, D., 2007. Digitally archiving cultural objects.<br />
Springer,New York.<br />
Keshava, N. and F.Mustard, J., 2002. Spectral unmixing. IEEE Signal<br />
processing magazine.<br />
Lowe, D. G., 2004. Distinctive image features from scale invariant<br />
keypoints. IJCV.<br />
Reibel, Y., Jung, M., Bouhifd, M., Cunin, B. and Draman, C.,2003.<br />
CCD or CMOS camera noise charactarisation. The European<br />
Physical Journal Applied Physics 21(1), pp. 75–80.<br />
Roweis, S. and Saul, L., 2000. Nonlinear dimensionality reduction<br />
by locally linear embedding. Science.<br />
Scho¨lkopf, B., Smola, A. and Mu¨ller, K. R., 1998. Nonlinear component<br />
analysis as a kernel eigenvalue problem. Neural Computation<br />
10, pp. 1299–1319.<br />
Shi, J. and Malik, J., 2000. Normalized cuts and image segmentation.<br />
IEEE Trans. on PAMI.<br />
Tenenbaum, J. B., de Silva, V. and Langford, J. C., 2000. A global<br />
geometric framework for nonlinear dimensionality reduction.<br />
Science 290, pp. 2319–2323.<br />
Tominaga, S. and Okajima, R., 2000. Object recognition by multispectral<br />
imaging with a liquid crystal filter. Proc. 15th Int. Conf.<br />
on Pattern Recognition.<br />
72 <strong>CIPA</strong> <strong>HERITAGE</strong> <strong>DOCUMENTATION</strong> BEST PRACTICES AND APPLICATIONS Series I, 2007 & 2009
ABSTRACT<br />
Introducing EDM survey for recording<br />
vernacular heritage and sites in Pakistan<br />
Salman Muhammad<br />
Aga Khan Cultural Service Pakistan, Shahrah-e-Quaid-e-Azam, Jutial, Gilgit 15100,<br />
Northern Areas of Pakistan, salmanmuhammadali@yahoo.com<br />
The case study of the 200 year old Khaplu Palace, in a very remote<br />
and mountainous area of Pakistan, will present the outcomes<br />
and issues of recording an outstanding example of a vernacular<br />
monument using EDM device and related software for<br />
the first time.<br />
Heritage conservation in Pakistan has always faced a lack of<br />
resources and expertise, and is invariably accorded low priority.<br />
Recording heritage, one of the most important prerequisites in<br />
conservation, is not addressed properly. Conventional methods<br />
for heritage documentation are in practice but have their own<br />
limitations - consuming a lot of time and resources and often resulting<br />
in technical errors. Additionally, architectural schools in<br />
the country have no training programmes or exposure to heritage<br />
recording available for their students.<br />
Since 1991, Aga Khan Cultural Service Pakistan (AKCSP)<br />
has been involved in monument conservation in the Northern Areas<br />
of Pakistan, with the active participation of local people.<br />
Conservation of the 700 year old Baltit Fort and 400 year old Shigar<br />
Fort are prime examples. During these projects on-site training<br />
of architects and engineers was offered, as well as summer<br />
internships for students from architectural schools. This latter to<br />
enhance exposure to firstly, conservation and secondly, to the architectural<br />
survey as a basic step before any intervention.<br />
Since 2005, on-site training programmes in EDM building<br />
and topographical surveys have been organised for local girls and<br />
boys, in order to build local capacity. These trained girls are now<br />
part of Women Social Enterprise (WSE) formed by AKCSP and<br />
working full time as an enterprise carrying out topographical and<br />
the architectural surveys in Pakistan. A team of architects and<br />
engineers were also given opportunities to extend their skills in<br />
architectural surveys whilst working on the projects of Khaplu<br />
Palace, the Wazir Khan Mosque Lahore and the topographical<br />
survey of the Walled City of Lahore.<br />
Key words: Vernacular, REDM, Conservation, Recording, Image<br />
rectification, Topographical Survey.<br />
Ιntroduction<br />
The conservation of the 700 year old Baltit Fort in Hunza by<br />
Aga Khan Cultural Service Pakistan (AKCSP is the Pakistani<br />
arm of Geneva based Aga Khan Trust for Culture’s Historic Cities<br />
Programme) demonstrated a strong regional innovative<br />
model of heritage conservation, long term sustainability and its<br />
use for local development. It also presented the concept of architectural<br />
documentation for practical conservation in Pakistan.<br />
The conventional manual documentation practiced was<br />
later applied to other AKCSP projects in the Northern Areas of<br />
Pakistan. All these vernacular monuments have no such previous<br />
records of drawings, images or iconographical sources.<br />
The repercussions of rapid development in the past four<br />
decades had already been observed on the built heritage of<br />
the remote Northern Areas of Pakistan. The high quality conservation<br />
work dictated AKCSP to upgrade the conventional<br />
recording practices of monuments and order them in a systematic<br />
way. In an area where the legislation regarding the<br />
protection and inventory of the monuments is not fully active,<br />
the documentation of vernacular monuments and settlements<br />
becomes even more crucial. Furthermore, international recognition<br />
in the form of UNESCO heritage awards for completed<br />
projects made AKCSP realize the process of documentation<br />
as being a specialized field. This was at a time when AKCSP<br />
had just finished conservation of the 400 year old Shigar Fort<br />
and had initiated the ground work for the conservation of the<br />
Khaplu Palace in Baltistan. Essentially, all the previous<br />
projects were following international guidelines for conservation<br />
but the more specific guidelines (Article 16, Venice Charter)<br />
relating to the precise recording and reinterpretation of<br />
monuments were slow to receive attention. Pursuing an advanced<br />
master’s studies in architectural conservation at Leuven,<br />
Belgium provided me with the chance of getting handson<br />
experience and exposure to recent practices in heritage<br />
conservation. REDM was one of the methods which I intro-<br />
IntroducIng edm survey For recordIng vernacular HerItage and sItes In PakIstan<br />
73
Figure 1. A 3D wire-frame model of Khaplu Palace<br />
Complex. Hundreds of years old historic agricultural walls and<br />
buildings documented using measured drawing technique, EDM (total<br />
station) survey and rectified photography.<br />
Figure 2. A complete 3D wire-frame model of the Khaplu Palace (north-eastern<br />
view).<br />
duced for the first time in Pakistan for heritage documentation,<br />
and Khaplu Palace was the first monument surveyed using<br />
this method. This method was further strengthened by using<br />
allied image rectification software.<br />
The Survey and Project Location<br />
Located in the rugged Karakoram mountain range at the<br />
height of 2500 meters, the Khaplu Palace is the finest surviving<br />
edifice of royal residence in Baltistan, Northern Areas. Its<br />
significance lies in its cultural importance as a former seat of<br />
royal government in the area, and in its quality as a building,<br />
both aesthetically and as an exemplar of traditional building<br />
typology with influences from neighbouring regions (Kashmir,<br />
Ladakh, China, and central Asia). As part of a wider cultural<br />
heritage support programme in Baltistan, the long term sustainability<br />
is one of the prime objectives set by AKTC-AKCSP<br />
for this project. Working closely with the local community the<br />
project is contributing to the revival of traditional wood and<br />
building crafts, income generation activities and capacity<br />
building of locals.<br />
Site surveys and documentation prior to any conservation<br />
and restoration works are now defined as the basic pre-requisite<br />
for understanding an historic building or site. This has<br />
been widely expressed in many national and international<br />
charters and conventions – from Athens Charter of 1933 to<br />
the Venice Charter of 1964 or the Burra of 1979. This discipline<br />
needs proper training, human resources and equipment.<br />
In the absence of any previous documentation efforts, the current<br />
documentation programme with EDM equipment was experimental<br />
in its own nature, its main objectives being:<br />
➧ Disseminate and build capacity in recording techniques<br />
with REDM.<br />
➧ Gather detailed information about a vernacular monument<br />
and site in the form of base drawings.<br />
➧ Detailed recording of the as-found state of the monument,<br />
which ultimately allows us to propose conservation and reuse<br />
plans.<br />
➧ Set an example of architectural surveying which would be<br />
available for researchers and experts for future studies.<br />
➧ After conservation, this documentation will provide us the<br />
basis for management, monitoring and maintenance of the<br />
site and monument.<br />
In a remote situation where documentation of heritage faces<br />
huge challenges including the lack of experts, communication,<br />
dissemination and standard guidelines, the basic aim of<br />
this documentation campaign was to address the cited chal-<br />
74 <strong>CIPA</strong> <strong>HERITAGE</strong> <strong>DOCUMENTATION</strong> BEST PRACTICES AND APPLICATIONS Series I, 2007 & 2009
lenges. Documentation is a process which continues during the<br />
conservation of any monument and is the only accurate tool for<br />
recording information in order to understand the structure, ultimately<br />
leading to the management of cultural heritage.<br />
The field survey, as a training process, was initiated in<br />
October 2005 primarily to cover the topographical features<br />
of this historic vernacular site. Initially, the field data was<br />
gathered with one total station (Leica TCR 405) and then<br />
downloaded on a computer and converted to vector form<br />
Figure 3. North view of Khaplu Palace with main entrance wooden loggia<br />
under restoration.<br />
with the help of LisCAD and AutoCAD. Later, the more comprehensive<br />
stage of documentation of the historic buildings<br />
was initiated in March 2006 with the aim to document the<br />
monuments for the practical conservation works. The conservation<br />
activities running simultaneously made this documentation<br />
campaign more challenging as we needed to<br />
record the as-found state of the monument and site. Therefore,<br />
more practical solutions were worked out to fit the time<br />
constraints and conservation activities. The inevitable combination<br />
of EDM survey and rectified photography was used.<br />
A combination of a field laptop, TheoLT and AutoCAD software<br />
for real time survey and Trextify for image rectification<br />
purpose was practiced.<br />
Drawings and Interpretation<br />
In this project EDM survey provided us an opportunity to interpret<br />
the obtained data in a variety of ways. Most of the team<br />
members knew the technique of architectural documentation<br />
using conventional manual measurement and drawing methods.<br />
The new EDM survey technique, therefore, was never going<br />
to be easy to understand and initially it was critical that I<br />
provided them common and easy examples. For this we initiated<br />
introductory lessons about the instruments and the future<br />
interpretation of collected data in the form of drawings. In<br />
a remote environment this was not an easy job to do and it was<br />
therefore important for us to overcome the limitations of our<br />
Figure 6. Rectified photography of western elevation of the 100 year old Darbar Khang.<br />
Figures 4 & 5.<br />
Floor plans of<br />
Khaplu Palace<br />
at level 0 and 1.<br />
IntroducIng edm survey For recordIng vernacular HerItage and sItes In PakIstan<br />
75
survey with new technology. Soon the team realised that this<br />
technique substantially reduced the amount of time and human<br />
resource required for the documentation in comparison<br />
to conventional and manual methods, and above all that the<br />
results are very precise and accurate.<br />
The team were also aware of the limitations of manual<br />
documentation methods. The inaccuracies in the manual documentation<br />
process due to the manual sketches, hand measurements<br />
and the conversion of manually drawn scaled drawings<br />
into vector drawing through a laborious scanning and the<br />
Figure 7. East elevation of Khaplu Palace site. Hundreds of years old historic agricultural walls and buildings are documented using EDM (total station) survey<br />
and rectified photography techniques. This drawing is a 3D wire-frame CAD model.<br />
Figures 8 & 9. Set of drawings produced for the restoration of wooden entrance loggia about 10 meters high. This set of drawings shows the structure and location<br />
of timber elements in the plan and section. Additionally, the sectional drawing shows the subsidence and bulge in the structure.<br />
Figures 10 & 11. This set of drawings shows the proposed interventions to restore the loggia structure.<br />
76 <strong>CIPA</strong> <strong>HERITAGE</strong> <strong>DOCUMENTATION</strong> BEST PRACTICES AND APPLICATIONS Series I, 2007 & 2009
drafting process were easily mitigated with this combination<br />
of EDM and rectified photography surveys.<br />
Since 2006, most of the architectural documentation<br />
has been completed in the form of floor plans, reflected<br />
ceiling plans, structural drawings, detail elevations<br />
of each room, cross sectional drawings, building<br />
elevations and a complete 3D wire frame model. Most<br />
of the major elevations and elevation features in the<br />
cross sectional drawings were completed with the help<br />
of image rectification software combined with EDM<br />
survey. Rectified photography has been used to map<br />
the condition of external and internal elevations of the<br />
monument and was later converted into vector form.<br />
Investigations and Conservation<br />
of Main Entrance Loggia<br />
Primarily, the data in form of CAD drawings produced<br />
with the help of EDM survey has been used to study the<br />
monument and its adaptation for reuse. Secondly, the<br />
data was key to identifying and studying the dilapidated<br />
parts of the monument. Total station has been extensively<br />
used during the investigations of the structure of<br />
the main entrance loggia of the palace. The abnormal tilt<br />
and the subsidence recorded with the help of EDM survey<br />
of the loggia at the floor level of level 1 revealed that<br />
this part of loggia was not structurally connected with<br />
the main building of the palace. The investigations<br />
showed in the structure a tilt of 14 cm and subsidence<br />
of 8 cm. Based on other such structural connections in<br />
the palace, the intervention proposal was implemented.<br />
A new connection and additional wooden beams were<br />
proposed. In order to remove the tilt and subsidence in<br />
the structure, hydraulic jacks and turning buckles were<br />
used. The process of lifting and pulling back of the structure<br />
to a satisfactory position was closely monitored with<br />
the help of total station and allied software.<br />
Conclusion<br />
As part of dissemination, in the past three and half<br />
years, a total number of 25 people were trained in topographical<br />
survey with EDM technique. Additionally, 10<br />
architects and engineers have also been trained in more<br />
advanced techniques of architectural building survey<br />
with EDM device and image rectification process. The<br />
process which was initiated on a vernacular monument<br />
in Northern Pakistan has now been actively practiced in<br />
the Walled City of Lahore, documenting the thick urban<br />
fabric and historical monuments of great importance.<br />
It’s been encouraging to see all this progress, but there<br />
is still a long way to go in spreading and sharing this<br />
knowledge with other actors in the field.<br />
In the context of Pakistan, the rate of uncontrolled<br />
development and the lack of updated technologies and<br />
expertise are the main causes of heritage loss and the main hindrance<br />
in documentation. Under these circumstances, the concerned<br />
authorities for cultural heritage should at least start updating<br />
the documentation process of deteriorated monuments in a<br />
more accurate and timely manner by utilising the best practices of<br />
EDM survey.<br />
Refrences<br />
Almagro, A., 2007. Traditional drawings versus new representation techniques.<br />
In: <strong>CIPA</strong> XX! International Symposium of Architectural Photogrammetry.<br />
01-06 October 2007, Athens, Greece.<br />
Bianca, Stefano, 2005. Karakoram: Hidden Treasures in the Northern Areas<br />
of Pakistan. Umberto Allemandi & C. for The Aga Khan Trust for<br />
Culture, Torino.<br />
Muhammad, Salman, 2006. Conservation and adaptive reuse of Khaplu<br />
Palace. Thesis Report, RLICC Katholike University, Leuven, Belgium.<br />
Figure 12. Traditional construction<br />
techniques are being implemented<br />
during the restoration of loggia.<br />
Figure 14. Lifting of loggia to a stable<br />
state with the help of hydraulic jacks.<br />
Figure 13. Lifting and pulling back the<br />
loggia to a stable state is being closely<br />
monitored with total station.<br />
Figure 15. Turning buckles are being<br />
used to pull back the tilted loggia.<br />
IntroducIng edm survey For recordIng vernacular HerItage and sItes In PakIstan<br />
77
Figure 16. North façade of Khaplu<br />
Palace. The wooden entrance loggia<br />
at the centre was the subject of<br />
major conservation activity in 2008.<br />
This restoration is very closely monitored<br />
with total station.<br />
Figure 17. Cross section at AA of Khaplu Palace. Rectified images were used<br />
extensively to document the features and damages of the monument. The<br />
abnormal tilt and subsidence in the entrance loggia at left is clearly visible.<br />
Figure 18. Cross section at DD of Khaplu<br />
Palace. The periodical extensions on the<br />
upper floors left some walls built on the<br />
non-load bearing roofs of lower levels.<br />
Figure 19. A complete 3D wire-frame model of Khaplu Palace. The north-western<br />
view of the Palace shows the severe damages on the western façade.<br />
78 <strong>CIPA</strong> <strong>HERITAGE</strong> <strong>DOCUMENTATION</strong> BEST PRACTICES AND APPLICATIONS Series I, 2007 & 2009
ABSTRACT<br />
The paper reports the result of measurement of the Gedongsongo<br />
temples and the surrounding topography using laser scanning<br />
technique. Gedongsongo is located in Semarang District, Middle<br />
Jawa Province, Indonesia. The research is carried out by the Geomatics<br />
Research Division of National Coordinating Agency of<br />
Surveys and Mapping (BAKOSURTANAL) is cooperation with<br />
Borobudur Heritage Conservation Office (HCO). BAKOSURTAN-<br />
AL has a program to investigate the suitability of relatively new<br />
instruments for surveys and mapping, while Borobudur-HCO<br />
concerns about documentation of cultural heritage objects in<br />
form of 3D model. Gedongsongo, located in a beautiful hillside<br />
of Mountain Ungaran, has nine temples grouped in five Gedong<br />
(complex of temples). Gedong-1, Gedong-2 and Gedong-3 and<br />
the topography surrounding the three complexes have been successfully<br />
measured. The result of measurement is still in form of<br />
point clouds based on the accuracy of the measurements, i.e.<br />
between 5-15 mm for the temples and 20-25 cm at 100 meters<br />
distance for the topography. The accuracy of the measurements<br />
and the integration of the 3D model results into the national coordinate<br />
system are still to be performed.<br />
Key words: 3D model, temple, topography, terrestrial laser scanning.<br />
Background<br />
3D model of gedongsongo temple<br />
and topography using terrestrial<br />
laser scanner technology<br />
Adi J. Mustafa, Fahmi Amhar<br />
Geomatics Research Division, National Coordinating Agency for Surveys and Mapping (BAKOSURTANAL),<br />
Indonesia, adijm2001@yahoo.com or adijm@bakosurtanal.go.id and famhar@yahoo.com<br />
Surveys and mapping activities are not limited to conventional<br />
works for mapping the earth surface. Many surveys and<br />
mapping instruments are developed to support various objectives.<br />
In archaeology, Geomatics technology has a significant<br />
potential to map and to document cultural heritage objects using<br />
medium and high resolution satellite imageries both from<br />
active and passive sensors, large format and linear array digital<br />
aerial camera, and other terrestrial instruments (Campana<br />
etc., 2009). One of the latest technologies is measurement<br />
and 3D modelling of cultural heritage object using terrestrial<br />
laser scanner instrument.<br />
Three dimensional (3D) models of cultural heritage objects<br />
are needed to document people’s collective memory about the<br />
objects. When unwanted condition, like earthquake, flood, volcanic<br />
eruption, or vandalism, takes place so that the objects<br />
are destroyed, then the reconstruction of the objects can be<br />
done accurately. Directorate General of Historical and Archaeological<br />
Object (DG-HAO), the Ministry of Culture and Tourism<br />
(2007) announced with heritage cultural object conservation<br />
through improvement the quantity and the quality of practical<br />
research, human resources, and establishing an excellent information<br />
system based on informatics technology in a form<br />
of Geographic Information System. 3D modelling can also assist<br />
related institutions to process the inscription of the heritage<br />
objects on the World Heritage List based on the World<br />
Heritage Convention [World Heritage Center, 2008]. Clear<br />
identification on location and area of the object plotted in an<br />
up-to-date map are required. The description should be completed<br />
with photographs. To fulfil the requirement, 3D model<br />
can be used as an effective representation.<br />
The Geomatics Research Division of BAKOSURTANAL has<br />
a program to investigate relatively new instrument for surveys<br />
and mapping. This paper reports the use of terrestrial laser<br />
scanner Leica HDS-3000 to map and model Gedongsongo<br />
Temple and its surrounding topography. The objective is to<br />
have an experience and skill of using the instrument and to<br />
produce a 3D model of the temple and its topography. The authors<br />
hope that the research gives a significant contribution to<br />
the Indonesian government for conserving heritage objects.<br />
Therefore the research in carried out in cooperation with<br />
Borobudur Heritage Conservation Office (Borobudur-HCO),<br />
which is a unit of DG-HAO.<br />
3d model oF gedongsongo temPle and toPograPHy usIng terrestrIal laser scanner tecHnology<br />
79
Application of Laser Scanner<br />
for Heritage Object<br />
There are several methods to map and model 3D objects. Four<br />
of them are conventional terrestrial surveys, close range photogrammetry,<br />
airborne LiDAR and terrestrial laser scanner (Siu,<br />
2007). Both airborne LiDAR and terrestrial laser scanner use<br />
laser to measure distance from the instrument to objects.<br />
In principle laser scanner has five components, (1) a<br />
transmitter, laser pulse in HDS-3000, (2) a transmitter optics,<br />
two rotating mirrors in horizontal and vertical direction<br />
in HDS-3000 (3) a receiver optics, (4) a detector, and (5) an<br />
electronic system for data acquisition, processing, evaluation,<br />
display, and storage (Figure 1).<br />
Figure 1. Optical components of a laser scanning system, from (Weitkamp,<br />
2005).<br />
3D laser scanner works using high-speed laser to scan the<br />
surface of objects which can capture a huge amount of 3D coordinate<br />
points of the surface model. These 3D coordinates<br />
can be integrated to form “point clouds” and high-resolution<br />
3D models by using certain software. The distance of an object<br />
is determined by measuring the time difference of the<br />
emitted laser pulse and its return signal travel to and from the<br />
objects and the instrument. The angle of emission is controlled<br />
by two rotating mirrors.<br />
Laser scanning technique has been used in 3D documentation<br />
important cultural objects, like the 3D mapping Old<br />
Star Ferry Pier area (Siu, 2007) using HDS-3000.<br />
Meanwhile, in Indonesia cultural heritage area mapping<br />
has been rarely done. Borobudur HCO mapped Borobudur<br />
Temple, Prambanan Temple and other temples using HDS-<br />
3000 too, when an earthquake hit Jogjakarta city and the surrounding<br />
area in May 27th, 2006 to identify the damage on<br />
the temples. However, there is no scientific publication about<br />
the result of the mapping. Therefore the measurement of Gedongsongo<br />
temple becomes an important study to test the capability<br />
of laser scanning technique to map the temples and<br />
its surrounding topography.<br />
Some technical specifications of HDS-3000 are summarized<br />
in Table 1.<br />
Table 1. Some technical specifications of Leica HDS-3000.<br />
Specifications HDS3000<br />
Metrology method Pulsed time of flight<br />
Field of view 3600 horizon. and 2700 vert.<br />
Optimal scan distance 1 m – 100 m<br />
Scanning speed up to 1.800 points/seconds<br />
Accuracy in distance (50m) 6 mm (single measurement)<br />
Angular resolution 60 micro-radians<br />
Divergence/spot size in 50m ≤ 6 mm<br />
Calibrated video camera RGB 64 mega-pixels,<br />
spatially rectified<br />
Gedongsongo Area<br />
Gedongsongo area is located in the Ungaran Mountain area,<br />
Candi Village, Ambarawa Sub-district, Semarang District,<br />
Middle Jawa Province, Indonesia. Gedong means building or<br />
temple, Songo means nine. Gedongsongo has, as reflected<br />
from its name, nine Hindu temples. These temples are however<br />
grouped in five complexes of temples.<br />
The temples of Gedongsongo were found by Raffles in<br />
1804. It is a Hindu culture heritage from the time of Syailendra<br />
Kingdom in the ninth century. The temples are located on<br />
the height on 1,300 meter above the sea level with a mountainous<br />
air temperature of about 19-270C.<br />
The nine temples are surrounded with a beautiful landscape<br />
and pine-forest. Figure 2 shows part of the beautiful<br />
landscape.<br />
The position of five complexes of temples or Gedong,<br />
measured using GPS, is shown in Figure 3. In the figure contour<br />
lines, street or foot-path and river stream line are taken<br />
from the 1:25,000 scale topographic map produced by BA-<br />
KOSURTANAL.<br />
It is shown that the river crosses and divides Gedongsongo area<br />
into two parts. In the valley, near the river stream, hot volcano<br />
gas comes out from a small hole. A small hot spring<br />
swimming pool is located also there.<br />
Gedong-3 and Gedong-4 are located in almost the same<br />
height, while the highest temple is Gedong-5.<br />
Planning of and Process<br />
of Measurement<br />
Instrument and Tie Points Location<br />
Location of instrument and the target of tie points must be<br />
planned carefully before measurement. It is necessary to minimize<br />
un-scanned parts of temples and/or topography. Topographic<br />
measurement needs more systematic locations to ensure<br />
that the tie points can be seen from three or more locations<br />
in order to integrate all measurements and to get viewable<br />
height differences. In this study topography around Gedong-2<br />
and Gedong-3 is constructed from five instrument locations.<br />
80 <strong>CIPA</strong> <strong>HERITAGE</strong> <strong>DOCUMENTATION</strong> BEST PRACTICES AND APPLICATIONS Series I, 2007 & 2009
Figure 2. Above photo is Gedong-2 potrayed from near of Gedong-3 location. The background in the lower place is Ambarawa-city. Below photo shows Gedong-3<br />
with background of pine-forest and hillside of the Ungaran Mountain.<br />
Figure 3. Location map of five complexes of Gedongsongo (symbolized with<br />
stars) drawn in the UTM Zone 49-South projection.<br />
Measurement Process<br />
Before measurement, the instrument can be set up to capture<br />
images in 00-3600 horizontal and certain angle interval in<br />
vertical direction. The images can be used to determine which<br />
part of landscape the surrounding area to be scanned and in<br />
which interval of angle the location of the temple by using<br />
measurement scripts. Once the scripts are set up, the measurement<br />
will be performed automatically.<br />
In a normal weather, i.e. no rain and no fog, measurement<br />
of temple and topography from one point needs about two<br />
hours time. Detail measurement describing location of instrument,<br />
scripts, resolution and time is summarized in Table 2.<br />
Table 2. Total measurement setting.<br />
No Instrument Location Script Resolution<br />
1. N-E of Gedong-1 Temple 5mm<br />
2. S-W of Gedong-1 Temple 5mm<br />
3. N-W of Gedong-3 Big Temple<br />
Small Temple<br />
Topography<br />
Target<br />
4. S-E of Gedong-3 Big Temple<br />
Small Temple<br />
Topography<br />
Target<br />
10mm<br />
10mm<br />
20cm/100m<br />
2mm<br />
10mm<br />
10mm<br />
20cm/50m<br />
2mm<br />
5. North of Gedong-2 Topography 25cm/100m<br />
6. 50m S-W of Gedong-1 Topography 20cm/100m<br />
7. North of Gedong-2 Temple 15mm<br />
8. South of Gedong-2 Topography 25cm/100m<br />
Temple 15mm<br />
9. 100m S-E of Gedong-2 Topography 25cm/100m<br />
3d model oF gedongsongo temPle and toPograPHy usIng terrestrIal laser scanner tecHnology<br />
81
Result and Discussion<br />
The result of measurement is divided into 3D temple and topography.<br />
This study has measured Gedong-1, Gedong-2 and<br />
Gedong-3. Each temple is measured from two points, while<br />
topography around Gedong-2 and Gedong-3 are measured<br />
from six points.<br />
Temple<br />
Figure 4. Measurement of<br />
Gedong-1 from SW<br />
direction (above) and<br />
from NE direction<br />
(middle). Left image<br />
shows location of the laser<br />
scanner, NE from the<br />
temple.<br />
Figure 4 and Figure 5 show the result of the measurements of<br />
temples.<br />
Part of the temples has not been scanned, because the<br />
measurement is carried out only from two points. Further<br />
analysis from the result, especially related to the detail of<br />
measured result has to be performed in collaboration with experts<br />
and practitioners in cultural heritage objects.<br />
Topography<br />
Gedongsongo area has a unique and beautiful natural hilly<br />
landscape. Like depicted in Figure 3, the temples are located<br />
in separate positions with relatively long distances from one to<br />
another. The distance between Gedong-1 and Gedong-2 is<br />
about 380 meters, while Gedong-2 and Gedong-3 are separated<br />
with about 120 meters. Therefore, surveys and measurements<br />
of Gedongsongo’s topography cannot be separated in<br />
our study.<br />
As mentioned in Table 3, positions of the instrument for<br />
measuring topography are the same as positions of it for measuring<br />
the temples except one location, namely at the distance<br />
of 100 meters in the SE direction from Gedong-2. The results<br />
of topography 3D points are shown in Figure 6.<br />
The result of topography model shows that the integration<br />
of some measurements from five points can be done well using<br />
at least four tie points between adjacent measurements.<br />
82 <strong>CIPA</strong> <strong>HERITAGE</strong> <strong>DOCUMENTATION</strong> BEST PRACTICES AND APPLICATIONS Series I, 2007 & 2009
The targets of tie points is used to integrate the model if only the error<br />
of them is less than or equal to 4 mm.<br />
In the scanning process, laser signal ran to trees and leaves. Therefore,<br />
the measurement has not resulted in earth terrain or elevation<br />
model yet. It is still in a form of surface model. The result needs to be<br />
processed carefully to produce 3D topography of earth terrain. The result<br />
has not been connected to the national coordinate reference yet. It<br />
is in a local coordinate system. However, applying a simple analysis,<br />
the 3D model of topography can be displayed from side cross-section,<br />
as shown in Figure 7. Using the display, the height different among<br />
some positions can be determined visually.<br />
According to the measurement, height difference between Gedong-2<br />
and Gedong-3 is about 28.6 meters. It is consistent to the data<br />
from the topographic map (Figure 3). Gedong-2 is located near the<br />
contour line of 1,350 m and Gedong-3 is near the contour line of<br />
1,375 m, so that the height difference is 25 m.<br />
Closing Remark<br />
Figure 5. Measurement<br />
of Gedong-2 (above)<br />
and Gedong-3 (middle).<br />
Left image shows<br />
location of the laser<br />
scanner, NW from the<br />
temples.<br />
The paper has described and discussed the result of<br />
measurement of the temples and the topography of<br />
Gedongsongo area using laser scanning techniques.<br />
Measurement of three temples, i.e. Gedong-1, Gedong-2<br />
and Gedong-3 and the topography of about<br />
400 m x 400 m (16 hectares) around Gedong-2 and<br />
Gedong-3 and about 150 m x 150 m (2.25 hectares)<br />
around Gedong-1 has been finished in 3 days or<br />
about 21 hours, with an assumption of 7 hours/day<br />
working.<br />
From this research the authors recommend the<br />
use of laser scanning techniques to map temple areas<br />
and other cultural heritages in Indonesia. By this,<br />
the instrument owned and maintained by Borobudur-<br />
HCO and also trained and skilful human resources<br />
can be utilized optimally to support the program of<br />
Ministry of Culture and Tourism through DG-HAO. A<br />
comprehensive recommendation will be formulated<br />
systematically together with experts and practitioners<br />
from archaeology.<br />
This preliminary study shows that laser scanning<br />
techniques can be applied to map topography<br />
accurately. However post processing is still required<br />
to produce 3D earth terrain model and to be used<br />
as height information in the topographic or the base<br />
map.<br />
3d model oF gedongsongo temPle and toPograPHy usIng terrestrIal laser scanner tecHnology<br />
83
Acknowledgements<br />
The authors would like to thank the Borobudur-HCO that<br />
actively participates in the study and provides the instrument<br />
HDS-3000 to be used in the laser scanning measurement.<br />
We are also thankful to the DG-HAO for the cooperation.<br />
References<br />
Siu Dominic, 2007, A Recent Case of 3D Survey for Heritage<br />
Conservation in Civil Engineering and Development Department<br />
- The Old Star Ferry Pier, Hong Kong Institute<br />
of Surveyors “Annual Conference 2007 Surveyors in Heritage<br />
- Preserving and Adding Value”, 13 October 2007,<br />
JW Marriott Hong Kong.<br />
Campana S., Sordini M., Remondino F., 2009, Integration of<br />
Geomatics Techniques for The Digital Documentation of<br />
Heritage Areas.<br />
http://www.photogrammetry.ethz.ch/general/persons/fabio/EARSEL08_rome.pdf<br />
(accessed 18 August 2009)<br />
Weitkamp C., 2005, Lidar: Introduction, in Takashi F. and Tetsuo<br />
F. (editors), Laser Remote Sensing, CRC Press, Taylor<br />
and Francis Group, Boca Raton.<br />
Dirjen Sejarah dan Purbakala, Dept. Kebudayaan dan Pariwisata,<br />
2007, Kebijakan Pengembangan Sejarah dan<br />
Purbakala 2008 (Policy on Conservation Historical and<br />
Archeological Objects), Rakor Depbudpar (Coordination<br />
Meeting of Ministery of Culture and Tourism), 28 Maret<br />
2007.<br />
http://www.budpar.go.id/filedata/2823_944-PAPARAN-<br />
SEPUR3.pdf (accessed 18 August 2009)<br />
Subdir Konservasi, Dirjen Sejarah dan Purbakala (DG-HAO),<br />
Pemeliharaan Benda Cagar Budaya (BCB) dan Situs<br />
(Conservation of Cultural Heritage).<br />
http://www.budpar.go.id/filedata/4554_1363-PEMELI-<br />
HARAANBENDACAGARBUDAYA1.pdf (accessed 18 August<br />
2009)<br />
UNESCO World Heritage Centre, 2008, Operational Guidelines<br />
for the Implementation of the World Heritage Convention.<br />
Wikipedia, Candi Gedong Songo.<br />
http://id.wikipedia.org/wiki/Candi_Gedong_Songo (accessed<br />
18 August 2009).<br />
Figure 6. Above image is topography of Gedong-3, measured from Gedong-2;<br />
Middle image shows area around Gedong-2 and Gedong-3 viewed vertically; Below<br />
image shows the total landscape around Gedong-2 and Gedong-3.<br />
Figure 7. Above image shows a cross-section from South. Gedong-2 is located in<br />
5.8 m height from local reference, while Gedong-3 in 34.4 m; Below image is the<br />
same cross-section but from North.<br />
84 <strong>CIPA</strong> <strong>HERITAGE</strong> <strong>DOCUMENTATION</strong> BEST PRACTICES AND APPLICATIONS Series I, 2007 & 2009
ABSTRACT<br />
Beijing old city has been changed on a large scale and the walls<br />
of the old city had been demolished entirely because of population<br />
increasing and infrastructure developing. However, historic<br />
notes in Beijing old city are objects of architectural or cultural interest<br />
since it includes a large number of traditional buildings<br />
and monuments dating from various historic periods. These<br />
buildings and monuments together with their access and surrounding<br />
areas are often a unified construction total, whose spatial<br />
design and planning characteristics had been fully recorded<br />
and documented by means of some analogy methods, such as<br />
the topography map, aerial photo, sand table and city map etc.<br />
before 1960s. Nowadays, it is feasibility to make a digital restoration<br />
of the old city notes, such the old city walls and Siheyuan<br />
are restored by virtual technique using the existed spatial information<br />
and documents. Therefore it is necessary to create a spatial<br />
system to manage, organize and protect the existed spatial<br />
information and further, combine those data with a variety of<br />
quality information, such as picture, videos, old maps and city<br />
plans and other available data. In this paper the background, a<br />
project design of digital construction is implemented to rescue<br />
the available spatial data and make their exploitation.<br />
Key words: Old City, Historic Heritage, Spatial Information, Digital<br />
Restoration, GIS<br />
Introduction<br />
Digital Construction for Spatial<br />
Documentation of Beijing Old City<br />
Ruoming Shi, Guang Zhu, Ling Zhu, Ruiying Wang, Yuqing Mu<br />
Beijing University of Civil Engineering and Architecture<br />
Email: ruoming@yahoo.com<br />
Before the middle of 1960s last century, Beijing’s enceinte<br />
had little been changed; the wall of the old city had been kept<br />
about 500 years since the Ming Dynasty (A.D.1368-1644)<br />
and the Qing Dynasty (A.D.1644-1911). After the middle of<br />
1960s, Beijing old city has been changed on a large scale and<br />
the wall of the old city had been dismantled entirely because<br />
of population increasing and infrastructure developing. However,<br />
an amount of non digital spatial documents of the old<br />
city, such as city map, topographic map sheet, aerial photo<br />
and city building and sand table, have still been preserved.<br />
Therefore, it is an actually significances and feasible on the<br />
historical culture heritage protection and urban planning to<br />
apply the non digital spatial recordings to construct the digital<br />
interface for Beijing old city so far. Figure 1 shows two period<br />
city maps, (a) the Ming Dynasty, (b) the Qing Dynasty.<br />
The basic idea of the digital construction involves in researching<br />
the collection and procession methods of the multisources<br />
and multi-type spatial recordings of Beijing old city by<br />
colleting the large scale topographic map, ortho-image, and<br />
wood city sand table of 1950s, and researching organization,<br />
management and display methods of the multi-sources and<br />
multi-type spatial documents by designing a technique procedure<br />
and creating digital interface for the historical buildings<br />
and historical district in Beijing old city. Furthermore, a large<br />
number of buildings in the old city block belong to the state<br />
and private. Management and control of these properties under<br />
historic and present circumstances are very difficult almost<br />
impossible since many necessary information for that is<br />
not yet recorded. The creation of a spatial information system<br />
is expected to dramatically improve the situation and help to<br />
solve the problem. Practically the project aims at the reassessment<br />
of the functional use of spatial data and other relative<br />
information in the old city, most of them traditional.<br />
A project design of digital construction is implemented to<br />
rescue the available spatial data and make their exploitation.<br />
The enhancement of the existed spatial information collection<br />
and architectural heritage restoration of the old city are the research<br />
area undertaken by Beijing Municipal Science & Technology<br />
Commission with the technical assistance of the Digital<br />
Archives Laboratory of Beijing University of Civil Engineering<br />
and Architecture(BUCEA). There are three phases to carry<br />
out the project, the first phase is for collecting data and<br />
building a spatial information management system; the second<br />
phase is for making three dimensional (3D) restoration of<br />
dIgItal constructIon For sPatIal documentatIon oF beIjIng old cIty<br />
85
architectural heritage and the third phase is for integrating<br />
and displaying several of spatial data, 3D module, and multimedia<br />
of the old city. In addition, this paper describes an attempt<br />
on the first phase work of the project.<br />
Historical Notes of the Old City<br />
in Beijing<br />
(a) (b)<br />
The history of Beijing as a city may be traced back to about<br />
3000 years ago when a small town appeared on the present<br />
site of south-western Beijing. It was named Ji and then<br />
changed to Yan. At the beginning of the 10th century, it was<br />
the second capital of the Liao Dynasty. From then on, the old<br />
city had been the capital of the Jin, Yuan, Ming and Qing dynasties<br />
until 1911. A long history has left numerous famous<br />
historical sites which possess great aesthetic and cultural valleys.<br />
Beijing old city divides as two parts, the Forbidden City<br />
belongs to the inner city of the old city (Figure 1) and it locates<br />
a centre of the city and is splendid crystallization of ancient<br />
Chinese architectural art, but also a lot of traditional buildings<br />
surrounding outer city. The old city is an area protected by a<br />
special legislation, which rules the construction development<br />
and defines very strict building- and land-use regulations to<br />
avoid alteration of the existing characteristic architecture and<br />
style.<br />
Figure 1. Beijing old city maps, (a) the Ming Dynasty, (b) the Qing Dynasty.<br />
Old City Wall<br />
Chinese cities rarely centre on a castle. Instead, the city’s administrative<br />
centre is spread over a relatively large area, which<br />
may or may not be surrounded by a second set of “inner”<br />
walls similar in shape and construction to the main, outer<br />
wall. The wall of Beijing’s inner city was originally about 24<br />
kilometres in length. The outer wall to the city was 16 meters<br />
in width, while the imperial city’s wall was about 10 meters<br />
wide. The wall enclosing the Forbidden City still stands today,<br />
spanning 1,006 meters from south to north, and 786 meters<br />
from east to west. Thus the area of the Forbidden City is 72<br />
hectares. The ruler of Ming Dynasty began constructing the<br />
wall spanning 40 kilometres in 1419. In the 1950s and<br />
1960s, the majority of the wall was razed to develop the city.<br />
A section of the old city wall in Beijing has become an attraction<br />
for both travellers and local residents after a delicate renovation<br />
project. Figure 2 shows a plan of the walls of Beijing<br />
old city and Figure 3 shows two gates and towers photos of<br />
the old wall, Yongdingmen and Xizhimen.<br />
After the founding of the People’s Republic of China, a political<br />
dimension was added to the economic problem posed<br />
by city walls. In Beijing, for example, the proposed demolition<br />
of the city walls was at first opposed by experts ranging from<br />
architect Liang Sicheng, to Soviet advisor Mosin, on the<br />
86 <strong>CIPA</strong> <strong>HERITAGE</strong> <strong>DOCUMENTATION</strong> BEST PRACTICES AND APPLICATIONS Series I, 2007 & 2009
Figure 2.<br />
Plan of the walls<br />
of Beijing old city.<br />
grounds that the city walls of Beijing were the most sophisticated<br />
and well-preserved system of city walls in China. However,<br />
in 1958 summiteers intervened, and declared that the<br />
demolition of the old city wall was<br />
a political issue, by 1970 almost<br />
all of the city wall had been demolished.<br />
Si He Yuan<br />
A Siheyuan (quadrangles) is a historical<br />
type of residence that was<br />
commonly found throughout China,<br />
most famously in Beijing. The<br />
name literally means a courtyard<br />
surrounded by four buildings. Fully<br />
developed Siheyuan date back as<br />
early as the Western Zhou period<br />
(1122 BC to 256 BC), and exhibit the most outstanding and<br />
fundamental characteristics of Chinese architecture. They exist<br />
all across China and are the template for most Chinese architectural<br />
styles. Studies put the estimates at about over<br />
30,000 Siheyuan courtyards in Beijing old city.<br />
The four buildings of a Siheyuan are normally positioned<br />
along the north-south and east-west axes. The building positioned<br />
to the north and facing the south is considered the<br />
main house. The buildings adjoining the main house and facing<br />
east and west are called side houses. The northern, eastern<br />
and western buildings are connected by beautifully decorated<br />
pathways. These passages serve as shelters from the<br />
sunshine during the day, and provide a cool place to appreciate<br />
the view of the courtyard at night. The building that faces<br />
north is known as the opposite house. Behind the northern<br />
building, there would often be a separate backside building,<br />
the only place where two-story buildings are allowed to be<br />
constructed for the traditional Siheyuan.<br />
The city of Beijing originally was protected by huge walls,<br />
and each Beijing home also had a wall built around it. Walled<br />
Figure 3. Yongdingmen (top), Xizhimen (bottom).<br />
Figure 4. Si He Yuan of Beijing old city. Figure 5. Hu Tong of Beijing old city.<br />
houses were attached, forming a labyrinth old city with narrow<br />
paths connecting the maze. The Hutongs they formed were orderly,<br />
lined by spacious homes and walled gardens. Farther<br />
from the palace, and to its north and south, were the commoners,<br />
merchants, artisans, and laborers. Their Siheyuan<br />
were far smaller in scale and simpler in design and decoration,<br />
and the Hutongs were narrower. It is record as the 978<br />
Hutongs listed in Qing Dynasty and swelled to 1,330 by 1949.<br />
Figure 4 shows a classical Si He Yuan of Beijing old city and<br />
Figure 5 shows a typical Hu Tong of Beijing old city.<br />
Modern Beijing's population boom has made housing one<br />
of city's biggest challenges. Siheyuan today are typically used<br />
as housing complexes, hosting multiple families, with courtyards<br />
being developed to provide extra living space. The living<br />
conditions in many Siheyuan are considered squalid. In<br />
the 1990s, systematic demolition of old urban buildings took<br />
place in Beijing under rapid economic development. Siheyuan<br />
are being torn down to address, and the hutong area is<br />
rapidly disappearing, replaced by modern apartments and<br />
stores.<br />
dIgItal constructIon For sPatIal documentatIon oF beIjIng old cIty<br />
87
Protected Area<br />
Figure 6. Plan of protection area in Beijing old city.<br />
The Plan to Protect the Historical and Cultural Heritage of Beijing<br />
will be fully implemented. Special attention will be given<br />
to the protection of the royal city and the historical buildings<br />
situated along the ancient city axis and within the 25 historical<br />
and cultural protection areas, the protected major historical<br />
and cultural sites, the ancient urban water systems and<br />
the layout of the ancient city. The first group of Old City Conservation<br />
zones (25 zones with a total area of 1038 hectares)<br />
has been protected strictly in accordance with the Protection<br />
Plan approved by Beijing City in 2002. The protection of the<br />
second group of Old City Conservation zones (5 zones occupying<br />
249 hectares) concentrated efforts made between 2002<br />
and 2008 recovered or restored Beijing’s cultural relics in<br />
places named “two lines, five areas and six sites”. The “two<br />
lines” refer to the Middle Axis Avenue and the Chaobu Road.<br />
The “Five Areas” refer to the Shishahai scenery area, the Imperial<br />
College ancient architecture area, the Azure Stone<br />
Workshop commercial area, the Forbidden City scenery area<br />
and the Bell Tower and Drum Tower ancient street area in the<br />
old city. With all these, Beijing old city will achieve a balanced<br />
distribution and distinct presentation of its famous history and<br />
traditional culture (Figure 6). Nowadays, according to the Beijing<br />
Municipal Administration of Cultural Heritage, there are<br />
over 3,000 “well-preserved” courtyards remaining in Beijing,<br />
and over 539 are in Cultural and Historical Conservation Areas<br />
(Figure 7).<br />
The Project Underway<br />
A project design of digital construction is implemented to rescue<br />
the available spatial data and make their exploitation. Finally,<br />
with the rapid development of computer graphics, distributed-computing<br />
and Internet, it is possible to achieve Internet-based<br />
virtual old city restoration. There are three phases<br />
to carry out the project, in present, the first phase is working<br />
to collect data and building a spatial information management<br />
system and the second phase is working to make 3D restoration<br />
of some architectural heritage. The main technological<br />
procedure and their benefits are discussed as below.<br />
Data Preparation<br />
Figure 7. Renovation of the Siheyuan (top) and the Tower<br />
wall (bottom) of Beijing old city.<br />
The first phase of the project is the compilation of a digital<br />
framework for the whole area of the old city. This includes: the<br />
detailed recording of the 1950s situation, the creation of different<br />
layers of geometric information, each one of them contains<br />
the situation at various time periods, using all available information,<br />
e.g., topographic maps at a scale of 1:1000 and<br />
2000, any other geometric data at appropriate scales, such as<br />
a sand table of Beijing old city at a scale of 1:1000, made use<br />
of wood in 1950s, existing aerial photos at a scale of 1:2000,<br />
street maps compiled in 1950s, urban plot maps, plans of specific<br />
monuments, etc. The utilization of the available large<br />
scale aerial photos plays an important role for the creation of<br />
integrated surveys, which represent the development of the old<br />
city in the area through time. Figure 8, 9, 10, 11, 12 show two<br />
88 <strong>CIPA</strong> <strong>HERITAGE</strong> <strong>DOCUMENTATION</strong> BEST PRACTICES AND APPLICATIONS Series I, 2007 & 2009
(a) (b)<br />
Figure 8. Topological maps surveyed in 1950s, (a) 1: 2000, (b) 1:1000.<br />
Figure 9. Ortho-image of Beijing old city in 1959.<br />
(a)<br />
(b)<br />
Figure 10. Mosaic aerial photo of Beijing old city in 1949.<br />
Figure 11. Sand table of Beijing old city, 1:1000, made use of wood in 1950s.<br />
(a) Courtyard housing, (b) Forbidden City.<br />
dIgItal constructIon For sPatIal documentatIon oF beIjIng old cIty<br />
89
topographic maps, ortho-image, mosaic aerial photo, sand table<br />
and street map of Beijing old city in 1950s respectively.<br />
From those, combination of various data is used in order<br />
to provide a powerful tool for recording and monitoring the development<br />
in Beijing old city certain time. Further, a structured<br />
light scanning processing of that sand table and photogrammetric<br />
processing of that aerial photo will produce 3D geometric<br />
information about the architectures in the old city.<br />
This will include the city walls and their evolutions, the various<br />
traditional buildings with information about their heights and<br />
volumes. This document will be the basis for all subsequent<br />
actions towards part of the final goal of the project too.<br />
Figure 13.<br />
TLS and Scanning.<br />
(a) (b)<br />
Figure 12. Street maps of Beijing old city compiled (a) in 1940s, (b) in 1950s.<br />
Data Processing<br />
Technological route of data processing is described as follow<br />
as below:<br />
1) Collecting multi-source and multi-type data: Scanning<br />
and digitizing topological maps of 1: 1000; scanning air<br />
photos of 1:2000; scanning the sand table of 1:000 using<br />
a structured light system to acquire 3D point cloud of<br />
the city walls and some historical architectures, and scanning<br />
some existing historical buildings using a terrestrial<br />
laser scanner(TLS) to acquire 3D point cloud of the architecture<br />
in large scene (Figure 13). Adoping different tech-<br />
Figure 14. Simplified Triangle on the site<br />
Models of the Taihe Gate.<br />
90 <strong>CIPA</strong> <strong>HERITAGE</strong> <strong>DOCUMENTATION</strong> BEST PRACTICES AND APPLICATIONS Series I, 2007 & 2009
nique to acquire different type of historic spatial data,<br />
and meanwhile, take them to contract and correct for<br />
each other.<br />
2) Processing data: Transforming the scanning coordination<br />
of these data to unified Beijing local coordination system<br />
based on the topographic map in 1:1000, and then, making<br />
the geometry correction and joint respectively. The vetcor<br />
represents are archieved with extracting 3D models<br />
from the point cloud data scanning the buildings (Figure<br />
14) and scanning the sand table. Jointed and edited vector<br />
models will be enclosed the unified local coordinate<br />
system.<br />
3) Organizing and managing data: A basic framework is organized<br />
using the topological map of 1: 1000 of 1950s, other<br />
data are embedded in the basic framework, including the<br />
vector models which scanning from the old city model. The<br />
3D data and models are organized with multi-layer and tree<br />
structure to implement an effective visulization and management<br />
for large scene and details of the objects.<br />
Spatial Information Management System<br />
Basic spatial data frame and spatial data database, the qualitative<br />
(attributes) and their geometric characteristic, multimedia<br />
of Beijing old city are constructed using GIS<br />
software,database and integrated developing method to store,<br />
record, manage and utilize them. An interface and index of<br />
these digital documents are developed to search and display<br />
the historical spatial information and other related data of the<br />
old city using integrated technology. The linkage windows of<br />
two dimensional (2D) and 3D data in the interface are designed<br />
to display this main city walls and important histoic<br />
buidlings. The system’s architecture allows the integration of<br />
additional geometric or other type of information, such as<br />
“time window” can be opened to show the spatial documents<br />
which are in different historical term of Beijing. Figure 15<br />
shows a preliminary interface of the spatial information management<br />
system.<br />
Animation and Visualization<br />
Figure 15. Preliminary<br />
interface of the spatial<br />
information management<br />
system.<br />
The completion of this project will be achieved through the final<br />
phase, in which animations and virtual walk-through paths<br />
along selected routes are going to be produced. These works<br />
will be done after the finalization of the third phases of the<br />
project and it is scheduled that they will refer to the old city<br />
walls and part of the protected area mentioned above.<br />
An application of 3D animations will be developed; all<br />
buildings will be presented in real time and the buildings of<br />
special interest will be represented in detail. In this task terrestrial<br />
images will be draped on the 3D models produced in<br />
previous phases. The level of detail on the 3D models will be<br />
such that would enable the users to perform their own actions.<br />
Finally, with the rapid development of computer graphics, distributed-computing<br />
and Internet, it is possible to achieve Internet-based<br />
virtual old city restoration.<br />
dIgItal constructIon For sPatIal documentatIon oF beIjIng old cIty<br />
91
Concluding<br />
During the recent years there was a significant development of<br />
the techniques and the methods used for the digital geometric<br />
documentation of Beijing old city and historical monuments;<br />
in parallel, collection data techniques of the structured<br />
light instrument and terrestrial laser scanner, software for the<br />
management of spatial information, 3D data, virtual environments<br />
and the Internet is developed. These technique tools<br />
pushed the development of the restoration of the old city, and<br />
especially the detailed models of the historical city notes<br />
which were dismantled in various historic heritage cities using<br />
a lot of existing spatial documents.<br />
Beijing Municipal Science & Technology Commission realized<br />
that the protection of that spatial information for Beijing<br />
old city is necessary, and the creation of such a spatial information<br />
management system; in cooperation with the Beijing<br />
University of Civil Engineering and Architecture, the design of<br />
a specific project is made and the execution of the first phases<br />
is implemented. During its application procedure, the results<br />
and the products of the created spatial information management<br />
system will be analyzed and criticized, together with<br />
the difficulties and the problems for the development of the<br />
system. This will lead to corrections and adjustments of the<br />
whole process for the integrated implementation in the whole<br />
area. Finally, some recommendations about the further improvements<br />
and the possible perspectives of the system will<br />
be given, for a possible use by Beijing public services and organizations<br />
as well as library of BUCEA.<br />
Acknowledgement<br />
This paper was supported by the Funding Project “Study on<br />
key technique for spatial information digitization of Beijing old<br />
city“, Project No. Z090406005809011, which is from Beijing<br />
Municipal Science & Technology Commission, and by the<br />
Funding Project “Digital City and Architecture Simulation“,<br />
Project No. PHR 20070101, which is for Academic Human<br />
Resources Development in Institutions of Higher Learning Under<br />
the Jurisdiction of Beijing Municipality.<br />
References<br />
Beijing Cultural Heritage Protection Center, 2005. “ Protection of<br />
the old city of Beijing: Good Plan”.<br />
http://en.bjchp.org/english/mzpl_view.<br />
asp?NewsID=76(accessed July, 2009)<br />
Crespi, M., De Vendictis, L., Fabiani, U., Luzietti, L., Mazzoni, A.,<br />
2005. The Archaeological Information System of the underground<br />
of Rome: A challenging proposal for the next future. In:<br />
Proceedings of <strong>CIPA</strong> XX International Symposium, Turin, Italy,<br />
IAPRS, vol. XXXVI, part 5/C34, pp. 209-214.<br />
El-Hakim, S.F., Beraldin, J.A., Gonzo, L., Whiting, E., Jemtrud, M.,<br />
Valzano, V., 2005. A hierarchical 3D reconstruction approach<br />
for documenting complex heritage sites. In: Proceedings of<br />
<strong>CIPA</strong> XX International Symposium, Turin, Italy, IAPRS, vol.<br />
XXXVI, part 5/C34, pp. 790-795.<br />
H.-J. Przybilla, J.Peipe, 2007. 3D Modeling of Heritage Objects by<br />
Fringe Projection and Laser Scanning Systems, In: Proceedings<br />
of <strong>CIPA</strong> XXI International Symposium, Athens, Greece, ISPRS,<br />
vol. XXXVI-5/C53, pp. 615-618<br />
Hou Renzhi, 2007. “City Wall and Gate of Beijing”. http://oldbeijing.<br />
org/Article/Class4/Class42/11047.html (accessed July, 2009)<br />
Lelo, K., Travaglini, C.M., 2005. The GIS-based historical atlas of<br />
Rome. In: Proceedings of <strong>CIPA</strong> XX International Symposium,<br />
Turin, Italy, IAPRS, vol. XXXVI, part 5/C34, pp. 891-895.<br />
N. Charkiolakis, Ch. Ioannidis, Ch. Kantza, I. Keramida, A. Koumna,<br />
M. Leni, M. Liakak, V. Pragast, M. Psallida, A. Georgopoulos,<br />
2007. Spatial Information System for 3D Documentation of<br />
Plaka, the Historical Centre of Athens, In: Proceedings of <strong>CIPA</strong><br />
XXI International Symposium, Athens, Greece, ISPRS, vol.<br />
XXXVI-5/C53, pp. 769-774<br />
Wikipedia, 2008. “Siheyuan”. http://en.wikipedia.org/wiki/Siheyuan<br />
(accessed July, 2009)<br />
Yuan Yuan, Follow our China Today Reports in 2005. “Preserving<br />
the Soul of Beijing”. http://www.chinatoday.com.cn/English/<br />
e2005/e200502/p28.htm(accessed July, 2009)<br />
92 <strong>CIPA</strong> <strong>HERITAGE</strong> <strong>DOCUMENTATION</strong> BEST PRACTICES AND APPLICATIONS Series I, 2007 & 2009
ABSTRACT<br />
Since the destruction of the Giant Buddhas in Bamiyan in the<br />
year 2001 consolidation and emergency stabilization works under<br />
the auspices of UNESCO and ICOMOS have progressed. The<br />
more than 1000m spanning cliff wall was scanned with a terrestrial<br />
laser scan system and a 3D model of the cliff was derived<br />
from the measurements. After removing the large fragments from<br />
the niche of the Eastern 38m Buddha a detailed laser scan was<br />
conducted and a textured 3D model of the empty niche generated<br />
in order to study the damages of the back wall in detail. From<br />
historic images and contour line drawings a 3D surface model of<br />
the destroyed 38m Buddha figure was created and successfully<br />
integrated into the 3D textured model of the scanned niche. The<br />
result has been processed for presentation in an immersive 3D<br />
Cave Automated Virtual environment - CAVE at the Virtual Reality<br />
Center at RWTH Aachen University. The complex real-time<br />
stereo projection is computed by a high-end computer cluster<br />
that adapts the projected image to the spectator’s view by head<br />
tracking with infrared devices. The previous state can be compared<br />
to the actual condition and serves as a communication and<br />
planning tool among the different expert groups working on the<br />
site for discussion on ongoing stabilization and restoration measures<br />
and future consolidation works. It is now possible to generate<br />
conventional 2D documentation material (sections, plans)<br />
precisely from any part of the virtual model in order to plan and<br />
conduct further detailed damage assessments and analysis on<br />
site. The virtual model incorporates the results of scientific explo-<br />
* Corresponding author<br />
Laser scan documentation and virtual<br />
reconstruction of the Buddha figures<br />
and the archaeological remains (Bamiyan)<br />
G. Toubekis 1 ,* I. Mayer 2 , M. Döring-Williams 2 , K. Maeda 3 , K. Yamauchi 3 ,<br />
Y. Taniguchi 3 , S. Morimoto 4 , M. Petzet 5 , M. Jarke 6 , M. Jansen 1<br />
1. RWTH Aachen University, Aachen Center for Documentation and Conservation, 52056 Aachen, Germany<br />
(toubekis, jansen)@sbg.arch.rwth-aachen.de<br />
2. Technical University Vienna, Department of Art History, Karlsplatz 13/251, 1040 Vienna, Austria<br />
3. Japan Center for International Cooperation in Conservation, NRICPT, 13-43 Ueno Park,Tokyo, Japan<br />
4. Nara National Research Institute for Cultural Properties, 2-9-1 Nijo-cho, Nara, Japan<br />
5. ICOMOS Germany, P.O. Box 100 517, 80079 Munich, Germany<br />
6. RWTH Aachen University, Information Systems & Database Technology, 52056 Aachen, Germany<br />
jarke@dbis.rwth-aachen.de<br />
rations and detailed damage assessments. It will serve as demonstration<br />
and experimentation model when exploring the possibilities<br />
of a future anastylosis of portions of the figure. The system<br />
was adapted to the needs of an exhibition on Gandhara Art<br />
in Germany in a special installation set-up reducing the amount<br />
of data to a minimum in order to achieve a real time rendering of<br />
the 3D model of the entire cliff and the reconstructed 38m Buddha<br />
figure with limited computer resources. The documentation<br />
work and the virtual reconstruction are embedded in the long<br />
term management plan for the entire World Heritage Site.<br />
Key words: Cultural Heritage Management, 3D, Laser Scanning,<br />
Modelling, Visualization.<br />
Introduction and History of the Site<br />
The Bamiyan Valley in Afghanistan is located at a height of<br />
2500m around 250km NW of the capital Kabul within the<br />
Hindu-Kush mountain range backed by 4000-5000m high<br />
massive peaks. The valley extends for several kilometres following<br />
the Bamiyan river as a tributary to the Kunduz river<br />
system and part of the large Amudarya water basin known as<br />
the Oxus River in ancient times. The Buddhist monastic cave<br />
sanctuaries and dwellings line up for several kilometres on the<br />
north side of the valley facing south leaving the fertile plane<br />
open for agriculture (Fig. 1). The site of the Giant Buddha figures<br />
extends for 1,5km comprising more than one thousand<br />
caves located at the broadest part of the valley. Situated within<br />
the crossroads of the civilizations of the East and the West<br />
Bamiyan is regarded as an exceptional testimony and out-<br />
laser scan documentatIon and vIrtual reconstructIon oF tHe buddHa FIgures and tHe arcHaeologIcal remaIns (bamIyan)<br />
93
Figure 1: The site of the Bamiyan Buddhas in October 2004 with the empty niches (view in NE direction).<br />
standing representation of Buddhist art in the Central Asia region.<br />
Remarkable archaeological remains of fortifications and<br />
settlements from the Islamic Ghaznavid and Ghurid period are<br />
also located in the proximity. During many centuries these valleys<br />
served as passageway for the intercontinental trade along<br />
the routes of the Silk Road.<br />
The caves at the site of the Bamiyan Buddhas have been<br />
carved into the cliff during the 3rd to 8th century A.D. The ensemble<br />
of the Giant Buddha figures of Bamiyan has been known<br />
as the world largest depiction of a standing Buddha figure from<br />
the first written records by the travelling Chinese monk Xuanzang<br />
who visited Bamiyan in 629 A.D. Carved deeply into the<br />
soft conglomerate of the cliff the “Big” Western Buddha measured<br />
55m and in a distance of 800m to the east the so called<br />
“Small” Eastern Buddha rose up 38m. In between the two<br />
standing figures several seated figures of Buddha were carved<br />
out also from the sedimentary rock. The Giant Buddha figures<br />
mark the most western extension of the early Buddhist Gandhara<br />
School of art. Due to the artistic expression of its mural<br />
paintings Bamiyan became a genuine centre for Buddhist art in<br />
the Hindu-Kush region in the course of time.<br />
First illustrations of the Bamiyan Buddhas were presented<br />
in the first half of the 19th century by Alexander Burnes as<br />
part of his travel memoirs from India to Persia (Burnes 1834)<br />
and have been copied various times by others travellers. In the<br />
beginning of the 20th century the Délégation Archéologique<br />
Française en Afghanistan (DAFA) initiated comprehensive research<br />
on the site. The French mission conducted first conservation<br />
works on the mural paintings and executed emergency<br />
restoration in endangered instable caves. An accurate topographic<br />
map of the valley was drawn by Jacques Meunie in<br />
1936 and a comprehensive photographic documentation of<br />
the condition of the monument was elaborated (Hackin & Meunie<br />
1933; Hackin, Carl & Meunie 1959). The political instability<br />
in the region following World War II led to an interruption<br />
of research activities. Bamiyan and its special cave art came<br />
into focus again in the second half of the 20th century (Miyaji<br />
1976; Tarzi 1977; Klimburg-Salter 1989). In that period also<br />
a year long restoration campaign started initiated by national<br />
authorities with the aid of the Government of India dedicated<br />
to prepare the site for tourism activities.<br />
Special mention has to be given to the remarkable documentation<br />
and interpretation activities that where carried out by<br />
Japanese research teams in the 1960-1970´s; first by Nagoya<br />
University and then by the Kyoto University Archaeological Mission<br />
to Central Asia. They conducted a year long photographic<br />
survey of all cave structures around the vicinity of the Giant<br />
Buddhas and also in the nearby Kakrak and Foladi Valley using<br />
contemporary stereographic and photogrammetric techniques<br />
during the documentation process (Higuchi 1984).<br />
With the Soviet invasion and outbreak of a long year war<br />
in that region silence came over Bamiyan until the worldwide<br />
outcry against the destruction of the Giant Buddha figures at<br />
the very beginning of the 21st century. International intervention<br />
and protest could not prevent their complete destruction<br />
ordered by the Taleban leadership in March 2001. By the end<br />
of 2003 the Cultural Landscape and Archaeological Remains<br />
of the Bamiyan Valley have been nominated a UNESCO World<br />
Heritage Site according the 1972 World Heritage Convention<br />
comprising eight individual areas representing artistic and religious<br />
developments from the 1st to the 13th century AD.<br />
UNESCO/ICOMOS Safeguarding<br />
Campaign for the Preservation<br />
of the Bamiyan site<br />
Already very early after the fall of the Taliban regime in 2002<br />
an UNESCO fact finding mission took place to Bamiyan. Prof.<br />
Michael Jansen of RWTH Aachen University, Prof. Michael<br />
Petzet President of the International Council on Monuments<br />
and Sites (ICOMOS) and Prof. Kosaku Maeda for National Research<br />
Institute of Cultural Properties Tokyo (NRICPT) among<br />
other international experts examined the situation on the site.<br />
The technical aspects of the mission revealed that within the<br />
rubble of dust and sand many fragments from the destroyed<br />
figures could be found with original surface features. While<br />
the detonations destroyed the Western Buddha (Fig. 2) almost<br />
entirely at the site of the Eastern Buddha portions of the figure<br />
survived the explosion (Santana 2002).<br />
A concept for the preservation of these fragments and the<br />
long term conservation of the remains has been first presented<br />
by the president of ICOMOS International (Petzet 2002). Con-<br />
94 <strong>CIPA</strong> <strong>HERITAGE</strong> <strong>DOCUMENTATION</strong> BEST PRACTICES AND APPLICATIONS Series I, 2007 & 2009
Figure 2: Condition of Eastern 38m Buddha before and after the destruction.<br />
Figure 3: Tangible Heritage Elements of the Cultural Landscape of Bamiyan.<br />
servation activities started in 2003 with the UNESCO Campaign for the Preservation<br />
of the Bamiyan Site funded by the Japanese Government. A Japanese survey<br />
team by PASCO Inc. set up the coordinates for a site reference system and produced<br />
a detailed topographic map of the central Bamiyan valley based on groundtruethed<br />
analysis of IKONOS satellite data and aerial images provided by the Afghan<br />
Geodesy and Cartography Head Office (AGCHO). The PASCO team also realized<br />
a 3D laser scan of the entire cliff, the niches of the Giant Buddhas and several<br />
caves in order to document the condition after the detonation and to prepare site<br />
plan material for the next stages of the program (PASCO 2003). Damage assessments<br />
on the condition of the mural paintings could be elaborated by the Japanese<br />
team of Prof. Kosaku Maeda and Kazuya Yamauchi of National Research Institute<br />
for Cultural Properties Tokyo (NRICP 2004). Furthermore the Japan Center for International<br />
Cooperation in Conservation initiated a comprehensive conservation intervention<br />
in selected caves in order to prevent further deterioration of the murals.<br />
The scientific analysis revealed many new<br />
findings that are discussed in detail in<br />
(Yamauchi, Taniguchi & Tomoko 2007).<br />
On the lateral sides of the niches that<br />
were in danger to collapse completely due<br />
to the impact of the detonations emergency<br />
consolidations had to be realized<br />
by the Italian rock-climbers from RODIO<br />
Inc. (Margottini et. al. 2005). With funding<br />
from the Culture Section of the German<br />
Foreign Office ICOMOS is actively<br />
involved since 2003 in the international<br />
expert campaign of UNESCO for the<br />
Safeguarding of the Bamiyan World Heritage<br />
Site (ICOMOS 2005; Petzet 2009).<br />
Aim is to salvage the remaining rock fragments<br />
exposed to the forces of wind and<br />
water and to store them in temporary<br />
shelters. Furthermore the stabilization of<br />
the detached mud plaster surfaces in situ<br />
is being carried out and investigations on<br />
treatment solutions for their preservation<br />
on the long term. RWTH Aachen Center<br />
for Documentation and Conservation<br />
(RWTHacdc) is documenting the recovery<br />
works of the Buddha fragments in close<br />
collaboration with restorers and stone<br />
conservators of ICOMOS and UNESCO.<br />
Also in this context RWTHacdc conducted<br />
a survey on the vernacular architecture<br />
of the valley and its important traditional<br />
irrigation techniques (Fig. 3).<br />
From the finding RWTHacdc elaborated a<br />
Cultural Master Plan for Bamiyan. The<br />
new plan provides a more detailed picture<br />
on the cultural assets of the area than the<br />
map that was the basis for the inscription<br />
as World Heritage Site. This Master Plan<br />
(Fig. 4) was adopted by the Afghan authorities<br />
in March 2006 and serves as<br />
guideline for the sustainable development<br />
of the entire valley promoting the cultural<br />
and ecological values of Bamiyan.<br />
Due to the heavy contamination of the<br />
area with unexploded ordnance remaining<br />
from year long fighting in this area all<br />
activities on the site have to be executed<br />
under the supervision of national de-mining<br />
experts together with the Afghan Ministry<br />
for Culture. All works are embedded<br />
in the recommendations of the UNESCO<br />
Expert Working Group for the Preservation<br />
of the Bamiyan Site (UNESCO 2006)<br />
which is coordinating the efforts of the<br />
different international teams.<br />
laser scan documentatIon and vIrtual reconstructIon oF tHe buddHa FIgures and tHe arcHaeologIcal remaIns (bamIyan)<br />
95
Figure 4: Cultural<br />
Master Plan<br />
of the Bamiyan<br />
valley and map<br />
from UNESCO<br />
nomination file.<br />
Three-Dimensional Documentation<br />
and Virtual Environments for<br />
Visualization and Communication<br />
While the works at the site of the Western Buddha (55m)<br />
niche are still ongoing the removal of debris in the niche of the<br />
Eastern Buddha (38m) was completed by autumn 2006. In<br />
cooperation with the Technical University of Vienna (Dept. Art<br />
History - Prof. Marina Döring) a 3D Laser Scan could be realized<br />
by Irmengard Mayer to document the condition of the<br />
cleaned niche prior to the installation of a scaffold for the following<br />
consolidation works at the back wall (Fig. 5-6).<br />
A Riegl Laser Measurement System Z420i in combination<br />
with a Canon EOS 1Ds (f=20mm, 10 Megapixel) digital cam-<br />
(a) Riegl Z420i (b) Detail of back wall<br />
Figure 5: Laser Scanner (a) and detail of laser scan (b).<br />
era mounted on top of the scanner was used. The scanner allows<br />
a very flexible alignment of the resolution according to<br />
the scan size and the scan distance (1.2m up to 1000m) by<br />
adjusting the angle of the moving laser light (0.12-0.02degree).<br />
Additionally to the measured point cloud of the laser<br />
scanner a set of pictures is taken automatically after each<br />
scan by the on top mounted digital camera. Every time the<br />
digital camera is mounted on the scanner body a manual calibration<br />
(mounting calibration) has to be performed by manually<br />
assigning characteristic features visible in the scan to the<br />
digital pictures. Due to the known internal calibration values<br />
the colour information of each pixel from the digital image is<br />
automatically assigned to the measured point cloud. The used<br />
commercial software package RiScan Pro 1.2 is provided by<br />
Figure 6: Final result of Laser Scan in shaded mode.<br />
96 <strong>CIPA</strong> <strong>HERITAGE</strong> <strong>DOCUMENTATION</strong> BEST PRACTICES AND APPLICATIONS Series I, 2007 & 2009
(a) (b)<br />
Figure 7: (a) Eastern Buddha 38(m) drawing courtesy of Prof. Higuchi Kyoto<br />
University Archaeological mission to Central Asia (b) 3D model derived from<br />
isoline drawing.<br />
the laser scanner manufacturer Riegl.<br />
A LEICA Total Station TCR 1105 was used for measuring<br />
all scan positions exactly and for linking the newly obtained<br />
measurements with the UTM reference-system and the Site<br />
Control Points established by the Japanese survey team of<br />
PASCO. In close range to the most eastern Ground Control<br />
Point B3 and complementary to already existing fix points of<br />
the site reference system a new fix point directly in front of<br />
the Eastern Buddha niche was determined and fixed into the<br />
ground.<br />
To reach a sufficient precision of the final model the resolution<br />
was set to ensure a point distance equal 8mm on the<br />
surface of the cliff stone. For triangulation of the final mesh<br />
from the measurement points of the Eastern Buddha niche<br />
the Software QTSculptor v2.85 of Polygon Technology was<br />
used. In this case 1.2 million triangles were created by the<br />
software out of the 77 million measurement points. The last<br />
step is the assignment of the digital images on the mesh. The<br />
images have been applied automatically using the mounting<br />
calibration assigned on site.<br />
The scan procedure and the generation of the 3D model<br />
of the Eastern Buddha have been described in detail in<br />
(Jansen et. al. 2008).<br />
Photogrammetric methods for the documentation of the<br />
entire Bamiyan Cliff have been explored first by Yoshiyuki<br />
Ushikawa of the National Research Institute for Cultural Properties<br />
in Nara in the course of the Japanese explorations<br />
1970-1978. The entire cliff was documented by means of<br />
stereoscopic analysis of metric images taken during the field<br />
campaign. A scaled isoline drawing of the entire cliff was<br />
drawn afterwards including both Giant Buddha figures<br />
Figure 8: Textured 3d model of Eastern 38m Buddha integrated<br />
in model of niche.<br />
(Higuchi 1984). The Western Buddha (55m) was also documented<br />
with stereo metric means by a Swiss survey team (Kostka<br />
1974) during a topographical exploration of undocumented<br />
valleys in Eastern Afghanistan. Automated methods for 3D<br />
model generation of the Western Buddha (55m) based on the<br />
Swiss image pairs of 1974 have been explored by ETH Zürich<br />
(Grün, Remondino & Zhang 2002).<br />
From the documentation of the site prepared by the Archaeological<br />
Mission to Central Asia at Kyoto University in the<br />
years 1972-1978 the team at RWTH Aachen obtained a high<br />
resolution scan (6800x10400 pixel) of the original 1/50<br />
scale ink drawing of the contour line interpretation from the<br />
Eastern Buddha (38m) sculpture.<br />
In this drawing each of the 10 cm isohypse contour lines<br />
is clearly readable and was manually digitized. The 3D surface<br />
of the Eastern Buddha was generated with Geomagic Studio<br />
v.10 Software (Fig. 7). Based on characteristic features visible<br />
in the contour line drawings and still traceable at the site the<br />
surface model could be orientated within the 3D model of the<br />
niche generated from the laser scans by manual alignments.<br />
The results where presented first time on the occasion of the<br />
5th UNESCO Expert Working Group Meeting for the Preservation<br />
of the Bamiyan Site in December 2006 at RWTH Aachen<br />
University. The immersive virtual environment BARCO CAVE<br />
(Cave Automatic Virtual Environment) at the Virtual Reality<br />
Centre of RWTH Aachen University represents an advanced<br />
version of the system (Cruz-Neira, Sandin & Defanti 1993). It<br />
is used for research of multimodal and interactive 3D interactions<br />
and visualization of complex numerical and technical<br />
simulations in real time.<br />
The CAVE system is a cube of 3x3m that allows a five sided<br />
projection of stereo images onto the walls and ceiling. The<br />
resolution of images or videos projected is 1600x1200 pixels<br />
per plane using ten BARCO Sim6 Ultra projectors that project<br />
the stereo images.<br />
laser scan documentatIon and vIrtual reconstructIon oF tHe buddHa FIgures and tHe arcHaeologIcal remaIns (bamIyan)<br />
97
Figure 9: Immersive Virtual Environment CAVE.<br />
(a) Geological profile (b) Section<br />
Figure 10: Various Maps of the niche from 3D Model.<br />
The user of the Cave wears a pair of polarized glasses with<br />
attached reflectors so that his position in space is constantly<br />
measured by an optical tracking system based on six ARTtrack1<br />
cameras. To create a complete immersive 3D experience<br />
the viewpoint of the spectator is processed in real time<br />
and the stereo images are rendered accordingly by a PC Cluster<br />
of a total of ten Render Clients (Pentium IV, 4GB RAM<br />
Memory) connected to the projectors. One Master Station<br />
(Dual Xeon System - 4GB RAM Memory - NVIDIA GeForce<br />
6800 GT) controls the synchronization of all calculations with<br />
a specially designed application programmed in VISTA a cross<br />
platform VR Toolkit under development at RWTH Aachen.<br />
Up to five spectators with untracked polarized<br />
glasses fit into the projection space<br />
and can share the experience of the<br />
tracked user. Although the system can be<br />
folded up to a four segment screen of 12m<br />
length the spatial limitations and bulky<br />
projector installations are an obstacle in<br />
presenting this technology at other occasions<br />
than the research environment.<br />
Since it was desired to present the results<br />
to a larger audience at the Federal<br />
Exhibition Hall of Germany in Bonn within<br />
the context of the exhibition of Gandhara<br />
Art a passive stereo projection was<br />
realized by the Collaborative Virtual and<br />
Augmented Environments Group of Fraunhofer<br />
Institute for Applied Information<br />
Technology (FIT) in Bonn/Birlinghoven.<br />
A space of 50m² with a 3x4m projection<br />
screen was designed to be used by<br />
40 people at a time and a standard stereoscopic<br />
setting was chosen using low cost<br />
polarized paper glasses. A 3D Space<br />
Mouse was installed in the middle of the<br />
room to allow user interaction by moving<br />
the controller cap to simultaneously pan,<br />
zoom, and rotate on the fly. A set of fixed<br />
viewpoints were defined in the 3D scene<br />
and approached automatically when no<br />
user interaction took place. The setting allowed<br />
the user at any time to take over the<br />
navigation or let himself follow the predefined<br />
viewpoint that were approached automatically<br />
after a certain time interval.<br />
The installation was realized with the<br />
MORGAN framework developed by the<br />
FIT Institute. MORGAN is an extensible<br />
component based AR/VR framework, enabling<br />
sophisticated dynamic multi user<br />
AR and VR projects by addressing a large<br />
variety of input devices and by providing a<br />
sophisticated render engine (Ohlenburg<br />
et. al. 2004). In order to realize the real<br />
time rendering of the entire cliff scene including the niche of<br />
the Eastern Buddha and the reconstructed 3D model with the<br />
used computer system (Dell Precision T7400, Quad Core<br />
Xeon Extreme Processor, 4GB RAM, NVidia Quadro FX 4600)<br />
the data had to be reduced significantly to a total amount of<br />
200.000 triangles.<br />
Restoration and Management<br />
From the final 3D model further plans such as sections, views<br />
and orthophotos have been created from all viewpoints.<br />
The plans obtained from the high-precision measurements<br />
98 <strong>CIPA</strong> <strong>HERITAGE</strong> <strong>DOCUMENTATION</strong> BEST PRACTICES AND APPLICATIONS Series I, 2007 & 2009
are the basis for the documentation of the geological profile of<br />
this portion of the cliff. Tests on site revealed that the geological<br />
features of each fragment allow a precise identification of<br />
the composition of the conglomerate stone which is suitable<br />
to identify its place of origin based on geological profile matching<br />
(Urbat & Krumsiek 2004). The plans also serve as basis<br />
for further planning of necessary consolidation works conducted<br />
by ICOMOS. They give precise information on the existing<br />
geometry and the location and gradient of dangerous cracks.<br />
Based on these plans restoration works are currently underway<br />
by ICOMOS to reconstruct the destroyed separation<br />
walls between the ceremony halls at the bottom backside of<br />
the niche of the Eastern Buddha.<br />
Cultural heritage management includes the documentation<br />
of past and present conditions the evaluation of conservation<br />
concepts as well as the execution of measures. Decisive<br />
knowledge and a living framework of partners and methods<br />
are essential for conservators, architects, site managers and<br />
urban/regional planners as well as capacities that enable cooperation<br />
and support of involved stakeholder in order to ensure<br />
long term preservation goals.<br />
The situation in developing and post-conflict countries furthermore<br />
is dominated by insecurity issues with a devastating<br />
impact of the human resource sector. In the case of Afghanistan<br />
educational institutions have to be rebuilt simultaneously<br />
as the country has lost the experiences and knowledge accumulated<br />
by prior generations. In order to bridge the gap an<br />
intergenerational cooperation has to be initiated reactivating<br />
the accumulated knowledge of the Past. New channels of<br />
communication have to be established as the involved experts<br />
are dispersed globally crossing languages and research methods.<br />
Dispersed Information has to be made accessible by<br />
younger scientists using modern IT and scientific knowledge<br />
to actualize the knowledge on the site and monuments. Facing<br />
such problems conservation activities have to be prioritized<br />
and integrated in sustainable development plans that<br />
both meet the requirements of protecting the inherit value of<br />
a cultural site and the necessity to identify economic and social<br />
benefits such income generation from tourism activities to<br />
the local communities.<br />
The multidisciplinary approach within the various departments<br />
involved at RWTH Aachen University gave the opportunity<br />
to address some of these issues from a socio-technological<br />
viewpoint. Together with the Department for Databases<br />
and Information Systems (Prof. Mathias Jarke ) at RWTH<br />
Aachen University it is being examined how far current developments<br />
in collaborative work on multimedia artefacts and<br />
web-based learning approaches are applicable to Cultural Heritage<br />
Management scenarios. The addressed requirements include<br />
the promotion of awareness and knowledge raising activities<br />
about the existence and value of cultural sites to a<br />
growing amount of people by making use of contemporary<br />
technologies from Information and Communication Technologies<br />
domain. It is possible to combine conventional Low-Tech<br />
documentation approaches easily with small scale smart de-<br />
vices (e.g. GPS enabled camera) to ensure systematic collection<br />
of semantic pieces of information otherwise neglected.<br />
Such an approach allows the re-contextualisation of the multimedia<br />
artefact at a later stage. Also the situation on the<br />
ground has to be reflected realistically bearing in mind that<br />
ongoing looting of historical sites is a fact and that available<br />
human resources remain limited. One of the outcomes of this<br />
highly experimental oriented cooperation is the establishment<br />
of an Internet Community Portal dedicated to the sustainable<br />
development of the entire Bamiyan Valley (www.bamiyan-development.org).<br />
Capacity building activities in cultural heritage management<br />
and preservation remain an urgent priority and they have<br />
to be carried out in very close cooperation with the national institutions<br />
both in administration and education sector. The<br />
creation of a policy framework that involves national cultural<br />
and planning institutions as well as experts and stakeholders<br />
in order to create a sustainable protective environment is part<br />
of such an integrated planning approach.<br />
Conclusion<br />
The precision and high density of the laser scan measurements<br />
capture delicate details (original clay plaster and carved<br />
cliff surface) and facilitate the production of detailed 2D plans<br />
of the geometry of the niche (section, views) in almost all directions.<br />
Since our work is aimed to support the practical preservation<br />
and restoration works on site primary aim is to create a<br />
model serving as a means of communication that provides the<br />
general outline to all involved partners precise enough so that<br />
more specific observations and findings can be incorporated<br />
easily at a later stage. Also it is precise enough to contribute<br />
to the discussion process on the future of the site in the sense<br />
of work in progress without pre-assuming a final state that has<br />
to be achieved.<br />
While the extension of such an area as the Bamiyan site<br />
and the complexity of its management justify the usage of<br />
high-precision techniques for the documentation process the<br />
questions and purposes dealing with reconstruction have to be<br />
addressed carefully. The methodological approach has to reflect<br />
both technological and epistemological questions and<br />
has to be aware of its potentials and even more important of<br />
its limitations (Petzet 2002, 2008). In the case of the Giant<br />
Buddha figures of Bamiyan ethical components also have to<br />
be considered since the general discussion on physical reconstruction<br />
is going on (UNESCO 2006) and still far from being<br />
resolved decisively.<br />
Based on virtual models it is possible to study and to compare<br />
concepts for technical measures in the future in detail<br />
prior to their execution. Due to the enormous object size and<br />
the complexity of the niche it became clear that the original<br />
shape information of the destroyed Buddha figure is essential<br />
in order to make the spatial configuration of the monument<br />
readable and understandable again. In how far this shape has<br />
laser scan documentatIon and vIrtual reconstructIon oF tHe buddHa FIgures and tHe arcHaeologIcal remaIns (bamIyan)<br />
99
to be reconstructed in future interventions such as a full or<br />
partial anastylosis can now be evaluated comprehensively by<br />
making use of the CAVE at the Virtual Reality Laboratory situated<br />
at RWTH Aachen University.<br />
Acknowledgments<br />
This work is supported by the Culture Section of the Foreign<br />
Office of Germany (Kulturreferat Auswärtiges Amt) through<br />
the ICOMOS Project for the preservation of the remains of the<br />
Bamiyan Buddhas and by the German National Science Foundation<br />
(DFG) within the research cluster UMIC- Ultra High<br />
Speed Mobile Information and Communication established<br />
under the excellence initiative of the German Government. We<br />
thank Masanori Nagaoka from UNESCO for his help and also<br />
Prof. Minoru Inaba and Prof. Bunkyo Kin of the Institute for<br />
Research in Humanities at Kyoto University for making the<br />
contour line drawing available.<br />
Copyright<br />
The contour line drawing Fig. 7(a) and the related photographs<br />
are copyrighted material of Kyoto University Archaeological<br />
Mission to Central Asia and the National Research Institute for<br />
Cultural Properties Tokyo/Nara.<br />
Selected Bibliography<br />
References from Journals:<br />
Kostka, R., 1974. Stereophotogrammetrische Aufnahme des großen<br />
Buddha von Bamiyan. Afghanistan Journal, 1(3), pp. 65-74.<br />
References from Books:<br />
Burnes, S.A., 1834. Travels Into Bokhara: Narrative of a voyage by<br />
the river Indus. Memoir of the Indus and its tributary rivers in<br />
the Punjab, J. Murray.<br />
Cruz-Neira, C., Sandin, D.J. & Defanti, T.A., 1993. Surround-screen<br />
projection-based virtual reality: the design and implementation<br />
of the CAVE. In: SIGGRAPH ‘93-Proceedings of the 20th annual<br />
conference on Computer graphics and interactive techniques.<br />
ACM Press, pp. 135-142.<br />
Hackin, J., Carl, J. & Meunie, J. (eds.), 1959. Diverses Recherches<br />
Archéologique en Afghanistan (1933-1940), Paris: Délégation<br />
Archéologique en Afghanistan -DAFA.<br />
Hackin, J. & Meunie, J. (eds.), 1933. Nouvelles Recherches Archéologiques<br />
à Bamiyan, Paris: Délégation Archéologique en Afghanistan<br />
- DAFA.<br />
Higuchi, T., 1984. Bamiyan. Art and Archaeological researches on<br />
the Buddhist cave temples in Afghanistan 1970-78, Dohosha.<br />
ICOMOS, 2005. Afghanistan - <strong>Icomos</strong> Actions in Afghanistan. In:<br />
M. Truscot et. al. (eds.) Heritage at Risk 2004/2005, K.G.<br />
Saur, p. 26-31.<br />
Jansen, M. et. al., 2008. Laser scan measurement of the niche and<br />
virtual 3D representation of the Small Buddha in Bamiyan. In:<br />
Axel Posluschny et. al. (eds.) Layers of perception: proceedings<br />
of the 35th International Conference on Computer Applications<br />
and Quantitative Methods in Archaeology (CAA); Berlin,<br />
Germany, April 2-6, 2007 , Kolloquien zur Vor- und Frühgeschichte,<br />
10, Bonn: Habelt, pp. 83-90.<br />
Klimburg-Salter, D., 1989. The Kingdom of Bamiyan, Naples: Istituto<br />
per il Medio ed Estremo Oriente (ISMEO).<br />
Margottini, C. et. al., 2005. Emergency Intervention for the Geo-Mechanical<br />
Conservation of the Niches of Bamiyan Buddhas<br />
(Northern Afghanistan), In: H. F. Kyoji Sassa et. al. (eds.) Landslides-Risk<br />
Analysis and Sustainable Disaster Management, pp.<br />
75-79.<br />
Miyaji, A., 1976. Wall paintings of Bamiyan Caves: stylistic analysis.<br />
In Japan-Afghanistan Joint Archaeological Survey in 1974. Kyoto:<br />
Kyoto University Archaeological Mission to Central Asia, pp.<br />
17-31.<br />
NRICP, 2004. Protecting the World Heritage Site of Bamiyan. Key<br />
issues for the Establishment of a Comprehensive Management<br />
Plan, Tokyo: National Research Institute for Cultural Properties.<br />
Japan Center for International Cooperation in Conservation.<br />
Ohlenburg, J. et. al., 2004. The MORGAN Framework: Enabling Dynamic<br />
Multi-User AR and VR Projects. In VRST ‘04: Proceedings<br />
of the ACM symposium on Virtual reality Software and<br />
Technology. Honk Kong, pp 166–169.<br />
Petzet, M., 2002. Anastylosis or Reconstruction - the conservation<br />
concept for the Remains of the Buddhas of Bamiyan. In: Strategies<br />
for the World Heritage. Preservation in a globalized World.<br />
Proceedings of ICOMOS Spain for the ICOMOS 13th General<br />
Assembly 2002, Madrid, pp. 189-192.<br />
Petzet, M., 2008. Das Fragment als Denkmal: Die Buddhas von<br />
Bamiyan. In: Das Denkmal als Fragment - Das Fragment als<br />
Denkmal. Denkmale als Attraktionen: Jahrestagung der Vereinigung<br />
der Landesdenkmalpfleger, June 10-13, 2007 Esslingen<br />
a. N., Arbeitshefte des Landesamtes für Denkmalpflege Baden-<br />
Württemberg. Stuttgart, Esslingen a. N.<br />
Petzet, M. (ed.), 2009. The Giant Buddhas of Bamiyan, Berlin:<br />
Bäßler.<br />
Tarzi, Z., 1977. L´ Architecture et le Décor Rupestre des Grottes de<br />
Bamiyan, Paris.<br />
Yamauchi, K., Taniguchi, Y. & Tomoko, U. (eds.), 2007. Mural Paintings<br />
of the Silk Road: Cultural Exchanges Between East and<br />
West, Tokyo: Japan Center for International Cooperation in Conservation,<br />
National Research Institute for Cultural Properties,<br />
Tokyo.<br />
References from Other Literature:<br />
Grün, A., Remondino, F. & Zhang, L., 2002. Reconstruction of the<br />
Great Buddha of Bamiyan, Afghanistan. In: International Archives<br />
of Photogrammetry and Remote Sensing. (ISPRS) Technical<br />
Commission V Symposium 2002. Close-Range Imaging,<br />
Long-Range Vision, Corfu (Greece), Vol. XXXIV, Part 5, pp.<br />
363-368.<br />
PASCO, 2003. Final Report for the Preparation of Topographic<br />
Maps and 3-Dimensional Model of the Bamiyan and Foladi<br />
Cliffs. UNESCO/Japan Funds-in-Trust Project for the Safeguarding<br />
of the Bamiyan Site, Tokyo: Pasco Corp.<br />
Santana, M., 2002. Report on the UNESCO/ICOMOS mission to<br />
Bamiyan 2002, RWTH Aachen Center for Documentation and<br />
Conservation.<br />
Urbat, M. & Krumsiek, K., 2004. Paleo- and Rockmagnetic Criteria<br />
for the Reconstruction of the Giant Buddha Statues, Bamiyan /<br />
Afghanistan. In Geophysical research abstracts, Volume 6,<br />
EGU 1st General Assembly. Nice, France.<br />
References from websites:<br />
UNESCO, 2006. Recommendations of the UNESCO/ICOMOS Expert<br />
Group for the Safeguarding of the Bamiyan site (5th meeting),<br />
Available at: http://whc.unesco.org/en/events/354, accessed<br />
30.05.2010.<br />
100 <strong>CIPA</strong> <strong>HERITAGE</strong> <strong>DOCUMENTATION</strong> BEST PRACTICES AND APPLICATIONS Series I, 2007 & 2009
4<br />
Future Trends<br />
in Heritage Documentation<br />
P. Patias<br />
Aristotle University of Thessaloniki, Department of Cadastre, Photogrammetry and Cartography,<br />
Univ. Box 473, GR-54124 Thessaloniki, patias@auth.gr<br />
New work habits, new research opportunities, and even new forms of institutions reform the CH documentation<br />
activities and consequently force photogrammetry to offer its services in many aspects. Photogrammetry<br />
provides large amounts of highly detailed, very accurate, geo-referenced, 3-D vector and texture data,<br />
with stereo-viewing abilities and metadata information. This constitutes its comparative advantage over<br />
other techniques and procedures.<br />
Evaluating the current status and envisaging the future evolution of CH documentation, one could note<br />
that:<br />
➧ Classic technology is very mature and the applications based on it are straightforward. Therefore, there<br />
are many different applications reported, and this has a favourable impact on the end-users, since it<br />
attracts their attention.<br />
➧ New technology is entering the picture at a growing rate and this drives innovative research. This fact<br />
gives rise to rapidly emerging new concepts and, as a spin-off, it attracts participation from related disciplines.<br />
➧ In addition to the photographic imaging systems, 3-D scanners and other non-imaging sensors play an<br />
important role in heritage and will continue to progress. The variety starts from airborne LIDAR systems<br />
for terrain/surface modelling and site mapping, followed by mid-range scanners for facades/buildings<br />
mapping, and goes down to close range 3-D scanners for detailed documentation of finds, artefacts<br />
and sculptures. The spectrum of technology will include range sensors with time-of-flight, phase<br />
difference or triangulation using laser points, fringe or other patterns projection. The challenge in Cultural<br />
Heritage applications is therefore the sometimes very complex data fusion from these heterogeneous<br />
sources.<br />
➧ New issues are entering the research agenda, like standardization issues, systems for quality management,<br />
intellectual property issues. It is quite important to note that, although conformance to intrinsic<br />
quality measures (i.e. standards) will always be necessary, it is only one part of the story. Quality can<br />
only be determined by “fitness for use”. Ultimately, quality evaluation needs to include user demands.<br />
<strong>CIPA</strong> <strong>HERITAGE</strong> <strong>DOCUMENTATION</strong> BEST PRACTICES AND APPLICATIONS<br />
101
Achilli V., 17<br />
Amhar F., 79<br />
Bragagnolo D., 17<br />
Chiba M., 65<br />
Döring-Williams M., 93<br />
Egels Y., 29<br />
Fabris M., 17<br />
Fangi G., 21<br />
Fernández J.J., 41<br />
Finat J., 41<br />
Héno R., 29<br />
Authors Index<br />
Jansen M., 93<br />
Jarke M., 93<br />
Kaneda A., 55<br />
Katayama Y., 65<br />
Kim J., 59<br />
Kim S., 59<br />
Maeda K., 93<br />
Martínez J., 41<br />
Mayer I., 93<br />
Menin A., 17<br />
Morimoto S., 93<br />
Morimoto T., 65<br />
Mu Y., 85<br />
Muhammad S., 73<br />
Mustafa A., 79<br />
Patias P., 9, 101<br />
Peipe J., 35<br />
Perez-Moneo J.D., 41<br />
Petzet M., 93<br />
Przybilla H.-J., 35<br />
Salemi G., 17<br />
San José J.I., 41<br />
Santana M., 9<br />
Shi R., 85<br />
Taniguchi Y., 93<br />
Toubekis G., 93<br />
Tsioukas V., 49<br />
Wang R., 85<br />
Yamauchi K., 93<br />
Zhu G., 85<br />
Zhu L., 85<br />
103