Head of Human Resources wins HR Director of the ... - BNP Paribas
Head of Human Resources wins HR Director of the ... - BNP Paribas
Head of Human Resources wins HR Director of the ... - BNP Paribas

You also want an ePaper? Increase the reach of your titles
YUMPU automatically turns print PDFs into web optimized ePapers that Google loves.
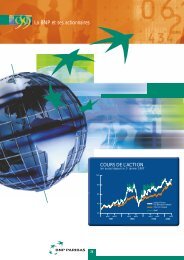
• As <strong>of</strong> 31 December 2003, <strong>the</strong> <strong>BNP</strong> <strong>Paribas</strong><br />
share was listed at EUR 49.92, up 28.56%<br />
compared with 31 December 2002, when it was<br />
listed at EUR 38.83. By way <strong>of</strong> comparison,<br />
during 2003 <strong>the</strong> Cac 40 index increased by<br />
16.12%, <strong>the</strong> Euro Stoxx 50 index by 15.68%<br />
and <strong>the</strong> DJ Euro Stoxx Bank index by 30.98%.<br />
• Between 2 January 2001 and 31 December<br />
2003, <strong>the</strong> <strong>BNP</strong> <strong>Paribas</strong> share price gained<br />
7.12% on average, whereas <strong>the</strong> Cac 40,<br />
DJ Euro Stoxx 50 and DJ Euro Stoxx Bank<br />
indexes respectively lost 38.65%, 41.28%<br />
and 21% over <strong>the</strong> same period.<br />
• <strong>BNP</strong> <strong>Paribas</strong>’ market capitalisation totalled<br />
EUR 45.1 billion as <strong>of</strong> 31 December 2003,<br />
representing <strong>the</strong> 3 rd -largest capitalisation<br />
in <strong>the</strong> Cac 40 index (2 nd -largest in terms <strong>of</strong> free<br />
float), and <strong>the</strong> 9 th -largest in <strong>the</strong> Euro Stoxx 50,<br />
as against 5 th and 13 th , respectively, a year<br />
earlier. As <strong>of</strong> 31 December 2003 and during<br />
almost all <strong>of</strong> <strong>the</strong> year, <strong>BNP</strong> <strong>Paribas</strong><br />
was <strong>the</strong> leading Eurozone bank in terms <strong>of</strong><br />
market capitalisation.<br />
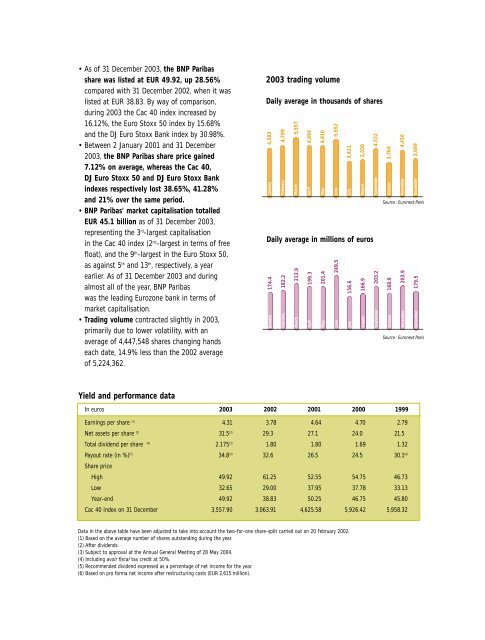
• Trading volume contracted slightly in 2003,<br />
primarily due to lower volatility, with an<br />
average <strong>of</strong> 4,447,548 shares changing hands<br />
each date, 14.9% less than <strong>the</strong> 2002 average<br />
<strong>of</strong> 5,224,362.<br />
Yield and performance data<br />
2003 trading volume<br />
Daily average in thousands <strong>of</strong> shares<br />
Data in <strong>the</strong> above table have been adjusted to take into account <strong>the</strong> two-for-one share-split carried out on 20 February 2002.<br />
(1) Based on <strong>the</strong> average number <strong>of</strong> shares outstanding during <strong>the</strong> year.<br />
(2) After dividends.<br />
(3) Subject to approval at <strong>the</strong> Annual General Meeting <strong>of</strong> 28 May 2004.<br />
(4) Including avoir fiscal tax credit at 50%.<br />
(5) Recommended dividend expressed as a percentage <strong>of</strong> net income for <strong>the</strong> year.<br />
(6) Based on pro forma net income after restructuring costs (EUR 2,615 million).<br />
4,583<br />
January<br />
4,789<br />
February<br />
5,557<br />
March<br />
4,894<br />
April<br />
4,810<br />
May<br />
5,552<br />
June<br />
3,421<br />
July<br />
3,550<br />
August<br />
Daily average in millions <strong>of</strong> euros<br />
174.4<br />
January<br />
182.2<br />
February<br />
213.9<br />
March<br />
199.3<br />
April<br />
201.4<br />
May<br />
249.5<br />
June<br />
156.6<br />
July<br />
166.9<br />
August<br />
4,522<br />
September<br />
203.2<br />
September<br />
3,764<br />
October<br />
4,416<br />
November<br />
3,699<br />
December<br />
Source : Euronext Paris<br />
168.9<br />
October<br />
203.9<br />
November<br />
179.5<br />
Décember<br />
Source : Euronext Paris<br />
In euros 2003 2002 2001 2000 1999<br />
Earnings per share (1) 4.31 3.78 4.64 4.70 2.79<br />
Net assets per share (2) 31.5 (3) 29.3 27.1 24.0 21.5<br />
Total dividend per share (4) 2.175 (3) 1.80 1.80 1.69 1.32<br />
Payout rate (in %) (5) 34.8 (3) 32.6 26.5 24.5 30.1 (6)<br />
Share price<br />
High 49.92 61.25 52.55 54.75 46.73<br />
Low 32.65 29.00 37.95 37.78 33.13<br />
Year-end 49.92 38.83 50.25 46.75 45.80<br />
Cac 40 index on 31 December 3,557.90 3,063.91 4,625.58 5,926.42 5,958.32