Social Landlords in Scotland: Shaping up for improvement
Social Landlords in Scotland: Shaping up for improvement
Social Landlords in Scotland: Shaping up for improvement

You also want an ePaper? Increase the reach of your titles
YUMPU automatically turns print PDFs into web optimized ePapers that Google loves.
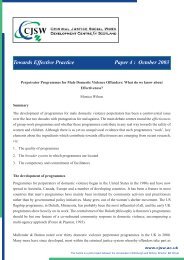
<strong>Social</strong> <strong>Landlords</strong> <strong>in</strong> <strong>Scotland</strong>: Shap<strong>in</strong>g <strong>up</strong> <strong>for</strong> <strong>improvement</strong>.4.26 As figure 6 shows, the amount of <strong>in</strong>come lost due to empty houses (voids)has improved significantly over the last five years. This is <strong>in</strong> large partbecause tenancy turnover has been fall<strong>in</strong>g – <strong>in</strong> other words, fewer houseshave become empty. Median percentage void losses <strong>for</strong> RSLs are lower than<strong>for</strong> local authorities, but are not show<strong>in</strong>g as much <strong>improvement</strong> over time.Indeed, over the last three years of the data shown, 28% of RSLs showed aworsen<strong>in</strong>g per<strong>for</strong>mance, with a further 13% report<strong>in</strong>g little or no change.Figure 6: Void losses <strong>for</strong> RSLs and local authorities: <strong>in</strong> total and median % rental<strong>in</strong>come lost£25,000,0002.5%£20,000,0002.0%Value of voids losses£15,000,000£10,000,000LAs: median% rent lost1.5%1.0%% voids losses£5,000,000RSLs: median% rent lost0.5%£02003/04 2004/05 2005/06 2006/07 2007/08LAs: total rent lostRSLs: total rent lost0.0%Source: APSRs 2003/04 - 2007/08 and Audit <strong>Scotland</strong>4.27 Despite the fall<strong>in</strong>g levels of tenancy turnover <strong>in</strong> the sector over recent years,RSLs’ average relet times only improved <strong>in</strong> 2007/08 <strong>for</strong> the first time afterseveral years of almost no change. Indeed, <strong>in</strong> the three years be<strong>for</strong>e this28% of RSLs reduced their average void turnaround times <strong>for</strong> all lets, while19% of RSLs got worse. Local authorities’ relet times have shown more<strong>improvement</strong>, but, as figure 7 shows, the median relet time of 51 days wasstill 29 days longer than <strong>in</strong> the RSL sector <strong>in</strong> 2007/08. And this comparespoorly with an equivalent English local authority figure of 31 days. Themedian figure <strong>for</strong> English RSLs with over 1,000 units is 37 days.25