economic development strategy and action plan 2009 ... - City of Barrie
economic development strategy and action plan 2009 ... - City of Barrie
economic development strategy and action plan 2009 ... - City of Barrie

You also want an ePaper? Increase the reach of your titles
YUMPU automatically turns print PDFs into web optimized ePapers that Google loves.
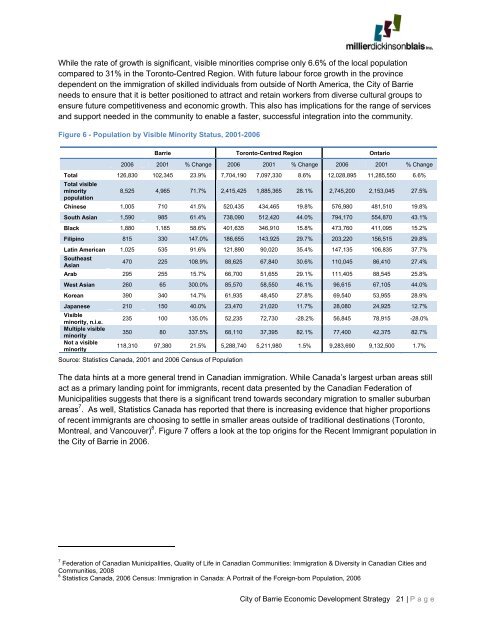
While the rate <strong>of</strong> growth is significant, visible minorities comprise only 6.6% <strong>of</strong> the local population<br />
compared to 31% in the Toronto-Centred Region. With future labour force growth in the province<br />
dependent on the immigration <strong>of</strong> skilled individuals from outside <strong>of</strong> North America, the <strong>City</strong> <strong>of</strong> <strong>Barrie</strong><br />
needs to ensure that it is better positioned to attract <strong>and</strong> retain workers from diverse cultural groups to<br />
ensure future competitiveness <strong>and</strong> <strong>economic</strong> growth. This also has implications for the range <strong>of</strong> services<br />
<strong>and</strong> support needed in the community to enable a faster, successful integration into the community.<br />
Figure 6 - Population by Visible Minority Status, 2001-2006<br />
Source: Statistics Canada, 2001 <strong>and</strong> 2006 Census <strong>of</strong> Population<br />
<strong>Barrie</strong> Toronto-Centred Region Ontario<br />
2006 2001 % Change 2006 2001 % Change 2006 2001 % Change<br />
Total 126,830 102,345 23.9% 7,704,190 7,097,330 8.6% 12,028,895 11,285,550 6.6%<br />
Total visible<br />
minority<br />
population<br />
8,525 4,965 71.7% 2,415,425 1,885,365 28.1% 2,745,200 2,153,045 27.5%<br />
Chinese 1,005 710 41.5% 520,435 434,465 19.8% 576,980 481,510 19.8%<br />
South Asian 1,590 985 61.4% 738,090 512,420 44.0% 794,170 554,870 43.1%<br />
Black 1,880 1,185 58.6% 401,635 346,910 15.8% 473,760 411,095 15.2%<br />
Filipino 815 330 147.0% 186,655 143,925 29.7% 203,220 156,515 29.8%<br />
Latin American 1,025 535 91.6% 121,890 90,020 35.4% 147,135 106,835 37.7%<br />
Southeast<br />
Asian<br />
470 225 108.9% 88,625 67,840 30.6% 110,045 86,410 27.4%<br />
Arab 295 255 15.7% 66,700 51,655 29.1% 111,405 88,545 25.8%<br />
West Asian 260 65 300.0% 85,570 58,550 46.1% 96,615 67,105 44.0%<br />
Korean 390 340 14.7% 61,935 48,450 27.8% 69,540 53,955 28.9%<br />
Japanese 210 150 40.0% 23,470 21,020 11.7% 28,080 24,925 12.7%<br />
Visible<br />
minority, n.i.e.<br />
Multiple visible<br />
minority<br />
Not a visible<br />
minority<br />
235 100 135.0% 52,235 72,730 -28.2% 56,845 78,915 -28.0%<br />
350 80 337.5% 68,110 37,395 82.1% 77,400 42,375 82.7%<br />
118,310 97,380 21.5% 5,288,740 5,211,980 1.5% 9,283,690 9,132,500 1.7%<br />
The data hints at a more general trend in Canadian immigration. While Canada’s largest urban areas still<br />
act as a primary l<strong>and</strong>ing point for immigrants, recent data presented by the Canadian Federation <strong>of</strong><br />
Municipalities suggests that there is a significant trend towards secondary migration to smaller suburban<br />
areas 7 . As well, Statistics Canada has reported that there is increasing evidence that higher proportions<br />
<strong>of</strong> recent immigrants are choosing to settle in smaller areas outside <strong>of</strong> traditional destinations (Toronto,<br />
Montreal, <strong>and</strong> Vancouver) 8 . Figure 7 <strong>of</strong>fers a look at the top origins for the Recent Immigrant population in<br />
the <strong>City</strong> <strong>of</strong> <strong>Barrie</strong> in 2006.<br />
7<br />
Federation <strong>of</strong> Canadian Municipalities, Quality <strong>of</strong> Life in Canadian Communities: Immigration & Diversity in Canadian Cities <strong>and</strong><br />
Communities, 2008<br />
8<br />
Statistics Canada, 2006 Census: Immigration in Canada: A Portrait <strong>of</strong> the Foreign-born Population, 2006<br />
<strong>City</strong> <strong>of</strong> <strong>Barrie</strong> Economic Development Strategy 21 | P age
![Water Specification [DOC] - City of Barrie](https://img.yumpu.com/11698186/1/190x245/water-specification-doc-city-of-barrie.jpg?quality=85)