Transient integral boundary layer method to calculate the ...
Transient integral boundary layer method to calculate the ...
Transient integral boundary layer method to calculate the ...

Create successful ePaper yourself
Turn your PDF publications into a flip-book with our unique Google optimized e-Paper software.
BioMedical Engineering OnLineBioMed CentralResearch<strong>Transient</strong> <strong>integral</strong> <strong>boundary</strong> <strong>layer</strong> <strong>method</strong> <strong>to</strong> <strong>calculate</strong> <strong>the</strong>translesional pressure drop and <strong>the</strong> fractional flow reserve inmyocardial bridgesStefan Bernhard* 1 , Stefan Möhlenkamp* 2 and Andreas Tilgner 1Open AccessAddress: 1 Department of Physics, Georg-August-Universität Göttingen, Friedrich-Hundt-Platz 1, 37077 Göttingen, Germany and 2 University Clinicof Essen, West-German Heart Center, Clinic of Cardiology, Hufelandstrasse 55, 45122 Essen, GermanyEmail: Stefan Bernhard* - stefan.bernhard@physik.uni-goettingen.de; Stefan Möhlenkamp* - stefan.moehlenkamp@uni-essen.de;Andreas Tilgner - andreas.tilgner@physik.uni-goettingen.de* Corresponding authorsPublished: 21 June 2006BioMedical Engineering OnLine 2006, 5:42 doi:10.1186/1475-925X-5-42Received: 16 March 2006Accepted: 21 June 2006This article is available from: http://www.biomedical-engineering-online.com/content/5/1/42© 2006 Bernhard et al; licensee BioMed Central Ltd.This is an Open Access article distributed under <strong>the</strong> terms of <strong>the</strong> Creative Commons Attribution License (http://creativecommons.org/licenses/by/2.0),which permits unrestricted use, distribution, and reproduction in any medium, provided <strong>the</strong> original work is properly cited.AbstractBackground: The pressure drop – flow relations in myocardial bridges and <strong>the</strong> assessment of vascular heartdisease via fractional flow reserve (FFR) have motivated many researchers <strong>the</strong> last decades. The aim of this studyis <strong>to</strong> simulate several clinical conditions present in myocardial bridges <strong>to</strong> determine <strong>the</strong> flow reserve andconsequently <strong>the</strong> clinical relevance of <strong>the</strong> disease. From a fluid mechanical point of view <strong>the</strong> pathophysiologicalsituation in myocardial bridges involves fluid flow in a time dependent flow geometry, caused by contractingcardiac muscles overlying an intramural segment of <strong>the</strong> coronary artery. These flows mostly involve flowseparation and secondary motions, which are difficult <strong>to</strong> <strong>calculate</strong> and analyse.Methods: Because a three dimensional simulation of <strong>the</strong> haemodynamic conditions in myocardial bridges in anetwork of coronary arteries is time-consuming, we present a <strong>boundary</strong> <strong>layer</strong> model for <strong>the</strong> calculation of <strong>the</strong>pressure drop and flow separation. The approach is based on <strong>the</strong> assumption that <strong>the</strong> flow can be sufficiently welldescribed by <strong>the</strong> interaction of an inviscid core and a viscous <strong>boundary</strong> <strong>layer</strong>. Under <strong>the</strong> assumption that <strong>the</strong>idealised flow through a constriction is given by near-equilibrium velocity profiles of <strong>the</strong> Falkner-Skan-Cooke(FSC) family, <strong>the</strong> evolution of <strong>the</strong> <strong>boundary</strong> <strong>layer</strong> is obtained by <strong>the</strong> simultaneous solution of <strong>the</strong> Falkner-Skanequation and <strong>the</strong> transient von-Kármán <strong>integral</strong> momentum equation.Results: The model was used <strong>to</strong> investigate <strong>the</strong> relative importance of several physical parameters present inmyocardial bridges. Results have been obtained for steady and unsteady flow through vessels with 0 – 85%diameter stenosis. We compare two clinical relevant cases of a myocardial bridge in <strong>the</strong> middle segment of <strong>the</strong>left anterior descending coronary artery (LAD). The pressure derived FFR of fixed and dynamic lesions has shownthat <strong>the</strong> flow is less affected in <strong>the</strong> dynamic case, because <strong>the</strong> distal pressure partially recovers during re-openingof <strong>the</strong> vessel in dias<strong>to</strong>le. We have fur<strong>the</strong>r <strong>calculate</strong>d <strong>the</strong> wall shear stress (WSS) distributions in addition <strong>to</strong> <strong>the</strong>location and length of <strong>the</strong> flow reversal zones in dependence on <strong>the</strong> severity of <strong>the</strong> disease.Conclusion: The described <strong>boundary</strong> <strong>layer</strong> <strong>method</strong> can be used <strong>to</strong> simulate frictional forces and wall shearstresses in <strong>the</strong> entrance region of vessels. Earlier models are supplemented by <strong>the</strong> viscous effects in a quasi threedimensionalvessel geometry with a prescribed wall motion. The results indicate that <strong>the</strong> translesional pressuredrop and <strong>the</strong> mean FFR compares favourably <strong>to</strong> clinical findings in <strong>the</strong> literature. We have fur<strong>the</strong>r shown that <strong>the</strong>mean FFR under <strong>the</strong> assumption of Hagen-Poiseuille flow is overestimated in developing flow conditions.Page 1 of 25(page number not for citation purposes)
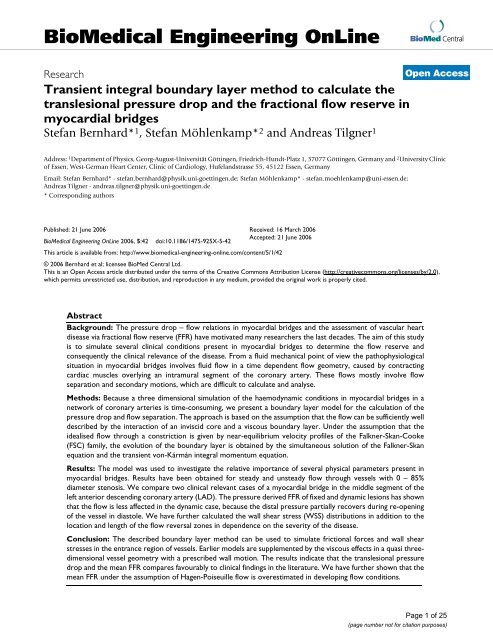
BioMedical Engineering OnLine 2006, 5:42http://www.biomedical-engineering-online.com/content/5/1/42BackgroundThe incomplete understanding of <strong>the</strong> pathophysiologyand clinical relevance of myocardial bridges has been <strong>the</strong>subject of debate for <strong>the</strong> last quarter century. An overviewof physiological relevant mechanisms of myocardialbridging, <strong>the</strong> current diagnostic <strong>to</strong>ols and treatment strategiesare found in [1-8]. Despite extensive studies on thissubject <strong>the</strong>re is no consensus on its clinical significance <strong>to</strong>myocardial ischaemia or angina pec<strong>to</strong>ris.A variety of models concerned with arterial stenoses [9-12] and series of stenoses [13-15] are found in <strong>the</strong> literature.Theoretical studies have been done <strong>to</strong> predict <strong>the</strong>location of maximum wall shear stress [16-18] and <strong>the</strong>extent of flow separation located distal <strong>to</strong> fixed stenoses[19-21]. There are a few models, which discuss flow in atime dependent two-dimensional flow geometry [22-25].These models assume rigid walls and are mainly focusedon vortex formation and <strong>the</strong> wall shear stress distribution.However, [26] discussed <strong>the</strong> extent of <strong>the</strong> separation zonein a one-dimensional empirical parameter model using<strong>the</strong> concept of dividing streamline. They found goodagreement with experiments in two-dimensional (partly)flexible indented channels [27].The interesting dynamic phenomena of collapsible tubesare discussed in [28-31]. When <strong>the</strong> tube wall is partiallycollapsed strong oscillations may occur, even understeady flow conditions. The non-linear coupling between<strong>the</strong> fluid pressure and tube wall deformation can produceconditions in which high-grade stenoses may collapse[32]. We note that in <strong>the</strong> late sys<strong>to</strong>le <strong>the</strong> compression of<strong>the</strong> artery in a myocardial bridge may cause conditionswhere <strong>the</strong> vessel is entirely closed and where <strong>the</strong> flow limitingeffect during re-opening becomes significant.Clinical situationUnder normal circumstances, coronary arteries havediameters large enough <strong>to</strong> transport sufficient amounts ofoxygen <strong>to</strong> myocardial cells. Increases in myocardial oxygendemand, e.g. during exercise, are met by increases incoronary artery blood flow because – unlike in manyo<strong>the</strong>r organs – extraction of oxygen from blood cannot beincreased. This is in part mediated by increases in diametersof small intra-myocardial arteries. The large proximal(epicardial) coronary arteries contribute only a small fractionof <strong>to</strong>tal vascular resistance and show little variation indiameter during <strong>the</strong> cardiac cycle in any given metabolicsteady state. Under maximum arteriolar vasodilation, <strong>the</strong>resistance imposed by <strong>the</strong> myocardial bed is minimal andblood flow is proportional <strong>to</strong> <strong>the</strong> driving pressure.The most common cause of an impaired ability <strong>to</strong> matchoxygen supply and demand is coronary a<strong>the</strong>rosclerosis, adisease that eventually leads <strong>to</strong> fixed coronary arterylumen narrowing, impaired coronary blood flow andpotentially myocardial infarction. However, some peoplepresent with chest pain caused by phasic lumen obstructiondue <strong>to</strong> myocardial bridging, first mentioned by Reymanin 1737 [33]. In this ana<strong>to</strong>mic variant, a coronaryartery segment courses underneath myocardial fibresresulting in vessel compression during sys<strong>to</strong>le, i.e. <strong>the</strong>myocardial contraction phase [6]. Myocardial bridges aremost commonly found in <strong>the</strong> mid LAD, 1 mm <strong>to</strong> 10 mmbelow <strong>the</strong> surface of <strong>the</strong> myocardium with typical lengthof 10 mm <strong>to</strong> 30 mm. An angiogram of two myocardialbridges in series shown in Figure 1(a).Although coronary blood flow occurs predominantly duringdias<strong>to</strong>le, i.e. <strong>the</strong> filling phase of <strong>the</strong> hearts chambers,<strong>to</strong>tal blood flow may none<strong>the</strong>less be reduced partlybecause vascular relaxation may extend significantly in<strong>to</strong>dias<strong>to</strong>le, <strong>the</strong> myocardial relaxation phase. Within <strong>the</strong>bridged segments permanent diameter reductions of 22 –58% were found during dias<strong>to</strong>le, while in sys<strong>to</strong>le <strong>the</strong>diameters were reduced by 70 – 95% [5]. A schematicdrawing of <strong>the</strong> increased flow velocities (cm/s) during sys<strong>to</strong>le(31.5 within versus 17.3 proximal and 15.2 distal) isgiven in Figure 1(b).From a medical point of view coronary angiography islimited in its ability <strong>to</strong> determine <strong>the</strong> physiologic significanceof coronary stenosis [34,35]. As a result, intracoronaryphysiologic measurement of myocardial fractionalflow reserve was introduced and has proven <strong>to</strong> be a reliable<strong>method</strong> for determining <strong>the</strong> functional severity of coronarystenosis. Previous studies have shown that <strong>the</strong> cu<strong>to</strong>ffvalue of 0.75 reliably detects ischaemia-producinglesions for patients with moderate epicardial coronary stenosis[36]. The assessment of <strong>the</strong> FFR is independent ofchanges in systemic blood pressure, heart rate, or myocardialcontractility and is highly reproducible [37]. The concep<strong>to</strong>f coronary pressure-derived FFR has beenextensively studied [13,38-40], clinically validated [41]and was found <strong>to</strong> be very useful in identifying patientswith multi-vessel disease [42], who might benefit fromca<strong>the</strong>ter-based treatment instead of surgical revascularisation.As in [38], we have defined <strong>the</strong> pressure derived FFRas <strong>the</strong> ratio between <strong>the</strong> pressures measured distal <strong>to</strong> andproximal <strong>to</strong> <strong>the</strong> myocardial bridge during maximal hyperaemia.The exact locations of pressure measurement aregiven later in <strong>the</strong> text.In summary myocardial bridges are characterised by aphasic sys<strong>to</strong>lic vessel compression with a persistentdias<strong>to</strong>lic diameter reduction, increased blood flow velocities,retrograde flow, and a reduced flow reserve [5]. Theunderlying mechanisms are fourfold. Firstly <strong>the</strong> discontinuitycauses wave reflections, secondly <strong>the</strong> dynamicreduction of <strong>the</strong> vessel diameter produces secondary flow,Page 2 of 25(page number not for citation purposes)
BioMedical Engineering OnLine 2006, 5:42http://www.biomedical-engineering-online.com/content/5/1/42(a)(b)u (x, t)Coronary Figure 1 angiogram of two myocardial bridges in <strong>the</strong> LADCoronary angiogram of two myocardial bridges in <strong>the</strong> LAD. (a) Coronary angiogram of two myocardial bridges in <strong>the</strong>left anterior descending (LAD) branch (arrows) in dias<strong>to</strong>le (left) and sys<strong>to</strong>le (right). Compression of <strong>the</strong> artery during <strong>the</strong>hearts contraction phase, i.e. sys<strong>to</strong>le, is a characteristic finding in myocardial bridging (see text and [6] for details), (b) Dias<strong>to</strong>liclumen dimensions and flow velocity are normal, while sys<strong>to</strong>lic flow velocities are increased within <strong>the</strong> bridged segments.tthirdly <strong>the</strong>re is evidence for flow separation in post stenoticregions [43,44] and finally at severe deformations (orelevated flow velocities) <strong>the</strong> artery may temporally collapse[32].ObjectiveTo ascertain <strong>the</strong> severity of <strong>the</strong> disease it is often desirable<strong>to</strong> have simple models <strong>to</strong> predict <strong>the</strong> pressure drop characteristics.A review of <strong>the</strong> available literature reveals thata few models exist, which are able <strong>to</strong> predict pressure drop(or friction fac<strong>to</strong>r) in non-circular ducts [45] (and references<strong>the</strong>rein). However, <strong>the</strong> available models are for fullydeveloped flow in non-circular ducts with fixed walls andmostly require tabulated coefficients.In this study we intend <strong>to</strong> investigate physiological relevantcases of developing blood flow through a myocardialbridge located in <strong>the</strong> middle segment of <strong>the</strong> LAD. A priormodel with similar geometry [46], but based on <strong>the</strong>assumption of fully developed Hagen-Poiseuille flow, wasused <strong>to</strong> determine <strong>the</strong> influence of severity, length anddegree of deformation and vascular termination on <strong>the</strong>flow. The results, however, indicated that <strong>the</strong> pressuredrop was not realistic, which we assume is mainly due <strong>to</strong>negligence of entrance and separation losses. The systemstudied herein is <strong>the</strong> developing flow of an incompressible,viscous fluid through a network of elastic tubes inresponse <strong>to</strong> <strong>the</strong> aortic pressure. The tube characteristicsand fluid properties are known, <strong>the</strong> developing flow conditions,<strong>the</strong> pressure response and mean FFR are desiredquantities. We primarily substantiate <strong>the</strong> influence of frictionallosses and separation losses on <strong>the</strong> translesionalpressure drop and we <strong>calculate</strong> <strong>the</strong> mean fractional flowreserve <strong>to</strong> determine <strong>the</strong> haemodynamic relevance of <strong>the</strong>myocardial bridge. Fur<strong>the</strong>r, we examine <strong>the</strong> consequenceof external deformation on <strong>the</strong> wall shear stress distributionalong <strong>the</strong> vessel.MethodsThe fluid mechanics involved in flow through a myocardialbridge is complex, because of <strong>the</strong> three dimensionalityof <strong>the</strong> deformations, coupling of <strong>the</strong> fluid with <strong>the</strong>arterial wall and flow separation. To understand <strong>the</strong> complicatedbehaviour of <strong>the</strong> tube flow, it is convenient <strong>to</strong>Page 3 of 25(page number not for citation purposes)
BioMedical Engineering OnLine 2006, 5:42http://www.biomedical-engineering-online.com/content/5/1/42 Deformation Figure 3 cross-sectionDeformation cross-section. This figure illustrates <strong>the</strong> deformation geometry of a circular, linear elastic tube neglecting <strong>the</strong>bending stress inside <strong>the</strong> wall. Cross-section B - B (left) shows circular expansion under pressure and <strong>the</strong> cross-section C - Cillustrates <strong>the</strong> geometry under external deformation (right). The equilibrium cross-sectional area A d is shaded in light grey,while <strong>the</strong> perturbation area A' is shaded in dark grey. The dashed lines indicate expansion under pressure.ity in axial direction. The volume flux across a given section<strong>the</strong>refore is q (x, t) = A u.As shown in <strong>the</strong> angiography 1 and Figure 2 <strong>the</strong> coronaryarteries in myocardial bridges are structured by severalwall deformations. Their number, degree and extensionmay independently vary with time, so that <strong>the</strong> axial curvatureof <strong>the</strong> arterial wall for each of <strong>the</strong> n = 1...N myocardialbridges in series is characterised by N functions. Thedeformation is specified by a parameter ζ, defined as ζ =R d /R 0 , which is chosen in <strong>the</strong> stenosis n <strong>to</strong> vary with timeas( ) +1ζn ( t) = ζdias<strong>to</strong>le −ζsys<strong>to</strong>le ( gn 1)+ ζsys<strong>to</strong>le,( 1)2where g n (t) are periodic functions describing <strong>the</strong> temporalcontraction of <strong>the</strong> muscle fibres. ζ sys<strong>to</strong>le and ζ dias<strong>to</strong>le are fixedgeometrical parameters between 0 and 1, specifying <strong>the</strong>degree of sys<strong>to</strong>lic and dias<strong>to</strong>lic deformation respectively.We note that in <strong>the</strong> centre of <strong>the</strong> deformation ζ (x = x s2 ) =ζ 0 = R d /R 0 , i.e. <strong>the</strong> degree of deformation increases withdecreasing ζ 0 and consequently ζ sys<strong>to</strong>le
BioMedical Engineering OnLine 2006, 5:42http://www.biomedical-engineering-online.com/content/5/1/42 Deformation Figure 4 functionDeformation function. The variation of <strong>the</strong> bending radius R d (x S2 , t) in <strong>the</strong> centre of <strong>the</strong> deformation is plotted with respect<strong>to</strong> <strong>the</strong> cardiac cycle, represented by a EKG trace. The time shift with respect <strong>to</strong> <strong>the</strong> cardiac cycle is denoted by Δt, i.e. <strong>the</strong> solidline has zero time shift, while <strong>the</strong> dotted and dashed lines are shifted by ± 100 ms respectively. The periodic function g(t) inequation 3, was chosen according <strong>to</strong> IVUS measurements in [51].approximately 0.5. The circumferential strain in <strong>the</strong> vesselwall isWe can finally write <strong>the</strong> pressure induced perturbation as22 1 − σU − U02πRd+ 2B−2πRR BA0 d′( Rd, p) = RdU 0 p .( 11)ε = == + − 1.( 6)Eh 0U02πR0 R0 πR0It should be noted that under <strong>the</strong> assumption of linearEquation (5) can be rearranged in<strong>to</strong> <strong>the</strong> formelastic material with constant elastic modulus, equation(9) and (11) have <strong>the</strong> property that <strong>the</strong> area increases linearlywith transmural pressure. Real arteries, however,h 0 ε E h0p = ςh= , ( 7 )resist over-expansion by having an incremental elasticRd−21 σ Rdmodulus, E(ε), that increases with increasing strain [52].whereas Equation (6) leads <strong>to</strong> an expression for <strong>the</strong> pressuredependence of <strong>the</strong> breadth, B, of <strong>the</strong> flat portion of equation (11) is not only dependent on pressure variationIt should be fur<strong>the</strong>r noted that <strong>the</strong> area perturbation in<strong>the</strong> tube.but also on <strong>the</strong> degree of deformation through R d . Byusing equation (7) and (9) we can finally write <strong>the</strong> pressure-arearelation⎡ 21 − σ RB R p RE h p R ⎤d d( d , ) = π 0 ⎢+ 1−⎥.( 8)⎣⎢0 R0⎦⎥2The <strong>to</strong>tal cross-sectional area isEh ( π Rd+ A−RdU)00p( Rd, A) =. ( )2( − ) UR 0 d2121 σA (R d , p) = π R 2 d + 2 B (R d , p) R d . (9)In <strong>the</strong> unperturbed state, <strong>the</strong> cross-section isA d (R d ) = R d U 0 - π R 2 d . (10)Elastic properties of <strong>the</strong> coronary arteriesThe elastic properties for a given section of <strong>the</strong> circulartube are obtained by using estimates for <strong>the</strong> volume complianceas suggested in [53], where <strong>the</strong> empirical approximationin exponential form isPage 6 of 25(page number not for citation purposes)
BioMedical Engineering OnLine 2006, 5:42http://www.biomedical-engineering-online.com/content/5/1/42EhR0 00= k exp ( k R )+ k . ( )In <strong>the</strong>se estimates k 1 , k 2 , and k 3 are constants. With datafor <strong>the</strong> volume compliance from Westerhof [54], Stergiopulos[55] and Segers [56] we obtain k 1 = 2.0 * 10 6 Kg s -2 m -1 ,k 2 = -2.253 * 10 3 m -1 , and k 3 = 8.65 * 10 4 Kg s -2 m -1 . A functionalrelationship for <strong>the</strong> wall thickness subject <strong>to</strong> <strong>the</strong>vessel radius can be found in [57], whereh 0 = a R 0b . (14)1 2 0 3 13The parameters for a = 3.87 and b = 0.63 were obtained bya logarithmic fit <strong>to</strong> data including vessel radii between100 μm and 3000 μm. Equations (13) and (14) are used<strong>to</strong> determine <strong>the</strong> wall thickness and elastic properties of<strong>the</strong> vessel, if <strong>the</strong> radius is known. The assumption of smallbending resistance is well satisfied if a R 0(b-1)
BioMedical Engineering OnLine 2006, 5:42http://www.biomedical-engineering-online.com/content/5/1/42and <strong>the</strong> <strong>to</strong>tal displacement thickness δ** = δ* + θδ ∗∗ R ⎛ ⎞= ∫ 2d ν 1−x⎟dr,220 ⎜ 2⎝ V ⎠leads <strong>to</strong>∗∗1 ∂δ V ∂θ 2θ + δ ∂V+ +2V ∂ t ∂ x V ∂ xwith u(0, t) = V(0, t), θ(0, t) = δ*(0, t) = 0, (24)where c f is a non-dimensional friction fac<strong>to</strong>r defined asτcf x, t .1ρ0V22The only difference <strong>to</strong> plane flow is <strong>the</strong> term involving∂R d /∂ x . If R d → ∞ or ∂R d /∂x → 0, equation (23) reduces <strong>to</strong><strong>the</strong> von Kármán <strong>integral</strong> momentum equation for planeflow. Compared <strong>to</strong> <strong>the</strong> frictional term c f /2 <strong>the</strong> influence of<strong>the</strong> term involving ∂R d /∂x on <strong>the</strong> <strong>boundary</strong> <strong>layer</strong> propertiesis indeed small (below 0.3%), thus disregarding <strong>the</strong>term for simplicity is appropriate. The <strong>boundary</strong> conditionsin (24) assume a uniform inflow profile.Falkner-Skan equationSuitable solutions <strong>to</strong> <strong>the</strong> <strong>boundary</strong> <strong>layer</strong> equations inei<strong>the</strong>r plane or axial symmetry are found by <strong>the</strong> introductionof <strong>the</strong> stream function. A suitable coordinate transformationturns <strong>the</strong> equation for <strong>the</strong> stream function in<strong>to</strong><strong>the</strong> Görtler equation (derivation see [59]). The followingapproach mainly consists in assuming that <strong>the</strong> flow islocally self-similar and that it depends weekly on <strong>the</strong> coordinatex, so that <strong>the</strong> velocity profiles can be mapped on<strong>to</strong>each o<strong>the</strong>r by suitable scaling fac<strong>to</strong>rs in y. Falkner andSkan have found a family of similarity solutions, where<strong>the</strong> free-stream velocity is of <strong>the</strong> power-law formV(x) = Cx n , (26)⎟( )( ) = ( 25)θ ∂ R cd νw f+ − − = 0,( 23)Rd∂ x V 2with a constant C and <strong>the</strong> power-law parameter n. Thesimilarity variable η ~ y/δ(x) is set as( ) ( )1 + n V xu( x, y) = V( x) f′( η) where η = y,2vx( 27 )where f(η) is <strong>the</strong> dimensionless stream function and <strong>the</strong>prime refers <strong>to</strong> derivative with respect <strong>to</strong> η. The coordinatenormal <strong>to</strong> <strong>the</strong> plate is denoted by y. However <strong>the</strong>re areo<strong>the</strong>r general similarity solutions including <strong>the</strong> temporaldependence of <strong>the</strong> profile evolution [61]. The above similarityvariables turn <strong>the</strong> <strong>boundary</strong> <strong>layer</strong> equations in<strong>to</strong> anon-linear ordinary differential equation of order three,which is known as <strong>the</strong> Falkner-Skan-Equation2n( ) = β = ( 28 )+f′′′ + ff′′ + − f′2β 1 0 where( ) = ′( ) = ′( ) = ( )with f 0 f 0 0 and lim f η 1.29η→∞The parameter β is a measure of <strong>the</strong> pressure gradient ∂p/∂x. If β is positive, <strong>the</strong> pressure gradient is negative orfavourable, β = 0 indicates no pressure gradient (i.e. <strong>the</strong>Blasius solution <strong>to</strong> flat plate flow) and negative β denotesa positive or unfavourable pressure gradient. We note thatby assumption, β should vary slowly with coordinate x.The solutions are found numerically by a shooting<strong>method</strong> with f''(0) as free parameter by Hartree [62]. Toavoid extensive calculations we follow a curve fit representationof three quantities extracted from solutions of <strong>the</strong>Falkner-Skan equation used in [19]:f1H∗2δ ∂Vν ∂ x( ) = = − −δ ∗2 2The relation <strong>to</strong> flat plate flow is generally given by <strong>the</strong>shape fac<strong>to</strong>r, which is defined as H = δ * /0, whereas H 0 is<strong>the</strong> equivalent value for plane flow over a flat plate. Thecurve fits provide a good approximation for values of Hbetween 1 and 20. At <strong>the</strong> separation point <strong>the</strong> wall shearstress vanishes, i.e. ∂V X /∂r = 0, which is equivalent <strong>to</strong> ashape fac<strong>to</strong>r H = 4. Relation (32) is not required for <strong>the</strong>calculations, however it is useful <strong>to</strong> predict <strong>the</strong> actual<strong>boundary</strong> <strong>layer</strong> thickness δ 99 , where <strong>the</strong> fluid velocity differsby 1% from <strong>the</strong> free stream value. The relation for <strong>the</strong>shear stress given in [19] isconsequently <strong>the</strong> friction fac<strong>to</strong>r isA schematic illustration of <strong>the</strong> actual flow profile along<strong>the</strong> tube axis is shown in Figure 5. We have chosen a uniforminflow profile with velocity V(0, t). The <strong>boundary</strong><strong>layer</strong> (dashed line) grows from <strong>the</strong> leading edge, decreasesin <strong>the</strong> converging part, while it grows in <strong>the</strong> divergent part1043 . H0−H2. 4 1 e ( ) with H02.59 30n( ) = ( )cfV ⎛ 4 1 ⎞f ( H) = = ⎜ − ⎟ ( 31)2vH ⎝ H H ⎠( )( − )δ99H + 2 4 H 4 H 25f3( H) = =H − 1+ − ..∗3δHτωμ fV 2xt , ,θ( ) = ( 33)2μfcf x, t2.ρ Vθ( ) = ( 34 )0( 32 )Page 8 of 25(page number not for citation purposes)
BioMedical Engineering OnLine 2006, 5:42http://www.biomedical-engineering-online.com/content/5/1/42 Boundary Figure 5 <strong>layer</strong> evolution in <strong>the</strong> myocardial bridgeBoundary <strong>layer</strong> evolution in <strong>the</strong> myocardial bridge. Illustration of <strong>boundary</strong> <strong>layer</strong> separation in a series of two myocardialbridges at a deformation of ζ 0 = 0.2; geometry and <strong>boundary</strong> <strong>layer</strong> thickness are displayed in realistic proportions, <strong>the</strong>velocity profiles are schematically drawn. The inflow profile is uniform with velocity V. We note that <strong>the</strong> extension of <strong>the</strong> separationzones differ, because <strong>the</strong> second myocardial bridge experiences different flow conditions.of <strong>the</strong> tube. The upward triangles (▲) denote <strong>the</strong> point ofseparation, while downward triangles (▼) indicate <strong>the</strong>reattachment of <strong>the</strong> <strong>boundary</strong> <strong>layer</strong>. After separation <strong>the</strong>flow field can be seen as a <strong>to</strong>p hat profile in <strong>the</strong> centre anda recirculation zone close <strong>to</strong> <strong>the</strong> walls. Due <strong>to</strong> <strong>the</strong> adjacentconverging part <strong>the</strong> reattachment is forced early, becausefluid is accelerated. In contrast <strong>the</strong> reattachment after <strong>the</strong>second diverging part takes place fur<strong>the</strong>r downstream.Averaged flow equationsThe simultaneous viscid-inviscid <strong>boundary</strong> <strong>layer</strong>approach assumes an inviscid core flow, which followsequation (19) and a viscous <strong>boundary</strong> <strong>layer</strong>, which maybe found by <strong>the</strong> solution of equation (23). The onedimensionalequations commonly used <strong>to</strong> simulateunsteady, incompressible blood flow in elastic tubes withfrictional losses [53,63] are given in averaged flow variablesas∂ A∂ t∂ q, 35∂ x=− ( )∂ q ⎡ ∂ ⎛=−⎢∂ t ∂x⎜⎣⎢⎝2χ qA⎞ A ∂ p⎟ +⎤⎥⎠ρ0∂ x⎦F v⎥ + ,( 36 )where F ν is <strong>the</strong> viscous friction term and χ is <strong>the</strong> momentumcorrection coefficient. The viscous friction term isdefined as⎡ ∂υx⎤Fν( x, t) = 2π Rν⎢ ,⎣ ∂ r⎥⎦and <strong>the</strong> momentum correction coefficient isRχ1 2xt , ∫ νx Auda .2 A( ) = ( 38 )We rearrange <strong>the</strong> equations written in area and flow ratein terms of area and area-averaged axial flow velocity sothat∂ A′ ⎡ ∂ Au ∂ A=− +∂ t⎢⎣ ∂ x ∂ t( )d⎤, 39⎦⎥ ( )∂ u ⎡ u χ −1 ∂ Au ∂χu1 ∂ p ⎤ F=−⎢+ u +ν .∂ t ⎣ A ∂ x ∂xρ0∂ x ⎦ A⎥ + ( 40 )The derivative of A d with respect <strong>to</strong> time in equation (39)is a prescribed function depending on R d (x, t). It is responsiblefor <strong>the</strong> volume displacement caused by <strong>the</strong> forceddeformation of <strong>the</strong> tube.Hagen-Poiseuille viscous friction and momentum correctionThe determination of viscous friction fac<strong>to</strong>r and momentumcorrection coefficient requires knowledge about <strong>the</strong>velocity profile. For pulsatile laminar flow in small axiallysymmetric vessels a flow profile of <strong>the</strong> form( ) = ( )ν x xr , u x+ ⎡ r− ⎛ γγ 2⎝ ⎜⎞ ⎤⎢ 1 ⎟ ⎥ 41γ R⎣⎢⎠⎦⎥( )is used [50]. Here û is <strong>the</strong> free stream value of <strong>the</strong> axialvelocity and R is <strong>the</strong> actual radius of tube, while γ is <strong>the</strong>profile exponent, which for a Hagen-Poiseuille flow profileis equal <strong>to</strong> two. Consequently <strong>the</strong> friction term is givenbyF ν = -2 π ν(γ + 2) u = K ν u, (42)Page 9 of 25(page number not for citation purposes)
BioMedical Engineering OnLine 2006, 5:42http://www.biomedical-engineering-online.com/content/5/1/42A δ ∗A δ ∗∗A θwhereas <strong>the</strong> friction coefficient for a parabolic profile is K ν= -8 π ν. The corresponding momentum correction coefficientis given byγ + 2χ( xt , ) = ,γ + 1which is 4/3 in <strong>the</strong> parabolic case. Such fac<strong>to</strong>rs can beused for <strong>the</strong> purpose of correlating o<strong>the</strong>r variables as wellas for direct calculation of pressure drop. We note that in<strong>the</strong> presence of a stenosis <strong>the</strong> <strong>to</strong>tal losses under <strong>the</strong>assumption of Hagen-Poiseuille flow are underestimated[55]. This comes mainly from underestimating <strong>the</strong> viscousforces and disregarding <strong>the</strong> losses caused by flow separationat <strong>the</strong> diverging end of <strong>the</strong> stenosis [64,65].Boundary <strong>layer</strong> derived viscous friction and momentum correctionDeveloping flow conditions in ducts of multiply connectedcross-sections generally make it difficult <strong>to</strong> use <strong>the</strong>right friction fac<strong>to</strong>r. A variety of cross-sections are discussedin [45]. In those situations <strong>the</strong> similarity parametersare preferably based on <strong>the</strong> free stream velocity and<strong>the</strong> square root of <strong>the</strong> cross-sectional flow area as characteristiclength scale i.e. = A . Consequently we define<strong>the</strong> Reynolds number Re A=V / V , <strong>the</strong> Womersleyhave multiplied Re and Sr by a fac<strong>to</strong>r ofis multiplied byδ ∗θDisplacement tube Figure 6 thickness and displacement area in a deformedDisplacement thickness and displacement area in adeformed tube. Illustration of <strong>the</strong> displacement thicknessδ*, <strong>the</strong> momentum thickness θ and <strong>the</strong> <strong>to</strong>tal displacementthickness δ** in a deformed cross-section. The related areasare <strong>the</strong> displacement area A δ* (dark grey), <strong>the</strong> momentumarea A θ (light grey) and <strong>the</strong> <strong>to</strong>tal displacement area A δ** = A δ*+ A θ (light + dark grey) respectively.( 43)number or frequency parameter WoA = W / V2Woand <strong>the</strong> Strouhal number SrA = = ω. Here ωRe Vis <strong>the</strong> angular frequency defined as ω = 2πf, with f <strong>the</strong> basefrequency of pulse wave oscillation. In o<strong>the</strong>r words weδ ∗∗1 2π , while Woπ . In <strong>the</strong> calculations we have given<strong>the</strong> Reynolds number inside <strong>the</strong> stenosis, Re st , based on .As previously mentioned <strong>the</strong> surface line of <strong>the</strong> flat portionof <strong>the</strong> non-circular duct dominates <strong>the</strong> circular portionat severe deformations, so that <strong>the</strong> computation ofviscous forces is based on plane wedge flow. Consequently<strong>the</strong> thickness of <strong>the</strong> <strong>boundary</strong> <strong>layer</strong> is estimated in<strong>the</strong> xz-plane. Fur<strong>the</strong>r we assume that <strong>the</strong> <strong>boundary</strong> <strong>layer</strong>has constant thickness along <strong>the</strong> circumference as illustratedin Figure 6. The latter assumption allows a simplederivation of <strong>the</strong> momentum correction coefficient and<strong>the</strong> viscous friction term. Integration over <strong>the</strong> cross-sectionleads <strong>to</strong> geometric relations for <strong>the</strong> areas occupied by<strong>the</strong> displacement thickness δ* and <strong>the</strong> <strong>to</strong>tal displacementthickness δ** in that cross-section. They are expressed asA δ* = 2B δ* + π [R 2 d - (R d - δ*) 2 ], (44)A δ** = 2B δ** + π [R 2 d - (R d - δ**)2 ], (45)It is obvious that A d > A δ** and A d > A δ* have <strong>to</strong> be satisfied<strong>to</strong> make sure that <strong>the</strong> flow is not fully developed. Themomentum correction coefficient can be found by satisfyingmass conservation for <strong>the</strong> mean flow and <strong>the</strong> core flowbyV (A - A δ* ) = A u, (46)which can be used <strong>to</strong>ge<strong>the</strong>r with equation (22) and (45)in <strong>the</strong> definition for <strong>the</strong> momentum correction (43), sothat( ) =χ xt ,A ∗∗A νA A V da A A − A − δ21∗∗xδ=A∫=.2 A 2 22−( A − A ) ⎛ A∗∗∗δδ1 − δ ⎞⎜⎝ A ⎟⎠( )( 47 )The uniform inflow profile is identical <strong>to</strong> χ = 1, while <strong>the</strong>developing profile reaches its far downstream value of1.39 after <strong>the</strong> entrance length within less than 4.5% from<strong>the</strong> analytical solution for <strong>the</strong> parabolic flow profile givenin equation (43). We note that in <strong>the</strong> linearised system <strong>the</strong><strong>to</strong>tal cross-section A in equation (47) is replaced by A d .According <strong>to</strong> equation (34) <strong>the</strong> friction fac<strong>to</strong>r built with<strong>the</strong> pressure dependent surface line, U p (x, t) isFvUpv B+Rdx, twf .ρ τ 2 π20θ( ) =− =−( )( 48 )Computations in a uniform tube show good agreement <strong>to</strong><strong>the</strong> friction fac<strong>to</strong>r of <strong>the</strong> parabolic profile given in equation(42). After <strong>the</strong> entrance length <strong>the</strong> friction fac<strong>to</strong>rcomputed via <strong>the</strong> <strong>boundary</strong> <strong>layer</strong> <strong>the</strong>ory reached its fardownstream value <strong>to</strong> within 7%. Additionally <strong>the</strong> Fanningfriction fac<strong>to</strong>r Reynolds number product in aPage 10 of 25(page number not for citation purposes)
BioMedical Engineering OnLine 2006, 5:42http://www.biomedical-engineering-online.com/content/5/1/42through <strong>the</strong> <strong>boundary</strong> <strong>layer</strong>: t d = δ 2 /V
BioMedical Engineering OnLine 2006, 5:42http://www.biomedical-engineering-online.com/content/5/1/42 Syn<strong>the</strong>tic Figure 8 pressure wave at <strong>the</strong> inletSyn<strong>the</strong>tic pressure wave at <strong>the</strong> inlet. Syn<strong>the</strong>tic pressure wave at <strong>the</strong> inlet <strong>to</strong> <strong>the</strong> left coronary tree are modelled by equation(49). We have chosen <strong>the</strong> parameters according <strong>to</strong> measurements in [38]. The baseline (black line), is represented by astationary pressure p s = 8 kPa and a pressure amplitude of p 0 = 7 kPa, while for <strong>the</strong> inlet pressure under dobutamine (red line)p s = 6.6 kPa and p 0 = 5.5 kPa. In both cases <strong>the</strong> raising time was t r = 0.25 s.and arterioles. To satisfy <strong>the</strong> Blasius solution at <strong>the</strong> leadingedge of <strong>the</strong> tube, we have assumed a uniform flow profileat <strong>the</strong> entrance (V(0, t) = u(0, t)).Numerical implementationDue <strong>to</strong> <strong>the</strong> non-linear terms in equation (23) and (40) <strong>the</strong>solutions for haemodynamically developing flows aregenerally more difficult <strong>to</strong> obtain than fully developedflows or oscillating flows with a frequency dependentS<strong>to</strong>kes <strong>boundary</strong> <strong>layer</strong>. Developing flows require simultaneoussolution of <strong>the</strong> momentum equation (39), <strong>the</strong> continuityequation (40) and <strong>the</strong> <strong>integral</strong> momentumequation (23), <strong>to</strong>ge<strong>the</strong>r with <strong>the</strong> <strong>boundary</strong> conditionsgiven in (49) and (24) respectively. The system of equationscannot be solved analytically, so that <strong>the</strong> interiordomain was solved by a second order predic<strong>to</strong>r-correc<strong>to</strong>rMacCormack finite difference scheme with alternatingdirection for prediction and correction in each time step[72]. To implement <strong>the</strong> <strong>boundary</strong> and interface conditionsit is convenient <strong>to</strong> disregard viscous friction andrewrite equation (39) and (40) in terms of characteristicvariables [46]. The momentum correction fac<strong>to</strong>r in equation(47) and <strong>the</strong> viscous friction in equation (48) aregiven by <strong>the</strong> solution <strong>to</strong> <strong>the</strong> <strong>integral</strong> momentum equation(23) and <strong>the</strong> two curve fits <strong>to</strong> <strong>the</strong> Falkner-Skan equationin (30) and (31). They are solved by discretisation using<strong>the</strong> same second order MacCormack scheme and iterativesolution of <strong>the</strong> resulting set of discrete non-linear equationsby a combined root bracketing, interval bisectionand inverse quadratic interpolation <strong>method</strong> of van Wijngaarden-Brent-Dekker.To start <strong>the</strong> computation <strong>the</strong> Blasiussolution at each time step provides values for <strong>the</strong><strong>boundary</strong> <strong>layer</strong> thickness a few grid points downstream of<strong>the</strong> entrance. The solution was applied <strong>to</strong> <strong>the</strong> steady <strong>integral</strong>momentum equation as <strong>boundary</strong> condition for δ*.Downstream marching <strong>the</strong> solution leads <strong>to</strong> <strong>the</strong> values ofPage 12 of 25(page number not for citation purposes)
BioMedical Engineering OnLine 2006, 5:42http://www.biomedical-engineering-online.com/content/5/1/42 Spatial Figure dependence 9 of flow variables in a tube with fixed deformationSpatial dependence of flow variables in a tube with fixed deformation. The area perturbation, flow velocity, pressureand friction coefficient, <strong>the</strong> wall shear stress, momentum correction fac<strong>to</strong>r, <strong>the</strong> normalised <strong>boundary</strong> <strong>layer</strong> thickness and <strong>the</strong>shape fac<strong>to</strong>r are plotted as a function of position in a vessel with fixed deformation of ζ 0 = 0.2. Three stenoses of differentextent (s), (m) and (l) and a series stenosis (d) are compared. The losses are about equal in <strong>the</strong> cases (m) and (d), which indicatesthat <strong>the</strong> pressure loss is mainly viscous. To indicate <strong>the</strong> flow characteristics in <strong>the</strong> stenosis we have used <strong>the</strong> Reynoldsnumber Re st inside <strong>the</strong> deformation.Page 14 of 25(page number not for citation purposes)
BioMedical Engineering OnLine 2006, 5:42http://www.biomedical-engineering-online.com/content/5/1/42 Variation Figure 10of stenosis distanceVariation of stenosis distance. In columns (a), (b) and (c) we compare a series of two dynamic stenoses, which are separatedby one, two and three stenosis dimensions respectively. From <strong>the</strong> <strong>to</strong>p we illustrate <strong>the</strong> flow velocity, <strong>the</strong> pressure, <strong>the</strong>friction coefficient, <strong>the</strong> wall shear stress, <strong>the</strong> momentum correction coefficient and normalised <strong>boundary</strong> <strong>layer</strong> thickness, <strong>the</strong>shape fac<strong>to</strong>r and <strong>the</strong> instantaneous geometry of <strong>the</strong> vessel. The <strong>boundary</strong> <strong>layer</strong> is illustrated as dashed lines. The upward trianglesat <strong>the</strong> centreline of <strong>the</strong> vessel geometries indicate <strong>the</strong> separation point, while <strong>the</strong> downward triangles indicate <strong>the</strong> reattachmen<strong>to</strong>f <strong>the</strong> <strong>boundary</strong> <strong>layer</strong>. The FFR decreases with increasing distance between <strong>the</strong> stenoses.Page 15 of 25(page number not for citation purposes)
BioMedical Engineering OnLine 2006, 5:42http://www.biomedical-engineering-online.com/content/5/1/42Table 1: Mean flow quantities, pressure drop and fractional flow reserve for test geometry shown in Figure 9.fixeddynamicmeasure unit short medium long double short medium long double refp 1[kPa] 10.42 11.63 12.48 11.46 9.55 9.84 10.07 9.80 9.29Δp 1–3 [kPa] 4.15 7.52 9.82 7.78 1.89 2.74 3.47 2.87 1.23FFR p [%] 60 35 21 32 80 72 65 70 86q 1[cm 3 /s] 8.43 6.38 4.94 6.66 9.90 9.40 9.01 9.46 10.36ū 1 [m/s] 0.43 0.33 0.25 0.34 0.50 0.48 0.46 0.48 0.53eccentricity of mild stenoses increases <strong>the</strong> likelihood ofcollapse of stenotic arteries, because <strong>the</strong> buckling pressureis reduced [28].As in [1,8] we found that <strong>the</strong> pressure proximal <strong>to</strong> <strong>the</strong>deformation is increased if <strong>the</strong> degree of deformation or<strong>the</strong> length of deformation is increased. Compared <strong>to</strong> <strong>the</strong>mean reference pressure (no deformation) of 9.29 kPa,<strong>the</strong> mean pressure at <strong>the</strong> inlet for a deformation of ζ 0 = 0.2was 10.28 kPa, 11.53 kPa and 12.41 kPa in <strong>the</strong> cases (s),(m) and (l) respectively. Under <strong>the</strong>se conditions <strong>the</strong> meanflow in <strong>the</strong> reference artery was 10.36 cm 3 /s. For fixeddeformation of ζ 0 = 0.2 we found 8.43 cm 3 /s, 6.38 cm 3 /s,4.94 cm 3 /s and 6.66 cm 3 /s in <strong>the</strong> short, medium, long anddouble stenosis respectively. The pressure drop for <strong>the</strong>medium sized stenosis was at 7.52 kPa just below that of<strong>the</strong> double environment with 7.78 kPa, <strong>the</strong> pressure dropacross <strong>the</strong> short stenosis was 4.15 kPa and across <strong>the</strong> longstenosis 9.82 kPa. In double stenoses <strong>the</strong> pressure dropacross <strong>the</strong> proximal stenosis was 3.28 kPa, which is markedlyless than 4.4 kPa at <strong>the</strong> distal stenosis. Complementary<strong>the</strong> values for <strong>the</strong> dynamic case are generally lesspronounced, <strong>the</strong>y can be found in Table 1.However, <strong>the</strong> translesional pressure drop in a series of twostenoses with time dependent deformation in <strong>the</strong>entrance region of a tube shows fur<strong>the</strong>r remarkableeffects. The simulations indicate that in general <strong>the</strong> pressuredrop cannot be obtained by a summation of pressuredrops for single stenosis, since <strong>the</strong> proximal and distal stenosisinfluence each o<strong>the</strong>r unless <strong>the</strong> spacing between<strong>the</strong>m exceeds some critical distance, which depends on<strong>the</strong> Reynolds number and deformation. Therefore severalconsecutive stenoses along <strong>the</strong> same epicardial arteryrequire separate determination of stenosis severity. Wefound that when <strong>the</strong> two stenoses are close <strong>to</strong>ge<strong>the</strong>r, <strong>the</strong>pressure drop is approximately equal <strong>to</strong> that of a stenosiswith twice <strong>the</strong> length of a single stenosis (see Table 1 andFigure 9 (m) and (d)). This can be explained by <strong>the</strong> factthat <strong>the</strong> friction coefficient in <strong>the</strong> recirculation zonebetween <strong>the</strong> two stenoses is small and consequently <strong>the</strong>pressure loss over that region is small. However, when <strong>the</strong>stenoses are separated by more than <strong>the</strong> length of <strong>the</strong> stenosis<strong>the</strong> flow is hardly affected by <strong>the</strong> second stenosis,because <strong>the</strong> core flow velocity and likewise <strong>the</strong> frictionalforce are increased (see Figure 10(a–c)), even though <strong>the</strong>entrance flow conditions are preserved. Coexistent is <strong>the</strong>increased reduction in shape fac<strong>to</strong>r and momentum correctioncoefficient, suggesting <strong>the</strong> non-linear influence inthat region. The pressure drop over <strong>the</strong> downstream deformationis generally pronounced, however <strong>the</strong> distancebetween <strong>the</strong> deformations fur<strong>the</strong>r increases <strong>the</strong> pressuredrop and consequently <strong>the</strong> mean FFR is reduced. The valuesfor <strong>the</strong> cases (a) <strong>to</strong> (c) are Δp a = 3.45 kPa, Δp b = 3.64kPa and Δp c = 3.89 kPa for <strong>the</strong> pressure drop over <strong>the</strong>downstream deformation and FFR a = 71%, FFR b = 70%and FFR c = 68% for <strong>the</strong> mean fractional flow reserve across<strong>the</strong> bridge. We note that <strong>the</strong>se findings are based on <strong>the</strong>entrance type of flow, where <strong>the</strong> core flow velocity graduallychanges and may not appear in fully developed flow,where <strong>the</strong> core flow velocity is a constant and identical <strong>to</strong><strong>the</strong> maximum of Hagen-Poiseuille flow velocity.Separation and reattachmentThe core velocity in a uniform tube generally increasesdownstream of <strong>the</strong> entrance, however in presence of a stenosis<strong>the</strong> <strong>boundary</strong> <strong>layer</strong> thickness decreases at <strong>the</strong> inletand rapidly increases in <strong>the</strong> diverging part of <strong>the</strong> constriction(see Figure 9). Separation occurs under <strong>the</strong> developmen<strong>to</strong>f a <strong>to</strong>p hat profile with sideway counter-currentflow. At <strong>the</strong> separation point (▲) <strong>the</strong> <strong>boundary</strong> <strong>layer</strong>thickness increases and a sudden jump in χ is evident,2because <strong>the</strong> <strong>integral</strong> of <strong>the</strong> actual velocity ν x over <strong>the</strong> areaof <strong>the</strong> recirculation is close <strong>to</strong> zero and in contrast <strong>to</strong> <strong>the</strong>mean flow velocity <strong>the</strong> core velocity is increased. Therefore<strong>the</strong> non-linear term is pronounced in <strong>the</strong> separationregion, while it is close <strong>to</strong> unity in converging regions. Themomentum correction becomes markedly smaller thanbefore <strong>the</strong> upstream stenosis. This indicates that <strong>the</strong>entrance profile in<strong>to</strong> <strong>the</strong> second stenosis is almost flat, buthas increased core velocity, while <strong>the</strong> counter current flowPage 16 of 25(page number not for citation purposes)
BioMedical Engineering OnLine 2006, 5:42http://www.biomedical-engineering-online.com/content/5/1/42at <strong>the</strong> walls have disappeared. The reattachment of <strong>the</strong><strong>boundary</strong> <strong>layer</strong> (▼) fur<strong>the</strong>r downstream is caused by shear<strong>layer</strong> friction between <strong>the</strong> recirculation zone and <strong>the</strong> <strong>to</strong>phatprofile, which also causes <strong>the</strong> pressure <strong>to</strong> recover. Due<strong>to</strong> <strong>the</strong> increased momentum correction in that region <strong>the</strong>pressure in <strong>the</strong> non-linear case recovers more rapidly thanin linearised computations, which causes earlier reattachmentand consequently slightly smaller recirculationzones. The extent of <strong>the</strong> recirculation zone is primarilydependent on vessel deformation and Reynolds number,however, we found that <strong>the</strong> extent also correlates with <strong>the</strong>length of <strong>the</strong> constriction. Compared <strong>to</strong> <strong>the</strong> short deformationin Figure 9 (s) <strong>the</strong> tail of <strong>the</strong> shape fac<strong>to</strong>r curvedrops below <strong>the</strong> critical value of 4 (condition for separationor reattachment) by a fac<strong>to</strong>r of about two and threelater for <strong>the</strong> medium (m) and long (l) constriction respectively.In o<strong>the</strong>r words vessels with <strong>the</strong> same degree of stenosis,but with <strong>the</strong> stenosis having different curvaturesand lengths, have recirculation regions that differ markedlyin <strong>the</strong>ir extent. At deformations of 85% <strong>the</strong> recirculationzones had an extent of about 20 tube diameters inlength. However <strong>the</strong> extent of <strong>the</strong> separation region wasfound <strong>to</strong> be strongly dependent on <strong>the</strong> degree of deformationand <strong>the</strong> Reynolds number. The separation pointmoves upstream, while <strong>the</strong> reattachment point movesdownstream if <strong>the</strong> Reynolds number or deformationincreases. A particularity of series stenoses is that <strong>the</strong>extent of <strong>the</strong> recirculation zone in <strong>the</strong> interconnecting segmentis reduced. This is due <strong>to</strong> early reattachment causedby fluid acceleration in <strong>the</strong> converging part of <strong>the</strong> secondstenosis. But none<strong>the</strong>less <strong>the</strong> core flow velocity is generallysmaller compared <strong>to</strong> <strong>the</strong> downstream separationregion.Wall shear stress and friction coefficientFor steady flows <strong>the</strong> location of maximum wall shear isalways upstream <strong>the</strong> neck of <strong>the</strong> stenosis (see Figure 9),and moves upstream as <strong>the</strong> Reynolds number increases. Inseries stenoses <strong>the</strong> WSS is significantly increased in <strong>the</strong>distal stenosis, while <strong>the</strong> friction coefficient is smaller<strong>the</strong>re (see column (d)). Generally <strong>the</strong>y have <strong>the</strong>ir maximumat <strong>the</strong> entrance of <strong>the</strong> stenosis and reduce <strong>to</strong>wards<strong>the</strong> end of <strong>the</strong> stenosed section. Eventually <strong>the</strong>y becomenegative after separation of <strong>the</strong> <strong>boundary</strong> <strong>layer</strong>. Theincreased <strong>boundary</strong> <strong>layer</strong> thickness in <strong>the</strong> downstreamstenosis suggests lower retarding forces, however, <strong>the</strong> coreflow velocity is increased <strong>the</strong>re so that pressure losses aredominant <strong>the</strong>re. Consequently <strong>the</strong> second stenosis can beseen as <strong>the</strong> more vulnerable, in wall shear stress and flowlimitation. Likewise <strong>the</strong> mean flow velocity in a pressuredriven vessel is dependent on <strong>the</strong> <strong>to</strong>tal after-load, <strong>the</strong> maximumvalues of wall shear stress are dominant in shortconstrictions (see column (a)), because <strong>the</strong> after-load issmaller and fluid velocity is increased compared <strong>to</strong> longconstrictions (column (l)). Although <strong>the</strong> wall shear isincreased in short constrictions, we observe that <strong>the</strong> peakof <strong>the</strong> viscous friction increases if <strong>the</strong> length of <strong>the</strong> constrictionis increased. In flow driven vessels however <strong>the</strong>peak values are independent of <strong>the</strong> extent, because <strong>the</strong>flow velocity is equal in all cases (not shown here).Wall shear stress oscillations have been observed for variousdownstream locations and severity of deformation.The amplitude of oscillation depends strongly on <strong>the</strong> axialposition and <strong>the</strong> actual state of deformation. The wallshear stress is large in <strong>the</strong> entrance region of <strong>the</strong> deformation,fades <strong>to</strong>wards <strong>the</strong> end and is negative in <strong>the</strong> separationregion, so that <strong>the</strong> development of a<strong>the</strong>rosclerosis ismore likely in segments proximal <strong>to</strong> <strong>the</strong> deformation.Compared <strong>to</strong> wall shear stresses in non-diseased vessels (5– 10 N/m 2 ) vulnerable regions are endo<strong>the</strong>lial cells in <strong>the</strong>throat of a strong deformation. They may experience wallshear stresses in excess of 60 N/m 2 . In series stenoses <strong>the</strong>stresses are largest in <strong>the</strong> downstream stenosis because <strong>the</strong>core flow velocity is increased <strong>the</strong>re. Fur<strong>the</strong>rmore <strong>the</strong> wallshear stresses are no longer likely <strong>to</strong> be distributed evenlyaround <strong>the</strong> circumference of <strong>the</strong> vessel and may be particularlyfocused on <strong>the</strong> most vulnerable shoulder regions,marking <strong>the</strong> transition from normal <strong>to</strong> diseased arterywall. Fur<strong>the</strong>r improvements for <strong>the</strong> prediction of <strong>the</strong> wallshear stress may be obtained by <strong>the</strong> introduction of ashear dependent model <strong>to</strong> predict <strong>the</strong> local blood viscosity.Unsteady solutionsDespite <strong>the</strong> assumption of strong coupling between <strong>the</strong><strong>boundary</strong> <strong>layer</strong>s and <strong>the</strong> core flow and <strong>the</strong> assumption ofquasi-stationary evolution of <strong>the</strong> <strong>boundary</strong> <strong>layer</strong>s, <strong>the</strong>time dependent motion of <strong>the</strong> wall under external deformationreproduces some remarkable characteristics ofmyocardial bridges. In Figure 11 we have shown <strong>the</strong> effec<strong>to</strong>f temporal deformation on<strong>to</strong> <strong>the</strong> pressure and flow in<strong>the</strong> segments Ω 1–5 of a series of two myocardial bridges(see Figure 2). The time dependence of <strong>the</strong> two separationzones, one between <strong>the</strong> two deformations and <strong>the</strong> o<strong>the</strong>rdistal <strong>to</strong> <strong>the</strong> second deformation shows that separationoccurs for deformations greater than about 40%. The separationcycle is present in <strong>the</strong> time interval of 0.1 s <strong>to</strong> 0.4s. The maximum deformation during <strong>the</strong> cycle was 75% ofR 0 , which was reached at 0.3 s. It is seen that during deformation<strong>the</strong> separation point moves somewhat upstream,while <strong>the</strong> reattachment point of <strong>the</strong> <strong>boundary</strong> <strong>layer</strong> movesfar<strong>the</strong>r downstream. The upstream separation zone (turquoisecycle) is spread over a region of 49.94 mm <strong>to</strong> 80.83mm, while <strong>the</strong> downstream separation zone (purple cycle)is from 109.98 mm <strong>to</strong> 193.32 mm. The extensions of <strong>the</strong>Page 17 of 25(page number not for citation purposes)
BioMedical Engineering OnLine 2006, 5:42http://www.biomedical-engineering-online.com/content/5/1/42 Temporal Figure 11evolution of flow variablesTemporal evolution of flow variables. The temporal dependence of pressure and volume flow (left) and <strong>the</strong> separationcycle during deformation (right) of a series of two myocardial bridges are illustrated. The dashed lines represent flow variablesin segments with deformation (Ω s2 (red) and Ω s5 (blue)), while solid lines show <strong>the</strong> flow variables in segments without deformation(Ω s1 (black) proximal, Ω s3 (green) in <strong>the</strong> centre and Ω s6 (yellow) distal <strong>to</strong> <strong>the</strong> stenoses). Separation and reattachment during<strong>the</strong> cardiac cycle was observed for severe deformation between 0.1 s and 0.4 s (right).two zones differ, because <strong>the</strong> upstream reattachmentpoint is forced early due <strong>to</strong> accelerating fluid at <strong>the</strong> inlet of<strong>the</strong> downstream deformation and because <strong>the</strong> core velocityis generally larger fur<strong>the</strong>r downstream. In each casehowever, a <strong>to</strong>p-hat velocity profile develops in sys<strong>to</strong>le,producing large recirculation zones distal <strong>to</strong> <strong>the</strong> stenoses,which are delayed in<strong>to</strong> dias<strong>to</strong>le. The back-flow is developingearlier for severe deformation and is strongly dependen<strong>to</strong>n deformation phase. For phase delayeddeformation, say, by half <strong>the</strong> cycle time (here 500 ms), <strong>the</strong>flow patterns are noticeably different (not shown here).The <strong>to</strong>p-hat profile is now present in dias<strong>to</strong>le, <strong>the</strong> peakvelocities and <strong>the</strong> viscous friction are less pronounced and<strong>the</strong> reverse flow region is smaller and mainly present in<strong>the</strong> dias<strong>to</strong>le. The wall shear stress is dramatically reducedcompared <strong>to</strong> <strong>the</strong> zero phase case, because deformationmaximum falls <strong>to</strong>ge<strong>the</strong>r with <strong>the</strong> haemodynamic conditionspresent in dias<strong>to</strong>le. Fur<strong>the</strong>rmore <strong>the</strong> mean FFR wasincreased <strong>to</strong> 0.65 compared <strong>to</strong> 0.6 of <strong>the</strong> zero phase case.This can be explained by <strong>the</strong> circumstance that no appreciablepressure drop was present at <strong>the</strong> downstream stenosis.Modelling: physiological basisThe simulation of clinical relevant cases requires a specificset of parameters, which however is not available in <strong>the</strong>literature. Due <strong>to</strong> this difficulty we compare <strong>the</strong> FFR rangeobtained with parameters for <strong>the</strong> length and degree ofdeformation given in [38]. The length of <strong>the</strong> myocardialbridge for <strong>the</strong> baseline and dobutamine case were 12 mmand 24 mm respectively. The values for <strong>the</strong> deformationwere ζ baseline = 0.54 and ζ dobutamine = 0.32. To assess <strong>the</strong>dynamics, we have applied more physiological waveforms(aortic pressure conditions) <strong>to</strong> <strong>the</strong> inlet of <strong>the</strong> leftmain coronary artery (LMCA) (see Figure 8). The peakReynolds and Strouhal numbers in <strong>the</strong> myocardial bridgewere 815 and 1069, and 0.021 and 0.016 for <strong>the</strong> baselineand dobutamine case respectively. The Womersleynumber was 4.11.Mean pressure dropThe mean pressure drop was <strong>calculate</strong>d by subtracting <strong>the</strong>average of a distal pressure wave, which was taken approximately3 cm distal <strong>to</strong> <strong>the</strong> myocardial bridge, from <strong>the</strong>average inlet pressure at <strong>the</strong> LMCA. The proximal and distalpressure waves for <strong>the</strong> baseline and while dobutaminechallenge are shown in Figure 12. It is seen that <strong>the</strong> baselinepressure is less affected, while <strong>the</strong> pressure under dob-Page 18 of 25(page number not for citation purposes)
BioMedical Engineering OnLine 2006, 5:42http://www.biomedical-engineering-online.com/content/5/1/42 Specific Figure case 12 of clinical relevanceSpecific case of clinical relevance. Intracoronary pressure at baseline and during dobutamine challenge. The proximal pressure,p proximal was taken from <strong>the</strong> inlet of <strong>the</strong> coronary tree (LMCA), <strong>the</strong> distal pressure, p distal in a segment 3 cm distal <strong>to</strong> <strong>the</strong>myocardial bridge. At baseline <strong>the</strong> mean FFR was 0.90, while during dobutamine challenge <strong>the</strong> mean FFR was 0.84. The correspondingpressure drops were Δp = 1.25 kPa and Δp = 1.54 kPa respectively.utamine challenge shows a pressure notch, which mayappear if <strong>the</strong> deformation is dominant during sys<strong>to</strong>le (seeearlier discussion on that in [46]). At baseline <strong>the</strong> meanpressure at <strong>the</strong> inlet was p p = 11.92 kPa and <strong>the</strong> mean distalpressure was p d = 10.67 kPa, so that <strong>the</strong> pressure drop wasΔp = 1.25 kPa, which compares well with <strong>the</strong> value ofmeasurements mentioned above, where Δp = 1.19 kPa.Under dobutamine challenge <strong>the</strong> corresponding valuesare p p = 9.64 kPa, p d = 8.1 kPa and Δp = 1.54 kPa, whichhowever are close <strong>to</strong> <strong>the</strong> measured values, where Δp = 1.85kPa.We have fur<strong>the</strong>r compared <strong>the</strong> translesional pressure dropacross a series of two myocardial bridges resulting fromHagen-Poiseuille and <strong>boundary</strong> <strong>layer</strong> computations inthree animations, one as reference, without a stenosis(Additional file 1), one assuming a Hagen-Poiseuille flowwith a series stenosis, each of length 8 mm and deformationζ 0 = 0.25 (Additional file 2) and <strong>the</strong> same series stenosiswith <strong>the</strong> <strong>boundary</strong> <strong>layer</strong> <strong>method</strong> described here(Additional file 3). It is clearly seen that <strong>the</strong> sys<strong>to</strong>lic pressurein Additional file 1 is uniformly distributed and fades<strong>to</strong>wards <strong>the</strong> terminals of <strong>the</strong> network. In Additional file 2we notice that during sys<strong>to</strong>le <strong>the</strong> pressure drops in both of<strong>the</strong> stenoses, so that <strong>the</strong> LAD branch is less distributed.However <strong>the</strong> <strong>boundary</strong> <strong>layer</strong> computations in Additionalfile 3 show that <strong>the</strong> pressure drop by <strong>the</strong> assumption offully developed flow was underestimated in <strong>the</strong> case ofdeveloping flow conditions.Fractional flow reserveThe flow limitation caused by epicardial stenoses is generallyexpressed by <strong>the</strong> flow based FFR, which is <strong>the</strong> ratio ofhyperaemic myocardial blood flow in <strong>the</strong> presence of astenosis <strong>to</strong> hyperaemic flow in <strong>the</strong> absence of a stenosis,FFR q = q s /q n , i.e. <strong>the</strong> flow based FFR is <strong>the</strong> fraction of hyperaemicflow that is preserved despite <strong>the</strong> presence of a stenosisin <strong>the</strong> epicardial coronary artery. However thisdefinition is purely <strong>the</strong>oretic, because <strong>the</strong> flow without<strong>the</strong> stenosis is not known, so that for clinical purposes <strong>the</strong>ratio of hyperaemic flows with or without a single stenosisis derived from <strong>the</strong> mean distal coronary pressure p d <strong>to</strong>mean proximal pressure p p recorded simultaneouslyunder conditions of maximum hyperaemia.Neglecting correction terms <strong>the</strong> mean pressure-derivedfractional flow reserve is FFR p = p d /p p . In <strong>the</strong> case of twoconsecutive stenoses however, <strong>the</strong> fluid dynamic interactionbetween <strong>the</strong> stenoses alters <strong>the</strong>ir relative severity andcomplicates determination of <strong>the</strong> FFR for each stenosisseparately from a simple pressure ratio as in a single stenosis.Consequently <strong>the</strong> FFR determined for single stenosisis unreliable in predicting <strong>to</strong> what extent a proximal lesionwill influence myocardial flow after complete relief of <strong>the</strong>distal stenosis, and vice versa.Taking <strong>the</strong> pressure values resulting from <strong>boundary</strong> <strong>layer</strong>computations of <strong>the</strong> previous section, we obtain valuesfor <strong>the</strong> mean pressure derived FFR of 0.90 and 0.84 forbaseline conditions and under dobutamine challengerespectively. These values agree with <strong>the</strong> measurements in[38], where <strong>the</strong> values were 0.90 and 0.84 respectively.Page 19 of 25(page number not for citation purposes)
BioMedical Engineering OnLine 2006, 5:42http://www.biomedical-engineering-online.com/content/5/1/42 Mean Figure fractional 13 flow reserve in dependence on degree of deformation (left) and segment length (right)Mean fractional flow reserve in dependence on degree of deformation (left) and segment length (right). Themean pressure derived fractional flow reserve of <strong>the</strong> baseline environment shown in Figure 8 is plotted as a function of deformation(left) defined in equation (3) and versus <strong>the</strong> segment length (right). The computations via <strong>the</strong> <strong>boundary</strong> <strong>layer</strong> <strong>the</strong>ory(BLT) are compared <strong>to</strong> Hagen-Poiseuille (HP) flow profile (γ = 2). It is seen that <strong>the</strong> mean pressure derived fractional flowreserve is overestimated under <strong>the</strong> assumption of fully developed flow. Generally <strong>the</strong> mean FFR is larger in <strong>the</strong> dynamic case(dashed lines), because <strong>the</strong> pressure recovers during <strong>the</strong> relaxation phase. The segment length of three dynamic lesions at adeformation of ζ 0 = 0.7, 0.5 and 0.3 was varied in a physiological range between 5 mm and 40 mm.In Figure 13 we have shown <strong>the</strong> coronary pressure-derivedfractional flow reserve for <strong>the</strong> baseline case as a measureof coronary stenosis severity (left) and in dependence ondeformation length (right). In both plots we have usedbaseline inflow conditions with ei<strong>the</strong>r fixed (solid lines)and dynamic walls (dashed lines). Initially we found thatin developing flow conditions <strong>the</strong> FFR is overestimated by<strong>the</strong> assumption of Hagen-Poiseuille flow (HP), and, asexpected, that <strong>the</strong> mean FFR in dynamic lesions is muchlarger than in fixed stenotic environment, because <strong>the</strong> distalpressure recovers during relaxation phase. The graph at<strong>the</strong> right shows that <strong>the</strong> mean FFR depends essentially linearlyon deformation length for different severities, ζ 0 =0.7, 0.5, 0.3, suggesting that <strong>the</strong> losses are mainly viscousand that <strong>the</strong> non-linear term plays a minor role forobserved deformations.The values indicate that <strong>the</strong> FFR depends on <strong>the</strong> degreeand length of <strong>the</strong> stenosis. As mentioned earlier <strong>the</strong> lossesin fixed environments are more pronounced. Fur<strong>the</strong>r, wepoint out that series stenoses separated by more than <strong>the</strong>length of <strong>the</strong> stenosis drop below <strong>the</strong> cut-off value of 0.75markedly earlier than single stenosis with <strong>the</strong> same degreeand extent.Pressure-flow relationThe pressure-flow relations for different stenotic environmentsin <strong>the</strong> coronary arteries are shown in Figure 14. Wehave applied a stationary flow rate q LMCA at <strong>the</strong> entrance of<strong>the</strong> LMCA in <strong>the</strong> range between 4.5 cm 3 /s and 9 cm 3 /s. Theresultant mean flow in <strong>the</strong> myocardial bridge, q MB wasbetween 1.57 cm 3 /s and 3.13 cm 3 /s. The pressure-flow relationsin this range are essentially linear and extrapolate <strong>to</strong><strong>the</strong> origin at q LMCA = 0 and Δp = 0. This is consistent with<strong>the</strong> assumption of long waves in short tubes, where <strong>the</strong>pressure-drop is linearily dependent on <strong>the</strong> flow. The singledeformation with length 12 mm is denoted by (S 12)and with length 24 mm by (S 24). We fur<strong>the</strong>r show a doubledeformation with length 12 mm (D 12). In general itis seen that <strong>the</strong> pressure drop increases with severity andlength of <strong>the</strong> deformation, however <strong>the</strong> differencebetween S 24 and D 12, which have essentially <strong>the</strong> samedeformation length, result from inlet and outlet effects of<strong>the</strong> double environment.Influence of wall velocityIn contrast <strong>to</strong> fixed stenoses, <strong>the</strong> velocity of <strong>the</strong> wall ν w ≠ 0in a dynamic environment, i.e. positive during compressionand negative while <strong>the</strong> vessel is relaxing. At <strong>the</strong> bot<strong>to</strong>mof Figure 15 we have shown <strong>the</strong> thickness of <strong>the</strong><strong>boundary</strong> <strong>layer</strong> during inward (left) and outward motion(right) of <strong>the</strong> wall compared <strong>to</strong> fixed deformations. Thesituation depicts two different states where <strong>the</strong> influenceis close <strong>to</strong> its maximum. Compared <strong>to</strong> fixed deformations(ν w = 0) <strong>the</strong> <strong>boundary</strong> <strong>layer</strong> thickness in sys<strong>to</strong>le isincreased in <strong>the</strong> entrance region of <strong>the</strong> deformation, whilePage 20 of 25(page number not for citation purposes)
BioMedical Engineering OnLine 2006, 5:42http://www.biomedical-engineering-online.com/content/5/1/42 Pressure Figure 14 drop vs. volume flowPressure drop vs. volume flow. The pressure-drop flow characteristics of stenoses with different degree and extent whereobtained under stationary flow conditions. We compare two single dynamic stenosis of length 12 mm (S12) and 24 mm (S24)with a double stenosis with length of 12 mm each (D12). Fur<strong>the</strong>r D12 is compared for three severities ζ 0 = 0.25, 0.5 and 0.75.The relations are essentially linear, extrapolation <strong>to</strong> lower inflow values leads <strong>to</strong> <strong>the</strong> origin.it is decreased in <strong>the</strong> outlet region, and <strong>the</strong> situation is viceversa in dias<strong>to</strong>le. In fact this is due <strong>to</strong> an additional pressuregradient, which causes fluid acceleration or decelerationdepending on axial position in <strong>the</strong> constriction andwhe<strong>the</strong>r <strong>the</strong> wall moves inwards or outwards. For exampleduring inwards motion of <strong>the</strong> wall <strong>the</strong> fluid is deceleratedat <strong>the</strong> entrance and accelerated at <strong>the</strong> outlet of <strong>the</strong> deformation,while <strong>the</strong> situation is opposite if <strong>the</strong> vessel wallmoves outwards. Due <strong>to</strong> <strong>the</strong> symmetry of <strong>the</strong> indentation<strong>the</strong>re is no additional acceleration or deceleration in <strong>the</strong>centre of <strong>the</strong> deformation. The influence of <strong>the</strong> wall velocityon<strong>to</strong> <strong>the</strong> <strong>boundary</strong> <strong>layer</strong> properties is more pronouncedif V W /V is reasonably large, i.e. if <strong>the</strong>deformation that <strong>the</strong> axial flow experiences during passageof <strong>the</strong> constriction is comparable <strong>to</strong> <strong>the</strong> radius of <strong>the</strong>tube. The influence of wall velocity on viscous friction andwall shear stress is small and thus <strong>the</strong> difference in pressureloss over <strong>the</strong> deformation with ν w ≠ 0 compared ν w =0 is small (δp ≈ 1% of Δp).DiscussionThe results have demonstrated that <strong>the</strong> formation anddevelopment of flow separation and reattachment in <strong>the</strong>post-stenotic region of a time dependent constriction arePage 21 of 25(page number not for citation purposes)
BioMedical Engineering OnLine 2006, 5:42http://www.biomedical-engineering-online.com/content/5/1/42 Figure Influence 15of <strong>the</strong> wall velocity on <strong>boundary</strong> <strong>layer</strong> thickness, friction coefficient and wall shear stressInfluence of <strong>the</strong> wall velocity on <strong>boundary</strong> <strong>layer</strong> thickness, friction coefficient and wall shear stress. The bot<strong>to</strong>mfigure shows <strong>the</strong> normalised thickness of <strong>the</strong> <strong>boundary</strong> <strong>layer</strong> during in- (left) and outward motion (right) of <strong>the</strong> wall in <strong>the</strong>dynamic configuration presented in <strong>the</strong> third Additional file. Compared <strong>to</strong> zero wall velocity <strong>the</strong> <strong>boundary</strong> <strong>layer</strong> thickness insys<strong>to</strong>le (ν w = 5.1 mm/s) is increased in <strong>the</strong> entrance region of <strong>the</strong> deformation while it is decreased in <strong>the</strong> outlet region, in dias<strong>to</strong>le(ν w = -6.8 mm/s) <strong>the</strong> situation is vice versa. The influence on viscous friction and wall shear stress is small and thus <strong>the</strong> differencein pressure loss over <strong>the</strong> deformation compared <strong>to</strong> ν w = 0 is small (δp ≈ 1% of Δp).very complicated, especially secondary fluid motion in<strong>the</strong> sys<strong>to</strong>lic deceleration phase can cause situations ofreverse flow. The post-stenotic flow is influenced by anumber of fac<strong>to</strong>rs, including <strong>the</strong> degree of stenosis, <strong>the</strong>flow and deformation waveform, and <strong>the</strong> geometry of <strong>the</strong>constriction. The above calculations suggest is that percentdiameter stenosis alone does not adequately characterise<strong>the</strong> flow through myocardial bridges, and that geometricand physiological features such as <strong>the</strong> curvature, extent,and asymmetry of <strong>the</strong> stenosis, and <strong>the</strong> shape of <strong>the</strong> pulsatilewaveform have substantial effects on <strong>the</strong> haemodynamicconditions.However, we found that <strong>the</strong> <strong>to</strong>tal perfusion <strong>to</strong> <strong>the</strong> myocardiumis strongly dependent on <strong>the</strong> severity and length of<strong>the</strong> muscle bridge. The mean FFR in fixed environment isgenerally smaller than in <strong>the</strong> dynamic case because <strong>the</strong>losses are not persistent during periods of small deformation,so that <strong>the</strong> pressure distal <strong>the</strong> bridge recovers duringthis time span. Consequently <strong>the</strong> pressure drop and flowPage 22 of 25(page number not for citation purposes)
BioMedical Engineering OnLine 2006, 5:42http://www.biomedical-engineering-online.com/content/5/1/42reduction across fixed stenoses are more pronounced thanin dynamic environments.As previously noted [8] found that <strong>the</strong> pressure proximal<strong>to</strong> <strong>the</strong> myocardial bridge was higher than <strong>the</strong> aortic pressure,and concluded that <strong>the</strong> disturbance of blood flowand high wall stress proximal <strong>to</strong> <strong>the</strong> myocardial bridgewas <strong>the</strong> main contribu<strong>to</strong>r <strong>to</strong> <strong>the</strong> development of a<strong>the</strong>rosclerosisin <strong>the</strong> proximal segment. The observed wall shearstress distributions indicate that <strong>the</strong> proximal segment ismore susceptible <strong>to</strong> <strong>the</strong> development of a<strong>the</strong>rosclerosis,firstly because <strong>the</strong> pressure is increased <strong>the</strong>re and secondlyfor reasons that <strong>the</strong> wall shear stress and <strong>the</strong>ir oscillationsare maximum in <strong>the</strong> entrance region of <strong>the</strong> deformation.In contrast bridged segments are relatively spared because<strong>the</strong> wall shear stress fades <strong>to</strong>wards <strong>the</strong> end of <strong>the</strong> deformation.In a series of myocardial bridges it is likely that <strong>the</strong>intima between <strong>the</strong> deformations and distal <strong>to</strong> <strong>the</strong> myocardialbridge are protected from a<strong>the</strong>rosclerosis because<strong>the</strong> wall shear stress is very low and negative in separatedflow regions.ConclusionWe have presented a <strong>method</strong> for simulation of unsteadyblood flow in a time dependent vessel geometry using an<strong>integral</strong> <strong>boundary</strong> <strong>layer</strong> <strong>method</strong>. The strong interaction of<strong>the</strong> viscous <strong>boundary</strong> <strong>layer</strong> and <strong>the</strong> inviscid core flow proposedby Veldman [58] models <strong>the</strong> pressure and <strong>the</strong>extent of <strong>the</strong> separation region by assuming Falkner-Skanflow profiles. The equations were modified <strong>to</strong> <strong>the</strong> flow situationunder consideration. Numerical simulations wereperformed for idealised stenosis geometries with a timedependent, smooth wall con<strong>to</strong>ur, but with a physiologicallyrealistic coronary artery flow waveform. The predictedvalues of fractional flow reserve in dynamic lesionsagree well with <strong>the</strong> clinical findings in [38], however, fur<strong>the</strong>rquantification in more defined geometries isrequired.Regarding <strong>the</strong> wall shear stresses and <strong>the</strong> development ofa<strong>the</strong>rosclerosis <strong>the</strong> findings are consistent with [1], where<strong>the</strong> intima beneath <strong>the</strong> bridge is protected from a<strong>the</strong>rosclerosis,and <strong>the</strong> proximal segment is more susceptible <strong>to</strong><strong>the</strong> development of a<strong>the</strong>rosclerotic lesions.Besides <strong>the</strong> advantage of computational time taken for <strong>the</strong>simulation, <strong>the</strong> choice of parameters, such as location,length and severity of <strong>the</strong> lesion are easily determined bycoronary angiography. Due <strong>to</strong> <strong>the</strong> assumptions made in<strong>the</strong> <strong>boundary</strong> <strong>layer</strong> model, <strong>the</strong> approximation fails for <strong>the</strong>prediction of reverse flow and flow where <strong>the</strong> <strong>boundary</strong><strong>layer</strong>s merge, i.e. fully developed flow. Under <strong>the</strong>seaspects severe deformations cannot be <strong>calculate</strong>d, because<strong>the</strong> <strong>boundary</strong> <strong>layer</strong>s merge in <strong>the</strong> deformation. Fur<strong>the</strong>r,<strong>the</strong> length of <strong>the</strong> computational domain is restricted by<strong>the</strong> entrance length, which depends on Reynolds number.And finally <strong>the</strong> pulsatile frequency and <strong>the</strong> frequency ofwall motion has <strong>to</strong> be sufficiently low (a few Hz), so that<strong>the</strong> approximation of quasi-stationary evolution of <strong>the</strong><strong>boundary</strong> <strong>layer</strong>s is satisfied.We believe that <strong>the</strong> parameters and equations in this articleare detailed enough <strong>to</strong> describe <strong>the</strong> physiological consequencesalso in a clinical setting, however, this remains<strong>to</strong> be confirmed by in vivo studies. The functional consequence,especially for severe sys<strong>to</strong>lic compression, is consistentwith clinical findings published in <strong>the</strong> literature [1-3,6,8,38,51], where myocardial bridging is found <strong>to</strong> beresponsible for myocardial ischaemia. The comparison ofour findings with <strong>the</strong> published data from patient studiesin [38,51] supports a potential clinical relevance of oursimulation.Authors' contributionsSB developed <strong>the</strong> <strong>boundary</strong> <strong>layer</strong> model, carried out <strong>the</strong>simulations and drafted <strong>the</strong> manuscript. SM drafted <strong>the</strong>section on <strong>the</strong> clinical situation. AT participated in modeldevelopment in its design and coordination. All authorsread and approved <strong>the</strong> final manuscript.Additional materialAdditional file 1Animation of <strong>the</strong> left descending coronary artery assuming Hagen-Poiseuille flow. The animation shows <strong>the</strong> pressure in <strong>the</strong> main segmentsof <strong>the</strong> left coronary arterial tree during one pulsatile cycle. The unit of <strong>the</strong>colour bar is kPa, <strong>the</strong> playback speed is slower by a fac<strong>to</strong>r of three thanrealtime.Click here for file[http://www.biomedcentral.com/content/supplementary/1475-925X-5-42-S1.mov]Additional file 2Animation of a double myocardial bridge in <strong>the</strong> left descending coronaryartery assuming Hagen-Poiseuille flow. As in <strong>the</strong> first animation<strong>the</strong> pressure in <strong>the</strong> main segments of <strong>the</strong> left coronary arterial tree areshown over one heart cycle. A series of two myocardial bridges with length8 mm and deformation ζ 0 = 0.25 are located in <strong>the</strong> mid LAD. The pressuredrop is underestimated by <strong>the</strong> assumption of Hagen-Poiseuille flow,consequently perfusion <strong>to</strong> <strong>the</strong> myocardium remains nearly unaffected. Theunit of <strong>the</strong> colour bar is kPa, <strong>the</strong> playback speed is slower by a fac<strong>to</strong>r ofthree than realtime.Click here for file[http://www.biomedcentral.com/content/supplementary/1475-925X-5-42-S2.mov]Page 23 of 25(page number not for citation purposes)
BioMedical Engineering OnLine 2006, 5:42http://www.biomedical-engineering-online.com/content/5/1/42Additional file 3Animation of a double myocardial bridge in <strong>the</strong> left descending coronaryartery using <strong>the</strong> proposed <strong>integral</strong> <strong>boundary</strong> <strong>layer</strong> <strong>method</strong>. Theanimation shows <strong>the</strong> pressure in <strong>the</strong> main segments of <strong>the</strong> left coronaryarterial tree over <strong>the</strong> pulsatile cycle. A series of two myocardial bridgeswith length 8 mm and deformation ζ 0 = 0.25 are located in <strong>the</strong> mid LAD.It is seen that <strong>the</strong> pressure drop at <strong>the</strong> second deformation is dominant andthat distal segments are less perfused. In contrast <strong>the</strong> pressure proximal <strong>to</strong><strong>the</strong> deformation and in <strong>the</strong> left circumflex is increased [1,8]. The unit of<strong>the</strong> colour bar is kPa, <strong>the</strong> playback speed is slower by a fac<strong>to</strong>r of three thanrealtime.Click here for file[http://www.biomedcentral.com/content/supplementary/1475-925X-5-42-S3.mov]AcknowledgementsA part of this work was supported by a Georg-Chris<strong>to</strong>ph-LichtenbergScholarship.References1. Alegria JR, Herrmann J, Holmes DR, Lerman A, Rihal CS: Myocardialbridging. Eur Heart J 2005, 26:1159-1168.2. Bourassa MG, Butnaru A, Lesperance J, Tardif JC: Symp<strong>to</strong>maticMyocardial Bridges: Overview of Ischemic Mechanisms andCurrent Diagnostic and Treatment Strategies. J Am Coll Cardiol2003, 41(3):351-359.3. Angelini P, Tivella<strong>to</strong> M, Donis J: Myocardial Bridges: a review.Prog Cardiovasc Dis 1983, 26:75-88.4. de Winter RJ, Kok WEM, Piek JJ: Coronary a<strong>the</strong>rosclerosiswithin a myocardial bridge, not a benign condition. Heart1998, 80:91-93.5. Klues H, Schwarz E: Disturbed intracoronary hemodynamics inmyocardial briding. Circ 1997, 96(9):2905-2913.6. Möhlenkamp S, Hort W, Ge J, Erbel R: Update on MyocardialBridging. Circ 2002, 106(20):2616-2622.7. Herrmann J, Higano ST, Lenon RJ, Rihal CS, Lerman A: Myocardialbridging is associated with alteration in coronary vasoreactivity.Eur Heart J 2004, 25:2134-2142.8. Ge J, Jeremias A, Rupp A, Abels M, Baumgart D, Lui F, Haude M,Görge G, von Birgelen C, Sack S, Erbel R: New signs characteristicof myocardial bridging demonstrated by intracoronaryultrasound and Doppler. Eur Heart J 1999, 20:1707-1716.9. Berger SA, Jou LD: Flows in Stenotic Vessels. Annu Rev Fluid Mech2000, 32:347-382.10. Tu C, Deville M, Dheur L, Vanderschuren L: Finite Element Simulationof Pulsatile Flow through Arterial Stenosis. J Biomech1992, 25(10):1141-1152.11. Sud VK, Srinivasan RS, Charles JB, Bungo MW: Ma<strong>the</strong>matical modellingof <strong>the</strong> human cardiovascular system in <strong>the</strong> presence ofstenosis. Phys Med Biol 1993, 38:369-378.12. Young DF: Fluid mechanics of arterial of stenoses. J Biomech Eng1979, 101:439-448.13. De Bruyne B, Pijls N, Heyndrickx GR, Hodeige D, Kirkeeide R, GouldL: Pressure-Derived Fractional Flow Reserve <strong>to</strong> Assess SerialEpicardial Stenoses. Circ 2000, 101:1840-1847.14. Pijls N, De Bruyne GJW, Band Bech , Liistro F, Heyndrickx GR, BonnierHJRM, Koolen JJ: Coronary Pressure Measurement <strong>to</strong>Assess <strong>the</strong> Hemodynamic Significance of Serial StenosesWithin One Coronary Artery. Circ 2000, 102:2371-2377.15. Seely BD, Young DF: Effect of geometry on pressure lossesacross models of arterial stenoses. J Biomech 1976, 9:439-448.16. Lorzhois S, Lagree PY, Marc-Vergnes JP, Cassot F: Maximum WallShear Stress in Arterial Stenoses: Application <strong>to</strong> <strong>the</strong> InternalCarotid Arteries. J Biomech Eng 2000, 122:1-6.17. Provenzano PP, Rutland CJ: A <strong>boundary</strong> <strong>layer</strong> model for wallshear stress in arterial stenosis. Biorheol 2002, 39:743-754.18. Reese JM, Thompson DD: Shear stress in arterial stenoses: amomentum <strong>integral</strong> model. J Biomech 1998, 31(11):1051-1057.19. Kalse SGC, Bijl H, van Oudheusden BW: A One-Dimensional Viscous-InviscidStrong Interaction Model for Flow in IndentetChannels With Seperation an Reattachment. J Biomed Eng2003, 125:355-362.20. Long Q, Xu XY, Ramnarine KV, Hoskins P: Numerical investigationof physiologically realistic pulsatile flow through arterialstenosis. J Biomech 2001, 34:1229-1242.21. Morgan BE, Young DF: An <strong>integral</strong> <strong>method</strong> for <strong>the</strong> analysis offlow in arterial stenoses. Bull Math Biol 1974, 36:39-53.22. Lui H, Yamaguchi T: Computer modeling of fluid dynamicsrelated <strong>to</strong> a myocardial bridge in a coronary artery. Biorheol1999:373-390.23. Pedley TJ, Stephanoff KD: Flow along a channel with a timedependentindentation in one wall: <strong>the</strong> generation of vorticitywaves. J Fluid Mech 1985, 160:337-367.24. Ralph WE, Pedley TJ: Flow in a channel with moving indentation.J Fluid Mech 1988, 190:87-112.25. Ralph WE, Pedley TJ: Flow in a channel with a time-dependentindentation in one wall. J Biomech Eng 1990, 112:468-475.26. Ikeda T, Matsuzaki Y: A One-Dimensional Unsteady Seperableand Reattachable Flow Model for Collapsible Tube-FlowAnalysis. J Biomech Eng 1999, 121:153-159.27. Matsuzaki Y, Matsumo<strong>to</strong> T, Ikeda T, Kitagawa T: Experiments onSteady and Oscilla<strong>to</strong>ry Flows at Moderate Reynoldsnumbersin a Quasi Two-Dimensional Channel with a Throat. J BiomechEng 1998, 120:594-601.28. Akoi T, Ku DN: Collapse of diseased arteries with eccentriccross section. J Biomech 1993, 26(2):133-142.29. Heil M: S<strong>to</strong>kes flow in collapsible tubes: computation andexperiment. J Fluid Mech 1997, 353:285-312.30. Ku DN: Blood Flow in Arteries. Ann Rev Fluid Mech 1997,29:399-434.31. Pedley TJ: Modelling Flow and Oscillations in CollapsibleTubes. Theo Comp Fluid Dyn 1998, 10:277-294.32. Downing JM, Ku DN: Effects of Frictional Losses and PulsatileFlow on <strong>the</strong> Collapse of Stenotic Arteries. J Biomech Eng 1997,119:317-324.33. Reyman HC: Disertatio de vasis cordis propriis. In PhD <strong>the</strong>sisUniversity Göttingen; 1737.34. White CW, Wright CB, Doty DB: Does visual interpretation of<strong>the</strong> coronary arteriogram predict <strong>the</strong> physiological importanceof a coronary stenosis? N Engl J Med 1984, 310:819-824.35. Vogel RA: Assessing stenosis significance by coronary angiography.Are <strong>the</strong> best variables good enough? J Am Coll Cardiol1988, 12:692-693.36. Pijls NHJ, Van Gelder B, Van der Voort P: Fractional flow reserve:a useful index <strong>to</strong> evaluate <strong>the</strong> influence of an epicardial coronarystenosis on myocardial blood flow. Circ 1995,92:183-193.37. De Bruyne B, Bartunek J, Sys S: Simultaneous coronary pressureand flow velocity measurements in humans. Circ 1996,94:1842-1849.38. Escaned J, Cortes J, Flores A, Goicolea J: Importance of Dias<strong>to</strong>licFractional Flow Reserve and Dobutamine Challenge in PhysiologicAssessment of Myocardial Bridging. J Am Coll Cardiol2003, 42(2):226-233.39. Pijls NHJ, De Bruyne B, Peels K, Van der Voort P, Bonnier HJRM, BartunekJ, Koolen JJ: Measurement of Fractional Flow Reserve <strong>to</strong>asses <strong>the</strong> functional severity of Coronary-Artery Stenoses. NEngl J Med 1996, 334(26):1703-1708.40. Siebes M, Chamuleau SAJ, Meuwissen M: Influence of hemodynamicconditions on fractional flow reserve: parametricanalysis of underlying model. Am J Physiol Heart Circ Physiol 2002,283:H1462-H1470.41. Pijls NHJ, De Bruyne B, Smith L, Aarnoudse W, Barba<strong>to</strong> E, BartunekJ, Bech GJW, van de Vosse FN: Coronary Thermodilution <strong>to</strong>Assess Flow Reserve. Validation in Humans. Circ2002:2482-2486.42. Hau WK: Fractional flow reserve and complex coronary pathologicconditions. Eur Heart J 2004, 25:723-727.43. Fung YC: Biodynamics Circulation Springer-Verlag New York; 1984.44. Pedley TJ: The fluid dynamics of large blood vessels Cambridge UniversityPress; 1980.45. Theoretical Fluid Mechanics Meeting, 2nd, Albuquerque,NM, June 15–18. Modeling friction fac<strong>to</strong>rs in non-circular ducts fordeveloping laminar flow AIAA 1998.Page 24 of 25(page number not for citation purposes)
BioMedical Engineering OnLine 2006, 5:42http://www.biomedical-engineering-online.com/content/5/1/4246. Cances E, Gerbeau JF, (Eds): Oscilla<strong>to</strong>ry flow in a tube with time-dependentwall deformation and its application <strong>to</strong> myocardial bridges Volume 14.ESAIM: Proceedings; 2005.47. Barnard ACL, Hunt WA, Timlake WP, Varley E: A Theory of FluidFlow in Compliant Tubes. Biophys J 1966, 6:717-724.48. Bodley WE: The Non-Linearities of Arterial Blood Flow. PhysMed Biol 1971, 16(4):663-672.49. Canic S, Kim EH: Ma<strong>the</strong>matical analysis of <strong>the</strong> quasilineareffects in hyperbolic model of blood flow through compliantaxi-symmetric vessels. Math Meth Appl Sci 2003,26(14):1161-1186.50. Quarteroni A, Formaggia L: Handbook of Numerical Analysis: ComputationalModels for <strong>the</strong> Human Body Elsevier Amsterdam; 2004.51. Möhlenkamp S, Eggebrecht HTE, Münzberger S, Schweizer T, QuastB, Erbel R: Muskelbrücken der Koronararterien: möglicheischämierelevante Normvarianten. Herz 2005, 30:37-47.52. Zamir M: The Physics of Pulsatile Flow Biological Physics Series,Springer-Verlag Heidelberg; 2000.53. Olufsen MS: Modeling <strong>the</strong> arterial System with Reference <strong>to</strong>an Anestesia Simula<strong>to</strong>r. In PhD <strong>the</strong>sis IMFUFA Roskilde University;1998.54. Westerhof N, Bosnian F, De Vries CJ, Noordergraaf A: Analogstudies of <strong>the</strong> human systemic arterial tree. J Biomech 1969,2:121-143.55. Stergiopulos N, Young DF, Rogge TR: Computer simulation ofarterial flow with applications <strong>to</strong> arterial and aortic stenosis.J Biomech 1992, 25:1477-1488.56. Segers P, Dubois F, Wachter D, Verdonck P: Role and relevancy ofa cardiovascular simula<strong>to</strong>r. J Cardiovasc Eng 1998:48-56.57. Podesser BK, Neumann F, Neumann M, Schreiner W, Wollenek G,Mallinger R: Outer Radius-Wall Thickness Ratio, a PostmortemQuantitative His<strong>to</strong>logy in Human Coronary Arteries.Ada Anat 1998:63-68.58. Veldman AEP: New, Quasi-simultaneous Method <strong>to</strong> <strong>calculate</strong>Interacting Boundary Layers. AIAA Journal 1981, 19:79-85.59. Schlichting H, Gersten K: Boundary-Layer-Theory 8th edition. Springer-Verlag Berlin; 2003.60. White FM: Viscous Fluid Flow McGraw-Hill International Editions, London;1991.61. Ludlow DK, Clarkson PA, Bassom AP: New similarity solutions of<strong>the</strong> unsteady incompressible <strong>boundary</strong>-<strong>layer</strong> equations. JMech appl Math 2000, 53(2):175-206.62. Hartree DR: On an equation occurring in Falkner and Skan'sapproximate treatment of <strong>the</strong> equations of <strong>the</strong> <strong>boundary</strong><strong>layer</strong>. Proc Camb Phil Soc 1937, 33:223-239.63. Sherwin SJ, Franke V, Peiro J: One-dimensional modelling of avascular network in space-time variables. J Eng Math 2003,47:217-250.64. Dinnar U: Cardiovascular Fluid Dynamics CRC Press Inc; 1981.65. Gould KL: Quantification of coronary artery stenosis in vivo.Circ Res 1985, 57:341-353.66. Shah RK: A Correlation for laminar Hydrodynamic EnteryLength Solutions for Circular and Non-Circular Ducts. J FluidsEng 1978, 100:177-179.67. Yilmaz T: General Equations for Pressure Drop for LaminarFlow in Ducts of Arbitrary Cross Sections. Transactions of <strong>the</strong>ASME, J Energ Res Tech 1990, 112:220-223.68. Dodge JT, Brown BG, Bolson EL, Dodge HT: Intrathoracic SpatialLocation of Specified Coronary Segments of <strong>the</strong> NormalHuman Heart. Circ 1988, 78(5):1167-1180.69. Dodge JT, Brown BG, Bolson EL, Dodge HT: Lumen Diameter ofNormal Human Coronary Arteries. Circ 1992, 86:232-246.70. Westerhof N, Elzinga G, Sipkema P: An artificial arterial systemfor pumping herarts. J Appl Physiol 1971, 31:776-781.71. Stergiopulos N, Meister JJ, Westerhof N: Evaluation of <strong>method</strong>sfor estimation of <strong>to</strong>tal arterial compliance. Am J Physiol 1995,268:H1540-H1548.72. Mendez-Nunez LR, Carroll JJ: Comparison of Leapfrog, Smolarkiewicz,and MacCormack Schemes Applied <strong>to</strong> NonlinearEquations. Monthly Wea<strong>the</strong>r Rev 1993, 121(2):565-578.Publish with BioMed Central and everyscientist can read your work free of charge"BioMed Central will be <strong>the</strong> most significant development fordisseminating <strong>the</strong> results of biomedical research in our lifetime."Sir Paul Nurse, Cancer Research UKYour research papers will be:available free of charge <strong>to</strong> <strong>the</strong> entire biomedical communitypeer reviewed and published immediately upon acceptancecited in PubMed and archived on PubMed Centralyours — you keep <strong>the</strong> copyrightBioMedcentralSubmit your manuscript here:http://www.biomedcentral.com/info/publishing_adv.aspPage 25 of 25(page number not for citation purposes)