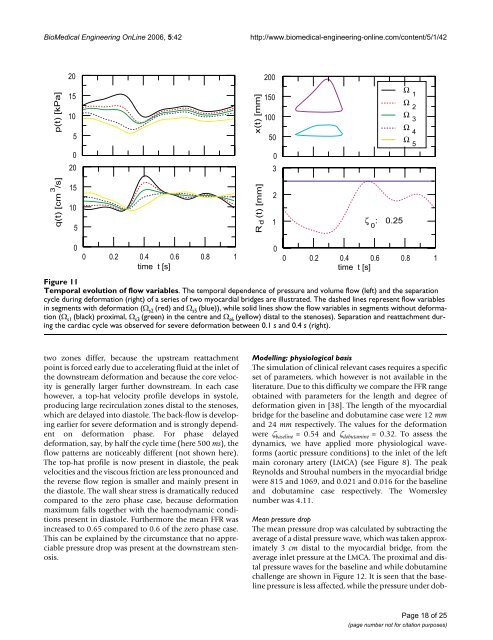
BioMedical Engineering OnLine 2006, 5:42http://www.biomedical-engineering-online.com/content/5/1/42 Temporal Figure 11evolution of flow variablesTemporal evolution of flow variables. The temporal dependence of pressure and volume flow (left) and <strong>the</strong> separationcycle during deformation (right) of a series of two myocardial bridges are illustrated. The dashed lines represent flow variablesin segments with deformation (Ω s2 (red) and Ω s5 (blue)), while solid lines show <strong>the</strong> flow variables in segments without deformation(Ω s1 (black) proximal, Ω s3 (green) in <strong>the</strong> centre and Ω s6 (yellow) distal <strong>to</strong> <strong>the</strong> stenoses). Separation and reattachment during<strong>the</strong> cardiac cycle was observed for severe deformation between 0.1 s and 0.4 s (right).two zones differ, because <strong>the</strong> upstream reattachmentpoint is forced early due <strong>to</strong> accelerating fluid at <strong>the</strong> inlet of<strong>the</strong> downstream deformation and because <strong>the</strong> core velocityis generally larger fur<strong>the</strong>r downstream. In each casehowever, a <strong>to</strong>p-hat velocity profile develops in sys<strong>to</strong>le,producing large recirculation zones distal <strong>to</strong> <strong>the</strong> stenoses,which are delayed in<strong>to</strong> dias<strong>to</strong>le. The back-flow is developingearlier for severe deformation and is strongly dependen<strong>to</strong>n deformation phase. For phase delayeddeformation, say, by half <strong>the</strong> cycle time (here 500 ms), <strong>the</strong>flow patterns are noticeably different (not shown here).The <strong>to</strong>p-hat profile is now present in dias<strong>to</strong>le, <strong>the</strong> peakvelocities and <strong>the</strong> viscous friction are less pronounced and<strong>the</strong> reverse flow region is smaller and mainly present in<strong>the</strong> dias<strong>to</strong>le. The wall shear stress is dramatically reducedcompared <strong>to</strong> <strong>the</strong> zero phase case, because deformationmaximum falls <strong>to</strong>ge<strong>the</strong>r with <strong>the</strong> haemodynamic conditionspresent in dias<strong>to</strong>le. Fur<strong>the</strong>rmore <strong>the</strong> mean FFR wasincreased <strong>to</strong> 0.65 compared <strong>to</strong> 0.6 of <strong>the</strong> zero phase case.This can be explained by <strong>the</strong> circumstance that no appreciablepressure drop was present at <strong>the</strong> downstream stenosis.Modelling: physiological basisThe simulation of clinical relevant cases requires a specificset of parameters, which however is not available in <strong>the</strong>literature. Due <strong>to</strong> this difficulty we compare <strong>the</strong> FFR rangeobtained with parameters for <strong>the</strong> length and degree ofdeformation given in [38]. The length of <strong>the</strong> myocardialbridge for <strong>the</strong> baseline and dobutamine case were 12 mmand 24 mm respectively. The values for <strong>the</strong> deformationwere ζ baseline = 0.54 and ζ dobutamine = 0.32. To assess <strong>the</strong>dynamics, we have applied more physiological waveforms(aortic pressure conditions) <strong>to</strong> <strong>the</strong> inlet of <strong>the</strong> leftmain coronary artery (LMCA) (see Figure 8). The peakReynolds and Strouhal numbers in <strong>the</strong> myocardial bridgewere 815 and 1069, and 0.021 and 0.016 for <strong>the</strong> baselineand dobutamine case respectively. The Womersleynumber was 4.11.Mean pressure dropThe mean pressure drop was <strong>calculate</strong>d by subtracting <strong>the</strong>average of a distal pressure wave, which was taken approximately3 cm distal <strong>to</strong> <strong>the</strong> myocardial bridge, from <strong>the</strong>average inlet pressure at <strong>the</strong> LMCA. The proximal and distalpressure waves for <strong>the</strong> baseline and while dobutaminechallenge are shown in Figure 12. It is seen that <strong>the</strong> baselinepressure is less affected, while <strong>the</strong> pressure under dob-Page 18 of 25(page number not for citation purposes)
BioMedical Engineering OnLine 2006, 5:42http://www.biomedical-engineering-online.com/content/5/1/42 Specific Figure case 12 of clinical relevanceSpecific case of clinical relevance. Intracoronary pressure at baseline and during dobutamine challenge. The proximal pressure,p proximal was taken from <strong>the</strong> inlet of <strong>the</strong> coronary tree (LMCA), <strong>the</strong> distal pressure, p distal in a segment 3 cm distal <strong>to</strong> <strong>the</strong>myocardial bridge. At baseline <strong>the</strong> mean FFR was 0.90, while during dobutamine challenge <strong>the</strong> mean FFR was 0.84. The correspondingpressure drops were Δp = 1.25 kPa and Δp = 1.54 kPa respectively.utamine challenge shows a pressure notch, which mayappear if <strong>the</strong> deformation is dominant during sys<strong>to</strong>le (seeearlier discussion on that in [46]). At baseline <strong>the</strong> meanpressure at <strong>the</strong> inlet was p p = 11.92 kPa and <strong>the</strong> mean distalpressure was p d = 10.67 kPa, so that <strong>the</strong> pressure drop wasΔp = 1.25 kPa, which compares well with <strong>the</strong> value ofmeasurements mentioned above, where Δp = 1.19 kPa.Under dobutamine challenge <strong>the</strong> corresponding valuesare p p = 9.64 kPa, p d = 8.1 kPa and Δp = 1.54 kPa, whichhowever are close <strong>to</strong> <strong>the</strong> measured values, where Δp = 1.85kPa.We have fur<strong>the</strong>r compared <strong>the</strong> translesional pressure dropacross a series of two myocardial bridges resulting fromHagen-Poiseuille and <strong>boundary</strong> <strong>layer</strong> computations inthree animations, one as reference, without a stenosis(Additional file 1), one assuming a Hagen-Poiseuille flowwith a series stenosis, each of length 8 mm and deformationζ 0 = 0.25 (Additional file 2) and <strong>the</strong> same series stenosiswith <strong>the</strong> <strong>boundary</strong> <strong>layer</strong> <strong>method</strong> described here(Additional file 3). It is clearly seen that <strong>the</strong> sys<strong>to</strong>lic pressurein Additional file 1 is uniformly distributed and fades<strong>to</strong>wards <strong>the</strong> terminals of <strong>the</strong> network. In Additional file 2we notice that during sys<strong>to</strong>le <strong>the</strong> pressure drops in both of<strong>the</strong> stenoses, so that <strong>the</strong> LAD branch is less distributed.However <strong>the</strong> <strong>boundary</strong> <strong>layer</strong> computations in Additionalfile 3 show that <strong>the</strong> pressure drop by <strong>the</strong> assumption offully developed flow was underestimated in <strong>the</strong> case ofdeveloping flow conditions.Fractional flow reserveThe flow limitation caused by epicardial stenoses is generallyexpressed by <strong>the</strong> flow based FFR, which is <strong>the</strong> ratio ofhyperaemic myocardial blood flow in <strong>the</strong> presence of astenosis <strong>to</strong> hyperaemic flow in <strong>the</strong> absence of a stenosis,FFR q = q s /q n , i.e. <strong>the</strong> flow based FFR is <strong>the</strong> fraction of hyperaemicflow that is preserved despite <strong>the</strong> presence of a stenosisin <strong>the</strong> epicardial coronary artery. However thisdefinition is purely <strong>the</strong>oretic, because <strong>the</strong> flow without<strong>the</strong> stenosis is not known, so that for clinical purposes <strong>the</strong>ratio of hyperaemic flows with or without a single stenosisis derived from <strong>the</strong> mean distal coronary pressure p d <strong>to</strong>mean proximal pressure p p recorded simultaneouslyunder conditions of maximum hyperaemia.Neglecting correction terms <strong>the</strong> mean pressure-derivedfractional flow reserve is FFR p = p d /p p . In <strong>the</strong> case of twoconsecutive stenoses however, <strong>the</strong> fluid dynamic interactionbetween <strong>the</strong> stenoses alters <strong>the</strong>ir relative severity andcomplicates determination of <strong>the</strong> FFR for each stenosisseparately from a simple pressure ratio as in a single stenosis.Consequently <strong>the</strong> FFR determined for single stenosisis unreliable in predicting <strong>to</strong> what extent a proximal lesionwill influence myocardial flow after complete relief of <strong>the</strong>distal stenosis, and vice versa.Taking <strong>the</strong> pressure values resulting from <strong>boundary</strong> <strong>layer</strong>computations of <strong>the</strong> previous section, we obtain valuesfor <strong>the</strong> mean pressure derived FFR of 0.90 and 0.84 forbaseline conditions and under dobutamine challengerespectively. These values agree with <strong>the</strong> measurements in[38], where <strong>the</strong> values were 0.90 and 0.84 respectively.Page 19 of 25(page number not for citation purposes)
- Page 1 and 2: BioMedical Engineering OnLineBioMed
- Page 3: BioMedical Engineering OnLine 2006,
- Page 6 and 7: BioMedical Engineering OnLine 2006,
- Page 8 and 9: BioMedical Engineering OnLine 2006,
- Page 10 and 11: BioMedical Engineering OnLine 2006,
- Page 12: BioMedical Engineering OnLine 2006,
- Page 15 and 16: BioMedical Engineering OnLine 2006,
- Page 17: BioMedical Engineering OnLine 2006,
- Page 21 and 22: BioMedical Engineering OnLine 2006,
- Page 23 and 24: BioMedical Engineering OnLine 2006,
- Page 25: BioMedical Engineering OnLine 2006,