Transient integral boundary layer method to calculate the ...
Transient integral boundary layer method to calculate the ...
Transient integral boundary layer method to calculate the ...

You also want an ePaper? Increase the reach of your titles
YUMPU automatically turns print PDFs into web optimized ePapers that Google loves.
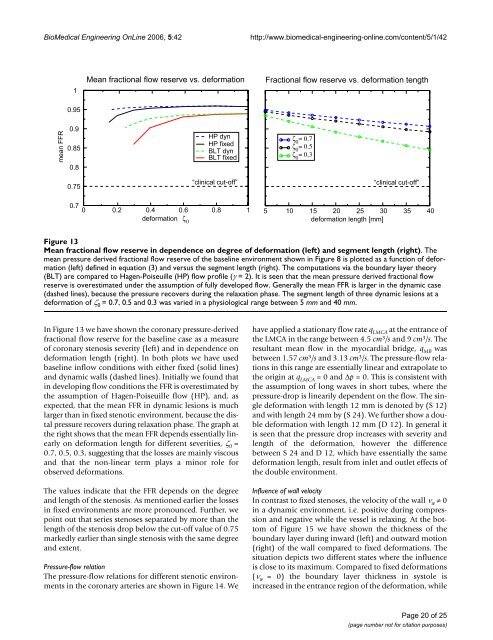
BioMedical Engineering OnLine 2006, 5:42http://www.biomedical-engineering-online.com/content/5/1/42 Mean Figure fractional 13 flow reserve in dependence on degree of deformation (left) and segment length (right)Mean fractional flow reserve in dependence on degree of deformation (left) and segment length (right). Themean pressure derived fractional flow reserve of <strong>the</strong> baseline environment shown in Figure 8 is plotted as a function of deformation(left) defined in equation (3) and versus <strong>the</strong> segment length (right). The computations via <strong>the</strong> <strong>boundary</strong> <strong>layer</strong> <strong>the</strong>ory(BLT) are compared <strong>to</strong> Hagen-Poiseuille (HP) flow profile (γ = 2). It is seen that <strong>the</strong> mean pressure derived fractional flowreserve is overestimated under <strong>the</strong> assumption of fully developed flow. Generally <strong>the</strong> mean FFR is larger in <strong>the</strong> dynamic case(dashed lines), because <strong>the</strong> pressure recovers during <strong>the</strong> relaxation phase. The segment length of three dynamic lesions at adeformation of ζ 0 = 0.7, 0.5 and 0.3 was varied in a physiological range between 5 mm and 40 mm.In Figure 13 we have shown <strong>the</strong> coronary pressure-derivedfractional flow reserve for <strong>the</strong> baseline case as a measureof coronary stenosis severity (left) and in dependence ondeformation length (right). In both plots we have usedbaseline inflow conditions with ei<strong>the</strong>r fixed (solid lines)and dynamic walls (dashed lines). Initially we found thatin developing flow conditions <strong>the</strong> FFR is overestimated by<strong>the</strong> assumption of Hagen-Poiseuille flow (HP), and, asexpected, that <strong>the</strong> mean FFR in dynamic lesions is muchlarger than in fixed stenotic environment, because <strong>the</strong> distalpressure recovers during relaxation phase. The graph at<strong>the</strong> right shows that <strong>the</strong> mean FFR depends essentially linearlyon deformation length for different severities, ζ 0 =0.7, 0.5, 0.3, suggesting that <strong>the</strong> losses are mainly viscousand that <strong>the</strong> non-linear term plays a minor role forobserved deformations.The values indicate that <strong>the</strong> FFR depends on <strong>the</strong> degreeand length of <strong>the</strong> stenosis. As mentioned earlier <strong>the</strong> lossesin fixed environments are more pronounced. Fur<strong>the</strong>r, wepoint out that series stenoses separated by more than <strong>the</strong>length of <strong>the</strong> stenosis drop below <strong>the</strong> cut-off value of 0.75markedly earlier than single stenosis with <strong>the</strong> same degreeand extent.Pressure-flow relationThe pressure-flow relations for different stenotic environmentsin <strong>the</strong> coronary arteries are shown in Figure 14. Wehave applied a stationary flow rate q LMCA at <strong>the</strong> entrance of<strong>the</strong> LMCA in <strong>the</strong> range between 4.5 cm 3 /s and 9 cm 3 /s. Theresultant mean flow in <strong>the</strong> myocardial bridge, q MB wasbetween 1.57 cm 3 /s and 3.13 cm 3 /s. The pressure-flow relationsin this range are essentially linear and extrapolate <strong>to</strong><strong>the</strong> origin at q LMCA = 0 and Δp = 0. This is consistent with<strong>the</strong> assumption of long waves in short tubes, where <strong>the</strong>pressure-drop is linearily dependent on <strong>the</strong> flow. The singledeformation with length 12 mm is denoted by (S 12)and with length 24 mm by (S 24). We fur<strong>the</strong>r show a doubledeformation with length 12 mm (D 12). In general itis seen that <strong>the</strong> pressure drop increases with severity andlength of <strong>the</strong> deformation, however <strong>the</strong> differencebetween S 24 and D 12, which have essentially <strong>the</strong> samedeformation length, result from inlet and outlet effects of<strong>the</strong> double environment.Influence of wall velocityIn contrast <strong>to</strong> fixed stenoses, <strong>the</strong> velocity of <strong>the</strong> wall ν w ≠ 0in a dynamic environment, i.e. positive during compressionand negative while <strong>the</strong> vessel is relaxing. At <strong>the</strong> bot<strong>to</strong>mof Figure 15 we have shown <strong>the</strong> thickness of <strong>the</strong><strong>boundary</strong> <strong>layer</strong> during inward (left) and outward motion(right) of <strong>the</strong> wall compared <strong>to</strong> fixed deformations. Thesituation depicts two different states where <strong>the</strong> influenceis close <strong>to</strong> its maximum. Compared <strong>to</strong> fixed deformations(ν w = 0) <strong>the</strong> <strong>boundary</strong> <strong>layer</strong> thickness in sys<strong>to</strong>le isincreased in <strong>the</strong> entrance region of <strong>the</strong> deformation, whilePage 20 of 25(page number not for citation purposes)