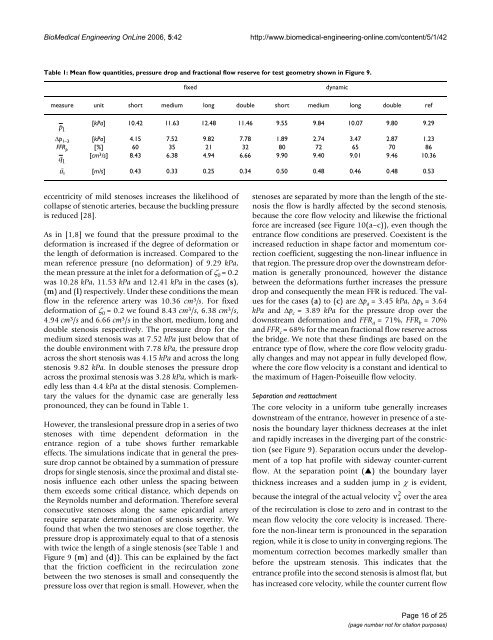
BioMedical Engineering OnLine 2006, 5:42http://www.biomedical-engineering-online.com/content/5/1/42Table 1: Mean flow quantities, pressure drop and fractional flow reserve for test geometry shown in Figure 9.fixeddynamicmeasure unit short medium long double short medium long double refp 1[kPa] 10.42 11.63 12.48 11.46 9.55 9.84 10.07 9.80 9.29Δp 1–3 [kPa] 4.15 7.52 9.82 7.78 1.89 2.74 3.47 2.87 1.23FFR p [%] 60 35 21 32 80 72 65 70 86q 1[cm 3 /s] 8.43 6.38 4.94 6.66 9.90 9.40 9.01 9.46 10.36ū 1 [m/s] 0.43 0.33 0.25 0.34 0.50 0.48 0.46 0.48 0.53eccentricity of mild stenoses increases <strong>the</strong> likelihood ofcollapse of stenotic arteries, because <strong>the</strong> buckling pressureis reduced [28].As in [1,8] we found that <strong>the</strong> pressure proximal <strong>to</strong> <strong>the</strong>deformation is increased if <strong>the</strong> degree of deformation or<strong>the</strong> length of deformation is increased. Compared <strong>to</strong> <strong>the</strong>mean reference pressure (no deformation) of 9.29 kPa,<strong>the</strong> mean pressure at <strong>the</strong> inlet for a deformation of ζ 0 = 0.2was 10.28 kPa, 11.53 kPa and 12.41 kPa in <strong>the</strong> cases (s),(m) and (l) respectively. Under <strong>the</strong>se conditions <strong>the</strong> meanflow in <strong>the</strong> reference artery was 10.36 cm 3 /s. For fixeddeformation of ζ 0 = 0.2 we found 8.43 cm 3 /s, 6.38 cm 3 /s,4.94 cm 3 /s and 6.66 cm 3 /s in <strong>the</strong> short, medium, long anddouble stenosis respectively. The pressure drop for <strong>the</strong>medium sized stenosis was at 7.52 kPa just below that of<strong>the</strong> double environment with 7.78 kPa, <strong>the</strong> pressure dropacross <strong>the</strong> short stenosis was 4.15 kPa and across <strong>the</strong> longstenosis 9.82 kPa. In double stenoses <strong>the</strong> pressure dropacross <strong>the</strong> proximal stenosis was 3.28 kPa, which is markedlyless than 4.4 kPa at <strong>the</strong> distal stenosis. Complementary<strong>the</strong> values for <strong>the</strong> dynamic case are generally lesspronounced, <strong>the</strong>y can be found in Table 1.However, <strong>the</strong> translesional pressure drop in a series of twostenoses with time dependent deformation in <strong>the</strong>entrance region of a tube shows fur<strong>the</strong>r remarkableeffects. The simulations indicate that in general <strong>the</strong> pressuredrop cannot be obtained by a summation of pressuredrops for single stenosis, since <strong>the</strong> proximal and distal stenosisinfluence each o<strong>the</strong>r unless <strong>the</strong> spacing between<strong>the</strong>m exceeds some critical distance, which depends on<strong>the</strong> Reynolds number and deformation. Therefore severalconsecutive stenoses along <strong>the</strong> same epicardial arteryrequire separate determination of stenosis severity. Wefound that when <strong>the</strong> two stenoses are close <strong>to</strong>ge<strong>the</strong>r, <strong>the</strong>pressure drop is approximately equal <strong>to</strong> that of a stenosiswith twice <strong>the</strong> length of a single stenosis (see Table 1 andFigure 9 (m) and (d)). This can be explained by <strong>the</strong> factthat <strong>the</strong> friction coefficient in <strong>the</strong> recirculation zonebetween <strong>the</strong> two stenoses is small and consequently <strong>the</strong>pressure loss over that region is small. However, when <strong>the</strong>stenoses are separated by more than <strong>the</strong> length of <strong>the</strong> stenosis<strong>the</strong> flow is hardly affected by <strong>the</strong> second stenosis,because <strong>the</strong> core flow velocity and likewise <strong>the</strong> frictionalforce are increased (see Figure 10(a–c)), even though <strong>the</strong>entrance flow conditions are preserved. Coexistent is <strong>the</strong>increased reduction in shape fac<strong>to</strong>r and momentum correctioncoefficient, suggesting <strong>the</strong> non-linear influence inthat region. The pressure drop over <strong>the</strong> downstream deformationis generally pronounced, however <strong>the</strong> distancebetween <strong>the</strong> deformations fur<strong>the</strong>r increases <strong>the</strong> pressuredrop and consequently <strong>the</strong> mean FFR is reduced. The valuesfor <strong>the</strong> cases (a) <strong>to</strong> (c) are Δp a = 3.45 kPa, Δp b = 3.64kPa and Δp c = 3.89 kPa for <strong>the</strong> pressure drop over <strong>the</strong>downstream deformation and FFR a = 71%, FFR b = 70%and FFR c = 68% for <strong>the</strong> mean fractional flow reserve across<strong>the</strong> bridge. We note that <strong>the</strong>se findings are based on <strong>the</strong>entrance type of flow, where <strong>the</strong> core flow velocity graduallychanges and may not appear in fully developed flow,where <strong>the</strong> core flow velocity is a constant and identical <strong>to</strong><strong>the</strong> maximum of Hagen-Poiseuille flow velocity.Separation and reattachmentThe core velocity in a uniform tube generally increasesdownstream of <strong>the</strong> entrance, however in presence of a stenosis<strong>the</strong> <strong>boundary</strong> <strong>layer</strong> thickness decreases at <strong>the</strong> inletand rapidly increases in <strong>the</strong> diverging part of <strong>the</strong> constriction(see Figure 9). Separation occurs under <strong>the</strong> developmen<strong>to</strong>f a <strong>to</strong>p hat profile with sideway counter-currentflow. At <strong>the</strong> separation point (▲) <strong>the</strong> <strong>boundary</strong> <strong>layer</strong>thickness increases and a sudden jump in χ is evident,2because <strong>the</strong> <strong>integral</strong> of <strong>the</strong> actual velocity ν x over <strong>the</strong> areaof <strong>the</strong> recirculation is close <strong>to</strong> zero and in contrast <strong>to</strong> <strong>the</strong>mean flow velocity <strong>the</strong> core velocity is increased. Therefore<strong>the</strong> non-linear term is pronounced in <strong>the</strong> separationregion, while it is close <strong>to</strong> unity in converging regions. Themomentum correction becomes markedly smaller thanbefore <strong>the</strong> upstream stenosis. This indicates that <strong>the</strong>entrance profile in<strong>to</strong> <strong>the</strong> second stenosis is almost flat, buthas increased core velocity, while <strong>the</strong> counter current flowPage 16 of 25(page number not for citation purposes)
BioMedical Engineering OnLine 2006, 5:42http://www.biomedical-engineering-online.com/content/5/1/42at <strong>the</strong> walls have disappeared. The reattachment of <strong>the</strong><strong>boundary</strong> <strong>layer</strong> (▼) fur<strong>the</strong>r downstream is caused by shear<strong>layer</strong> friction between <strong>the</strong> recirculation zone and <strong>the</strong> <strong>to</strong>phatprofile, which also causes <strong>the</strong> pressure <strong>to</strong> recover. Due<strong>to</strong> <strong>the</strong> increased momentum correction in that region <strong>the</strong>pressure in <strong>the</strong> non-linear case recovers more rapidly thanin linearised computations, which causes earlier reattachmentand consequently slightly smaller recirculationzones. The extent of <strong>the</strong> recirculation zone is primarilydependent on vessel deformation and Reynolds number,however, we found that <strong>the</strong> extent also correlates with <strong>the</strong>length of <strong>the</strong> constriction. Compared <strong>to</strong> <strong>the</strong> short deformationin Figure 9 (s) <strong>the</strong> tail of <strong>the</strong> shape fac<strong>to</strong>r curvedrops below <strong>the</strong> critical value of 4 (condition for separationor reattachment) by a fac<strong>to</strong>r of about two and threelater for <strong>the</strong> medium (m) and long (l) constriction respectively.In o<strong>the</strong>r words vessels with <strong>the</strong> same degree of stenosis,but with <strong>the</strong> stenosis having different curvaturesand lengths, have recirculation regions that differ markedlyin <strong>the</strong>ir extent. At deformations of 85% <strong>the</strong> recirculationzones had an extent of about 20 tube diameters inlength. However <strong>the</strong> extent of <strong>the</strong> separation region wasfound <strong>to</strong> be strongly dependent on <strong>the</strong> degree of deformationand <strong>the</strong> Reynolds number. The separation pointmoves upstream, while <strong>the</strong> reattachment point movesdownstream if <strong>the</strong> Reynolds number or deformationincreases. A particularity of series stenoses is that <strong>the</strong>extent of <strong>the</strong> recirculation zone in <strong>the</strong> interconnecting segmentis reduced. This is due <strong>to</strong> early reattachment causedby fluid acceleration in <strong>the</strong> converging part of <strong>the</strong> secondstenosis. But none<strong>the</strong>less <strong>the</strong> core flow velocity is generallysmaller compared <strong>to</strong> <strong>the</strong> downstream separationregion.Wall shear stress and friction coefficientFor steady flows <strong>the</strong> location of maximum wall shear isalways upstream <strong>the</strong> neck of <strong>the</strong> stenosis (see Figure 9),and moves upstream as <strong>the</strong> Reynolds number increases. Inseries stenoses <strong>the</strong> WSS is significantly increased in <strong>the</strong>distal stenosis, while <strong>the</strong> friction coefficient is smaller<strong>the</strong>re (see column (d)). Generally <strong>the</strong>y have <strong>the</strong>ir maximumat <strong>the</strong> entrance of <strong>the</strong> stenosis and reduce <strong>to</strong>wards<strong>the</strong> end of <strong>the</strong> stenosed section. Eventually <strong>the</strong>y becomenegative after separation of <strong>the</strong> <strong>boundary</strong> <strong>layer</strong>. Theincreased <strong>boundary</strong> <strong>layer</strong> thickness in <strong>the</strong> downstreamstenosis suggests lower retarding forces, however, <strong>the</strong> coreflow velocity is increased <strong>the</strong>re so that pressure losses aredominant <strong>the</strong>re. Consequently <strong>the</strong> second stenosis can beseen as <strong>the</strong> more vulnerable, in wall shear stress and flowlimitation. Likewise <strong>the</strong> mean flow velocity in a pressuredriven vessel is dependent on <strong>the</strong> <strong>to</strong>tal after-load, <strong>the</strong> maximumvalues of wall shear stress are dominant in shortconstrictions (see column (a)), because <strong>the</strong> after-load issmaller and fluid velocity is increased compared <strong>to</strong> longconstrictions (column (l)). Although <strong>the</strong> wall shear isincreased in short constrictions, we observe that <strong>the</strong> peakof <strong>the</strong> viscous friction increases if <strong>the</strong> length of <strong>the</strong> constrictionis increased. In flow driven vessels however <strong>the</strong>peak values are independent of <strong>the</strong> extent, because <strong>the</strong>flow velocity is equal in all cases (not shown here).Wall shear stress oscillations have been observed for variousdownstream locations and severity of deformation.The amplitude of oscillation depends strongly on <strong>the</strong> axialposition and <strong>the</strong> actual state of deformation. The wallshear stress is large in <strong>the</strong> entrance region of <strong>the</strong> deformation,fades <strong>to</strong>wards <strong>the</strong> end and is negative in <strong>the</strong> separationregion, so that <strong>the</strong> development of a<strong>the</strong>rosclerosis ismore likely in segments proximal <strong>to</strong> <strong>the</strong> deformation.Compared <strong>to</strong> wall shear stresses in non-diseased vessels (5– 10 N/m 2 ) vulnerable regions are endo<strong>the</strong>lial cells in <strong>the</strong>throat of a strong deformation. They may experience wallshear stresses in excess of 60 N/m 2 . In series stenoses <strong>the</strong>stresses are largest in <strong>the</strong> downstream stenosis because <strong>the</strong>core flow velocity is increased <strong>the</strong>re. Fur<strong>the</strong>rmore <strong>the</strong> wallshear stresses are no longer likely <strong>to</strong> be distributed evenlyaround <strong>the</strong> circumference of <strong>the</strong> vessel and may be particularlyfocused on <strong>the</strong> most vulnerable shoulder regions,marking <strong>the</strong> transition from normal <strong>to</strong> diseased arterywall. Fur<strong>the</strong>r improvements for <strong>the</strong> prediction of <strong>the</strong> wallshear stress may be obtained by <strong>the</strong> introduction of ashear dependent model <strong>to</strong> predict <strong>the</strong> local blood viscosity.Unsteady solutionsDespite <strong>the</strong> assumption of strong coupling between <strong>the</strong><strong>boundary</strong> <strong>layer</strong>s and <strong>the</strong> core flow and <strong>the</strong> assumption ofquasi-stationary evolution of <strong>the</strong> <strong>boundary</strong> <strong>layer</strong>s, <strong>the</strong>time dependent motion of <strong>the</strong> wall under external deformationreproduces some remarkable characteristics ofmyocardial bridges. In Figure 11 we have shown <strong>the</strong> effec<strong>to</strong>f temporal deformation on<strong>to</strong> <strong>the</strong> pressure and flow in<strong>the</strong> segments Ω 1–5 of a series of two myocardial bridges(see Figure 2). The time dependence of <strong>the</strong> two separationzones, one between <strong>the</strong> two deformations and <strong>the</strong> o<strong>the</strong>rdistal <strong>to</strong> <strong>the</strong> second deformation shows that separationoccurs for deformations greater than about 40%. The separationcycle is present in <strong>the</strong> time interval of 0.1 s <strong>to</strong> 0.4s. The maximum deformation during <strong>the</strong> cycle was 75% ofR 0 , which was reached at 0.3 s. It is seen that during deformation<strong>the</strong> separation point moves somewhat upstream,while <strong>the</strong> reattachment point of <strong>the</strong> <strong>boundary</strong> <strong>layer</strong> movesfar<strong>the</strong>r downstream. The upstream separation zone (turquoisecycle) is spread over a region of 49.94 mm <strong>to</strong> 80.83mm, while <strong>the</strong> downstream separation zone (purple cycle)is from 109.98 mm <strong>to</strong> 193.32 mm. The extensions of <strong>the</strong>Page 17 of 25(page number not for citation purposes)
- Page 1 and 2: BioMedical Engineering OnLineBioMed
- Page 3: BioMedical Engineering OnLine 2006,
- Page 6 and 7: BioMedical Engineering OnLine 2006,
- Page 8 and 9: BioMedical Engineering OnLine 2006,
- Page 10 and 11: BioMedical Engineering OnLine 2006,
- Page 12: BioMedical Engineering OnLine 2006,
- Page 15: BioMedical Engineering OnLine 2006,
- Page 19 and 20: BioMedical Engineering OnLine 2006,
- Page 21 and 22: BioMedical Engineering OnLine 2006,
- Page 23 and 24: BioMedical Engineering OnLine 2006,
- Page 25: BioMedical Engineering OnLine 2006,