2008 Water Rate and Fee Study - Lake Havasu City
2008 Water Rate and Fee Study - Lake Havasu City
2008 Water Rate and Fee Study - Lake Havasu City

You also want an ePaper? Increase the reach of your titles
YUMPU automatically turns print PDFs into web optimized ePapers that Google loves.
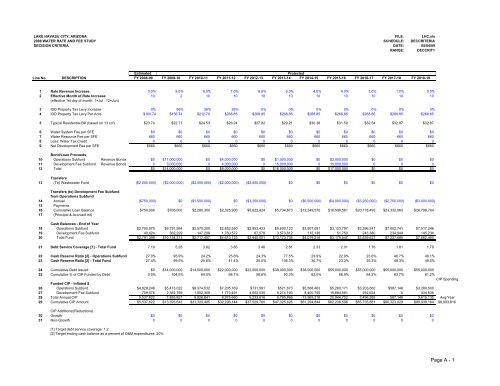
LAKE HAVASU CITY, ARIZONA FILE: LHC.xls<strong>2008</strong> WATER RATE AND FEE STUDY SCHEDULE: DECCRITERIADECISION CRITERIA DATE: 05/04/09RANGE: DECCRIT1EstimatedProjectedLine No. DESCRIPTION FY <strong>2008</strong>-09 FY 2009-10 FY 2010-11 FY 2011-12 FY 2012-13 FY 2013-14 FY 2014-15 FY 2015-16 FY 2016-17 FY 2017-18 FY 2018-191 <strong>Rate</strong> Revenue Increase 0.0% 9.0% 8.0% 7.0% 6.0% 5.0% 4.0% 4.0% 3.0% 1.0% 0.0%2 Effective Month of <strong>Rate</strong> Increase 10 2 10 10 10 10 10 10 10 10 10(effective 1st day of month: 1=Jul 12=Jun)3 IDD Property Tax Levy Increase 0% 56% 36% 26% 0% 0% 0% 0% 0% 0% 0%4 IDD Property Tax Levy Per Acre $100.74 $156.74 $212.70 $268.85 $268.85 $268.85 $268.85 $268.85 $268.85 $268.85 $268.855 Typical Residential Bill (based on 13 ccf) $23.74 $22.71 $24.53 $26.24 $27.82 $29.21 $30.38 $31.59 $32.54 $32.87 $32.876 <strong>Water</strong> System <strong>Fee</strong> per SFE $0 $0 $0 $0 $0 $0 $0 $0 $0 $0 $07 <strong>Water</strong> Resource <strong>Fee</strong> per SFE 660 660 660 660 660 660 660 660 660 660 6608 Less: <strong>Water</strong> Tax Credit 0 0 0 0 0 0 0 0 0 0 09 Net Development <strong>Fee</strong> per SFE $660 $660 $660 $660 $660 $660 $660 $660 $660 $660 $660Bond/Loan Proceeds10 Operations Subfund Revenue Bonds $0 $11,000,000 $0 $4,000,000 $0 $1,000,000 $0 $2,000,000 $0 $0 $011 Development <strong>Fee</strong> Subfund Revenue Bonds 0 3,000,000 0 4,000,000 0 15,000,000 0 15,000,000 0 0 012 Total $0 $14,000,000 $0 $8,000,000 $0 $16,000,000 $0 $17,000,000 $0 $0 $0Transfers13 (To) Wastewater Fund ($2,000,000) ($2,000,000) ($2,000,000) ($2,000,000) ($2,000,000) $0 $0 $0 $0 $0 $0Transfers (to) Development <strong>Fee</strong> Subfundfrom Operations Subfund14 Annual ($750,000) $0 ($1,500,000) $0 ($3,250,000) $0 ($6,500,000) ($4,000,000) ($3,250,000) ($2,750,000) ($3,000,000)15 Payments - - - - - - - - - - -16 Cumulative Loan Balance $750,000 $765,000 $2,280,300 $2,325,906 $5,622,424 $5,734,873 $12,349,570 $16,596,561 $20,178,493 $23,332,063 $26,798,70417 (Principal & Accrued Int)Cash Balances - End of Year18 Operations Subfund $2,750,975 $9,791,984 $2,570,200 $2,852,550 $2,852,423 $9,600,123 $3,907,081 $3,123,797 $3,396,247 $7,002,741 $7,517,24619 Development <strong>Fee</strong> Subfund 40,424 362,229 147,208 1,760,572 87,578 3,573,612 112,136 51,750 243,380 234,944 145,23420 Total Fund $2,791,399 $10,154,213 $2,717,407 $4,613,123 $2,940,001 $13,173,735 $4,019,216 $3,175,547 $3,639,627 $7,237,685 $7,662,48021 Debt Service Coverage [1] - Total Fund 7.19 5.28 3.82 3.86 3.46 2.81 2.33 2.01 1.76 1.81 1.7822 Cash Reserve Ratio [2] - Operations Subfund 27.0% 95.9% 24.2% 25.6% 24.3% 77.5% 29.9% 22.9% 23.6% 46.7% 48.1%23 Cash Reserve Ratio [2] - Total Fund 27.4% 99.5% 25.6% 41.4% 25.0% 106.3% 30.7% 23.3% 25.3% 48.3% 49.0%24 Cumulative Debt Issued $0 $14,000,000 $14,000,000 $22,000,000 $22,000,000 $38,000,000 $38,000,000 $55,000,000 $55,000,000 $55,000,000 $55,000,00025 Cumulative % of CIP Funded by Debt 0.0% 104.5% 60.0% 68.1% 58.6% 80.3% 62.0% 66.9% 64.2% 63.7% 61.2%CIP SpendingFunded CIP - Inflated $26 Operations Subfund $4,828,246 $5,473,022 $8,374,532 $7,205,169 $731,581 $521,673 $5,568,463 $5,260,171 $3,203,662 $587,148 $3,280,50027 Development <strong>Fee</strong> Subfund 709,576 2,382,799 1,552,309 1,770,491 4,502,035 9,274,193 8,400,755 15,684,581 292,624 0 334,63528 Total Annual CIP 5,537,822 7,855,821 9,926,841 8,975,660 5,233,616 9,795,866 13,969,218 20,944,752 3,496,285 587,148 3,615,135 Avg/Year29 Cumulative CIP Amount $5,537,822 $13,393,643 $23,320,485 $32,296,144 $37,529,760 $47,325,626 $61,294,844 $82,239,596 $85,735,881 $86,323,029 $89,938,164 $8,993,816CIP Additions/(Reductions)30 Growth $0 $0 $0 $0 $0 $0 $0 $0 $0 $0 $031 Non-Growth 0 0 0 0 0 0 0 0 0 0 0[1] Target debt service coverage: 1.2[2] Target ending cash balance as a percent of O&M expenditures: 20%Page A - 1