Jaiprakash Associates (JAIASS) - ICICI Direct
Jaiprakash Associates (JAIASS) - ICICI Direct
Jaiprakash Associates (JAIASS) - ICICI Direct
- No tags were found...

You also want an ePaper? Increase the reach of your titles
YUMPU automatically turns print PDFs into web optimized ePapers that Google loves.
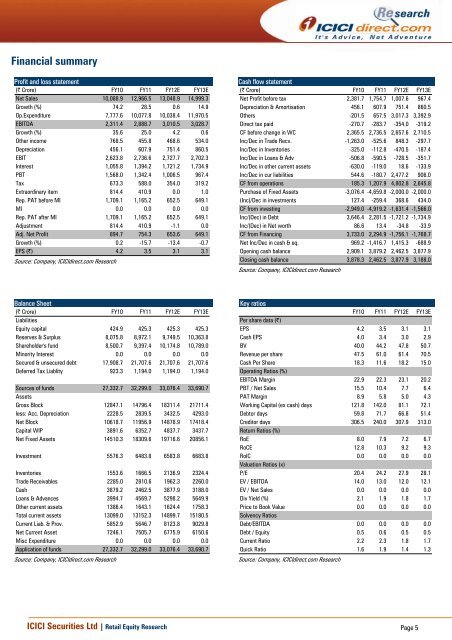
Financial summaryProfit and loss statement(| Crore) FY10 FY11 FY12E FY13ENet Sales 10,088.9 12,966.5 13,048.9 14,999.3Growth (%) 74.2 28.5 0.6 14.9Op.Expenditure 7,777.6 10,077.8 10,038.4 11,970.5EBITDA 2,311.4 2,888.7 3,010.5 3,028.7Growth (%) 35.6 25.0 4.2 0.6Other income 768.5 455.8 468.6 534.0Depreciation 456.1 607.9 751.4 860.5EBIT 2,623.8 2,736.6 2,727.7 2,702.3Interest 1,055.8 1,394.2 1,721.2 1,734.9PBT 1,568.0 1,342.4 1,006.5 967.4Tax 673.3 588.0 354.0 319.2Extraordinary item 814.4 410.9 0.0 1.0Rep. PAT before MI 1,709.1 1,165.2 652.5 649.1MI 0.0 0.0 0.0 0.0Rep. PAT after MI 1,709.1 1,165.2 652.5 649.1Adjustment 814.4 410.9 -1.1 0.0Adj. Net Profit 894.7 754.3 653.6 649.1Growth (%) 0.2 -15.7 -13.4 -0.7EPS (|) 4.2 3.5 3.1 3.1Source: Company, <strong>ICICI</strong>direct.com ResearchCash flow statement(| Crore) FY10 FY11 FY12E FY13ENet Profit before tax 2,381.7 1,754.7 1,007.6 967.4Depreciation & Amortisation 456.1 607.9 751.4 860.5Others -201.5 657.5 3,017.3 3,392.9<strong>Direct</strong> tax paid -270.7 -283.7 -354.0 -319.2CF before change in WC 2,365.5 2,736.5 2,657.6 2,710.5Inc/Dec in Trade Recv. -1,263.0 -525.6 848.3 -297.7Inc/Dec in Inventories -325.0 -112.8 -470.5 -187.4Inc/Dec in Loans & Adv -506.8 -590.5 -728.5 -351.7Inc/Dec in other current assets -630.0 -119.0 18.6 -133.9Inc/Dec in cur liabilities 544.6 -180.7 2,477.2 906.0CF from operations 185.3 1,207.9 4,802.8 2,645.8Purchase of Fixed Assets -3,076.4 -4,659.8 -2,000.0 -2,000.0(Inc)/Dec in investments 127.4 -259.4 368.6 434.0CF from investing -2,949.0 -4,919.2 -1,631.4 -1,566.0Inc/(Dec) in Debt 3,646.4 2,281.5 -1,721.2 -1,734.9Inc/(Dec) in Net worth 86.6 13.4 -34.8 -33.9CF from Financing 3,733.0 2,294.9 -1,756.1 -1,768.7Net Inc/Dec in cash & eq. 969.2 -1,416.7 1,415.3 -688.9Opening cash balance 2,909.1 3,879.2 2,462.5 3,877.9Closing cash balance 3,878.3 2,462.5 3,877.9 3,188.0Source: Company, <strong>ICICI</strong>direct.com ResearchBalance Sheet(| Crore) FY10 FY11 FY12E FY13ELiabilitiesEquity capital 424.9 425.3 425.3 425.3Reserves & Surplus 8,075.8 8,972.1 9,749.5 10,363.8Shareholder's fund 8,500.7 9,397.4 10,174.8 10,789.0Minority Interest 0.0 0.0 0.0 0.0Secured & unsecured debt 17,908.7 21,707.6 21,707.6 21,707.6Deferred Tax Liablity 923.3 1,194.0 1,194.0 1,194.0Sources of funds 27,332.7 32,299.0 33,076.4 33,690.7AssetsGross Block 12847.1 14796.4 18311.4 21711.4less: Acc. Depreciation 2228.5 2839.5 3432.5 4293.0Net Block 10618.7 11956.9 14878.9 17418.4Capital WIP 3891.6 6352.7 4837.7 3437.7Net Fixed Assets 14510.3 18309.6 19716.6 20856.1Investment 5576.3 6483.8 6583.8 6683.8Inventories 1553.6 1666.5 2136.9 2324.4Trade Receivables 2285.0 2810.6 1962.3 2260.0Cash 3879.2 2462.5 3877.9 3188.0Loans & Advances 3994.7 4569.7 5298.2 5649.9Other current assets 1386.4 1643.1 1624.4 1758.3Total current assets 13099.0 13152.3 14899.7 15180.5Current Liab. & Prov. 5852.9 5646.7 8123.8 9029.8Net Current Asset 7246.1 7505.7 6775.9 6150.6Misc Expenditure 0.0 0.0 0.0 0.0Application of funds 27,332.7 32,299.0 33,076.4 33,690.7Source: Company, <strong>ICICI</strong>direct.com ResearchKey ratiosFY10 FY11 FY12E FY13EPer share data (|)EPS 4.2 3.5 3.1 3.1Cash EPS 4.0 3.4 3.0 2.9BV 40.0 44.2 47.8 50.7Revenue per share 47.5 61.0 61.4 70.5Cash Per Share 18.3 11.6 18.2 15.0Operating Ratios (%)EBITDA Margin 22.9 22.3 23.1 20.2PBT / Net Sales 15.5 10.4 7.7 6.4PAT Margin 8.9 5.8 5.0 4.3Working Capital (ex cash) days 121.8 142.0 81.1 72.1Debtor days 59.8 71.7 66.8 51.4Creditor days 306.5 240.0 307.9 313.0Return Ratios (%)RoE 8.0 7.9 7.2 6.7RoCE 12.8 10.3 9.2 9.3RoIC 0.0 0.0 0.0 0.0Valuation Ratios (x)P/E 20.4 24.2 27.9 28.1EV / EBITDA 14.0 13.0 12.0 12.1EV / Net Sales 0.0 0.0 0.0 0.0Div Yield (%) 2.1 1.9 1.8 1.7Price to Book Value 0.0 0.0 0.0 0.0Solvency RatiosDebt/EBITDA 0.0 0.0 0.0 0.0Debt / Equity 0.5 0.6 0.5 0.5Current Ratio 2.2 2.3 1.8 1.7Quick Ratio 1.6 1.9 1.4 1.3Source: Company, <strong>ICICI</strong>direct.com Research<strong>ICICI</strong> Securities Ltd | Retail Equity Research Page 5