ABG Shipyard (ABGSHI) - ICICI Direct
ABG Shipyard (ABGSHI) - ICICI Direct
ABG Shipyard (ABGSHI) - ICICI Direct

You also want an ePaper? Increase the reach of your titles
YUMPU automatically turns print PDFs into web optimized ePapers that Google loves.
Result Update<br />
Rating matrix<br />
Rating : Hold<br />
Target : | 349<br />
Target Period : 12 months<br />
Potential Upside : -5%<br />
WHAT’S CHANGED…<br />
February 18, 2013<br />
<strong>ABG</strong> <strong>Shipyard</strong> (<strong>ABG</strong>SHI)<br />
| 369<br />
Key Financials<br />
(| cr) FY12 FY13E FY14E FY15E<br />
Net Sales 2472.5 2251.6 2398.1 2493.1<br />
EBITDA 698.4 634.1 667.5 704.3<br />
Net Profit 185.8 113.2 130.5 135.1<br />
EPS (|) 36.5 22.2 25.6 26.5<br />
Valuation summary<br />
FY12 FY13E FY14E FY15E<br />
PE (x) 10.1 16.6 14.4 13.9<br />
Target PE (x) 9.6 15.7 13.6 13.2<br />
EV to EBITDA (x) 4.1 4.4 4.0 3.6<br />
Price to book (x) 1.2 1.2 1.1 1.1<br />
RoNW (%) 12.7 11.1 11.6 11.1<br />
RoCE (%) 20.9 19.4 20.6 21.8<br />
Stock data<br />
Market Cap. (| cr) 1878<br />
Debt( FY12) (| cr) 3402<br />
Cash (FY12) (| cr) 365<br />
EV (| cr) 4915<br />
52 week H/L (| cr) 463/ 322<br />
Equity capital (| cr) 50.9<br />
Face value (|) 10<br />
DII Holding (%) 2.5<br />
FII Holding (%) 11.5<br />
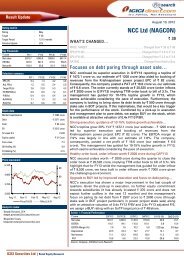
Price movement<br />
6,500<br />
6,000<br />
5,500<br />
5,000<br />
4,500<br />
4,000<br />
Mar-12<br />
Analyst’s name<br />
May-12<br />
Aug-12<br />
<strong>ABG</strong> <strong>Shipyard</strong> (R.H.S)<br />
Bharat Chhoda<br />
bharat.chhoda@icicisecurities.com<br />
Soumojeet Kr Banerjee<br />
soumojeet.banerjee@icicisecurities.com<br />
Nov-12<br />
Nifty (L.H.S)<br />
Feb-13<br />
450<br />
350<br />
250<br />
150<br />
PRICE TARGET…………………………………………….Changed from | 372 to | 349<br />
EPS (FY13E)……………………………………………...Changed from | 29.7 to | 22.2<br />
EPS (FY14E)……………………………………………...Changed from | 34.3 to | 25.6<br />
EPS (FY15E)……………………………………………………….Introduced at | 26.54<br />
RATING…………………………………………………………………….Unchanged<br />
Working capital constraint mars execution…<br />
<strong>ABG</strong> <strong>Shipyard</strong> posted another set of disappointing numbers in Q3FY13<br />
with revenues declining 15.4% QoQ and 22.0% YoY. Revenue for the<br />
quarter stood at | 484.6 crore vis-à-vis | 572.5 crore in Q2FY13. EBITDA<br />
also declined 10.8% in Q3FY13 to | 144.8 crore against | 162.4 crore in<br />
Q2FY13. However, the EBITDA margin improved 153 bps to 29.9% on<br />
account of better inventory management and decline in other expenses<br />
component. PAT for Q3FY13 plummeted significantly by 43.2% to | 18.6<br />
crore in contrast to | 32.8 crore in Q2FY13. PAT continued its downward<br />
spiral on account of augmentation of interest cost, which constitutes 73%<br />
of EBITDA in Q3FY13. Going ahead, we expect working capital constraints<br />
to mar execution capability leading to stumpy revenue generation and<br />
pressure on bottomline.<br />
• Interest cost double whammy; improving order book gives respite<br />
The debt/equity r atio is expected to worsen to 2.7x in FY13E from 2.1x in<br />
FY12. Total outstanding long term debt in FY13E is expected in the range<br />
of | 1300-1500 crore whereas short-term debt is expected around | 2800<br />
crore. Working capital management continues to be a concern as there is<br />
a delay in stage payment from customers, leading to further rise in<br />
interest cost. Hence, execution is getting hampered. Interest cost as a<br />
percentage of EBITDA rose to 73% in Q3FY13 from 64% in Q2FY13. On<br />
the order book front, unexecuted order book was at ~| 10000 crore. The<br />
unexecuted order book is ~4.0x FY15E revenues and provides good<br />
revenue visibility for four years. <strong>ABG</strong> received a repeat order from Indian<br />
Navy to build a cadet training ship in Q3FY13. The order value was | 485<br />
crore taking the gross order book for the defence sector to | 2100 crore.<br />
Over the past year and a half, <strong>ABG</strong> has been able to secure orders from<br />
elite clients like SCI and Indian Navy has improved the quality of order<br />
book and provided comfort about future revenue visibility.<br />
• Valuation stretched on dwindling revenue, increased interest costs<br />
<strong>ABG</strong> <strong>Shipyard</strong>’s working capital constraints together with muted<br />
execution limit the scope to improve multiple. Rolling over the valuation<br />
multiple forward to FY15E, we assign P/BV multiple of 1.0x FY15E and<br />
arrive at a price target of | 349. We maintain our HOLD rating.<br />
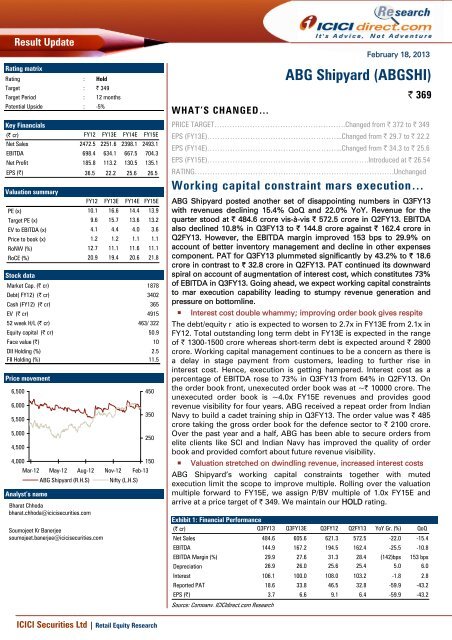
Exhibit 1: Financial Performance<br />
(| cr) Q3FY13 Q3FY13E Q3FY12 Q2FY13 YoY Gr. (%) QoQ<br />
Net Sales 484.6 605.6 621.3 572.5 -22.0 -15.4<br />
EBITDA 144.9 167.2 194.5 162.4 -25.5 -10.8<br />
EBITDA Margin (%) 29.9 27.6 31.3 28.4 (142)bps 153 bps<br />
Depreciation 26.9 26.0 25.6 25.4 5.0 6.0<br />
Interest 106.1 100.0 108.0 103.2 -1.8 2.8<br />
Reported PAT 18.6 33.8 46.5 32.8 -59.9 -43.2<br />
EPS (|) 3.7 6.6 9.1 6.4 -59.9 -43.2<br />
Source: Company, <strong>ICICI</strong>direct.com Research<br />
<strong>ICICI</strong> Securities Ltd | Retail Equity Research
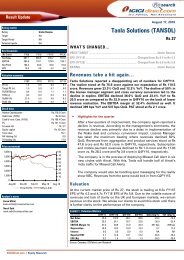
Exhibit 2: Topline performance trend<br />
Decline in revenue continued for Q3FY13 on account of poor<br />
execution due to working capital constraints. Further, we<br />
expect revenue growth to remain depressed in the range of<br />
3-6% in FY14E and FY15E<br />
3000<br />
2500<br />
2000<br />
2251.6<br />
2398.1<br />
2493.1<br />
| cr<br />
1500<br />
1000<br />
500<br />
0<br />
621.3 572.5 484.6<br />
Q3FY12 Q2FY13 Q3FY13 FY13E FY14E FY15E<br />
Revenue<br />
Source: Company, <strong>ICICI</strong>direct.com Research<br />
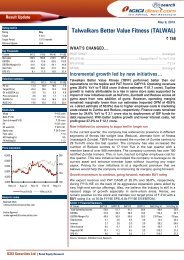
Exhibit 3: EBITDA performance trend<br />
EBITDA margin for Q3FY13 stood at 29.9% taking the nine<br />
month average margin to 28.1%. EBITDA margin is<br />
expected to stabilise at 28% in FY14E as well as FY15E<br />
| cr<br />
880<br />
800<br />
720<br />
640<br />
560<br />
480<br />
400<br />
320<br />
240<br />
160<br />
80<br />
0<br />
31.3<br />
28.4<br />
704.3<br />
29.9 28.2 667.5 27.8<br />
634.1<br />
28.3<br />
194.5<br />
162.4 144.9<br />
Q3FY12 Q2FY13 Q3FY13 FY13E FY14E FY15E<br />
35<br />
30<br />
25<br />
20<br />
15<br />
10<br />
5<br />
0<br />
%<br />
EBITDA<br />
OPM<br />
Source: Company, <strong>ICICI</strong>direct.com Research<br />
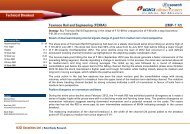
Exhibit 4: PAT performance trend<br />
PAT for Q3FY13 declined massively by 43.2% to<br />
18.6 crore. We expect PAT to remain under<br />
pressure due to continuous bloating of interest<br />
cost. NPM is expected to stabilise in the range of<br />
5-5.5% in FY14E & FY15E as interest cost<br />
hangover remains unabated<br />
| cr<br />
160<br />
140<br />
120<br />
100<br />
80<br />
60<br />
40<br />
20<br />
0<br />
130.5 135.1<br />
113.2<br />
46.5<br />
7.5 32.8<br />
5.4<br />
5.7<br />
5.0<br />
18.6 3.8<br />
5.4<br />
Q3FY12 Q2FY13 Q3FY13 FY13E FY14E FY15E<br />
25.0<br />
20.0<br />
15.0<br />
10.0<br />
5.0<br />
0.0<br />
%<br />
PAT<br />
NPM<br />
Source: Company, <strong>ICICI</strong>direct.com Research<br />
<strong>ICICI</strong> Securities Ltd | Retail Equity Research Page 2
Exhibit 5: Interest cost as percentage of EBITDA<br />
Interest cost continues to haunt <strong>ABG</strong> with interest as a<br />
percentage of EBITDA forming 73% in Q3FY13. We<br />
expect the trend to continue as working capital<br />
management remains a challenging task<br />
250.0<br />
200.0<br />
150.0<br />
100.0<br />
50.0<br />
0.0<br />
73%<br />
194.5<br />
169.68 64%<br />
166.26 162.36<br />
55%<br />
52%<br />
144.85<br />
108.0<br />
43%<br />
103.2<br />
106.1<br />
86.3<br />
73.5<br />
Q3FY12 Q4FY12 Q1FY13 Q2FY13 Q3FY13<br />
80%<br />
70%<br />
60%<br />
50%<br />
40%<br />
30%<br />
20%<br />
10%<br />
0%<br />
EBITDA Interest Interest as a % of EBITDA<br />
Source: Company, <strong>ICICI</strong>direct.com Research<br />
Exhibit 6: Revenue expected to improve in FY14E & FY15E<br />
Order book visibility over four years provides cushion to<br />
revenue. Though execution of the order book is losing<br />
steam amid strained cash flow conditions, we expect<br />
revenue to show modest growth of 3-6% in FY14E-15E<br />
| cr<br />
2600<br />
2500<br />
2400<br />
2300<br />
2200<br />
2100<br />
2000<br />
1900<br />
2472.5<br />
2493.1<br />
2398.1<br />
2251.6<br />
2136.9<br />
FY11 FY12 FY13E FY14E FY15E<br />
Revenue<br />
Source: Company, <strong>ICICI</strong>direct.com Research<br />
Exhibit 7: Operating margin to stabilise, going ahead<br />
The EBITDA margin further improved 153 bps in Q3FY13<br />
to 29.9% on account of inventory management and<br />
lower other expenses. We expect the EBITDA margin to<br />
stabilise around 28% in FY14E-15E<br />
| cr<br />
800<br />
700<br />
600<br />
500<br />
400<br />
300<br />
200<br />
100<br />
0<br />
698.4<br />
704.3<br />
634.1<br />
667.5<br />
28.2<br />
27.8<br />
28.3<br />
518.1<br />
28.2<br />
24.2<br />
FY11 FY12 FY13E FY14E FY15E<br />
35.0<br />
30.0<br />
25.0<br />
20.0<br />
15.0<br />
10.0<br />
5.0<br />
0.0<br />
%<br />
EBITDA EBITDA %<br />
Source: Company, <strong>ICICI</strong>direct.com Research<br />
<strong>ICICI</strong> Securities Ltd | Retail Equity Research Page 3
Exhibit 8: PAT margin expected to decline in FY13E & consolidate at same level in FY14E-15E<br />
250<br />
21.0<br />
| cr<br />
200<br />
150<br />
100<br />
194.0<br />
9.1<br />
185.8<br />
113.2<br />
130.5 135.1<br />
18.0<br />
15.0<br />
12.0<br />
9.0<br />
%<br />
50<br />
7.5<br />
5.0<br />
5.4<br />
5.4<br />
6.0<br />
3.0<br />
0<br />
FY11 FY12 FY13E FY14E FY15E<br />
PAT PAT %<br />
0.0<br />
Source: Company, <strong>ICICI</strong>direct.com Research<br />
Exhibit 9: Debt equity ratio expected to remain stretched<br />
| cr<br />
5000<br />
4500<br />
4000<br />
3500<br />
3000<br />
2500<br />
2000<br />
1500<br />
1000<br />
500<br />
0<br />
4450.8 4739.8<br />
2.6<br />
4188.5<br />
2.7<br />
2.7<br />
3154.5<br />
2.1<br />
1.8<br />
2268.6<br />
FY11 FY12E FY13E FY14E FY15E<br />
Debt Debt-Equity<br />
3.0<br />
2.5<br />
2.0<br />
1.5<br />
1.0<br />
0.5<br />
0.0<br />
Source: Company, <strong>ICICI</strong>direct.com Research<br />
Exhibit 10: Subsidy trend<br />
50.0<br />
40.0<br />
30.0<br />
20.0<br />
10.0<br />
0.0<br />
46.0<br />
40.1<br />
5.2<br />
3.6<br />
29.9<br />
3.3<br />
2.0 19.0<br />
15.8<br />
1.6<br />
1.7<br />
1.4<br />
0.3<br />
10.0<br />
0.0<br />
8.9<br />
2.2<br />
0.3<br />
FY12 FY13E Q1FY12 Q2FY12 Q3FY12 Q4 FY12 Q1FY13 Q2FY13 Q3FY13<br />
6.0<br />
5.0<br />
4.0<br />
3.0<br />
2.0<br />
1.0<br />
0.0<br />
-1.0<br />
Subsidy<br />
subsidy as % of revenues<br />
Source: Company, <strong>ICICI</strong>direct.com Research<br />
<strong>ICICI</strong> Securities Ltd | Retail Equity Research Page 4
Exhibit 15: Shipbuilding Index<br />
1000<br />
800<br />
Index<br />
600<br />
400<br />
Globally, the shipbuilding industry is reeling under a dwindling order<br />
book and cancellation of prevailing orders. Further, the industry is under<br />
significant liquidity crunch as major financial institutions reduce their<br />
exposure to the sector. <strong>ABG</strong> <strong>Shipyard</strong> with its unexecuted order book of<br />
~| 10000 crore provides revenue visibility for four years. Also <strong>ABG</strong><br />
bagged a repeat order to building cadet training ship from Indian Navy in<br />
Q3FY13 reinforcing its ability and patronage from elite clients like Navy<br />
and SCI. These factors provide comfort to the company in terms of<br />
sustainability of future revenue.<br />
200<br />
0<br />
Jan-10<br />
Jul-10<br />
Jan-11<br />
Jul-11<br />
Jan-12<br />
Source: Company, <strong>ICICI</strong>direct.com Research<br />
Jul-12<br />
Jan-13<br />
Global shipbuilding industry woes continue, with waning<br />
order book and drying up of financing options. The index<br />
remained flattish in Q3FY13<br />
<strong>ABG</strong> <strong>Shipyard</strong>’s concern pertaining to working capital management<br />
remains unabated coupled with a slowdown in execution due to strained<br />
cash flow. We have rolled over to FY15E valuation and valued the stock at<br />
1.0x FY15E P/BV to arrive at a target price of | 349. We maintain our<br />
HOLD rating on the stock.<br />
Exhibit 11: Valuation parameter<br />
Valuation based Global average Target multiple Target price (|)<br />
Price to book v 1.68 1.0 349<br />
Target price (|) 349<br />
Current market price (|) 369<br />
Upside (%) (5)<br />
Source: <strong>ICICI</strong>direct.com Research<br />
Exhibit 12: Valuation<br />
Sales Sales EPS EPS PE EV/EBITDA RoNW RoCE<br />
(| cr) Growth (%) (|) Growth (%) (x) (x) (%) (%)<br />
FY13E 2251.6 -8.9 22.2 -39.1 16.6 4.4 11.1 19.4<br />
FY14E 2398.1 6.5 25.6 15.2 14.4 4.0 11.6 20.6<br />
FY15E 2493.1 4.0 26.5 3.6 13.9 3.6 11.1 21.8<br />
Source: Company, <strong>ICICI</strong>direct.com Research<br />
Exhibit 13: Revised estimates<br />
Old<br />
New<br />
(| cr) FY14E FY15E FY14E FY15E<br />
Sales 2854.3 0.0 2398.1 2493.1<br />
EBITDA 835.9 0.0 667.5 704.3<br />
Net Profit 174.8 0.0 130.5 135.1<br />
EPS 34.3 0.0 25.6 26.5<br />
Source: Company, <strong>ICICI</strong>direct.com Research<br />
Exhibit 14: Assumptions<br />
FY14E<br />
FY15E<br />
Order book execution rate % 21.50 23.50<br />
Susidy accounted 2.67% 2.68%<br />
Dollar Rupee Exchange rate 54 54<br />
Source: Company, <strong>ICICI</strong>direct.com Research<br />
<strong>ICICI</strong> Securities Ltd | Retail Equity Research Page 5
Financial summary<br />
Profit and loss statement<br />
(| Crore)<br />
(Year-end March) FY12 FY13E FY14E FY15E<br />
Total operating Income 2,472.5 2,251.6 2,398.1 2,493.1<br />
Growth (%) 15.7 -8.9 6.5 4.0<br />
Raw Material Expenses 1,264.6 1,097.3 1,171.7 1,212.9<br />
Employee Expenses 99.1 81.1 86.3 87.3<br />
Mfg & Other expenses 432.7 382.8 407.7 423.8<br />
Incr/Decr in WIP -22.4 0.6 0.6 0.5<br />
Other expenses 0.0 0.0 0.0 0.0<br />
Total Operating Expenditure 1,774.1 1,617.5 1,730.6 1,788.8<br />
EBITDA 698.4 634.1 667.5 704.3<br />
Growth (%) 28.2 28.2 27.8 28.3<br />
Depreciation 109.7 101.1 103.7 117.0<br />
Interest 343.1 404.4 414.7 431.9<br />
Other Income 43.7 50.0 50.0 50.0<br />
PBT 289.3 178.5 199.1 205.4<br />
Others -5.0 -3.5 1.2 1.6<br />
Total Tax 98.6 61.8 69.8 71.9<br />
PAT 185.8 113.2 130.5 135.1<br />
Growth (%) -4.2 -39.1 15.2 3.6<br />
EPS (|) 36.5 22.2 25.6 26.5<br />
Source: Company, <strong>ICICI</strong>direct.com Research<br />
Cash flow statement<br />
(| Crore)<br />
(Year-end March) FY12 FY13E FY14E FY15E<br />
Profit after Tax 185.8 113.2 113.2 130.5<br />
Add: Depreciation 109.7 101.1 101.1 103.7<br />
(Inc)/dec in Current Ass -1,270.4 -199.3 -199.3 -333.5<br />
Inc/(dec) in CL and Prov 224.0 -139.7 -139.7 281.6<br />
Others 379.4 3.5 3.5 -1.2<br />
CF from operating activi -371.5 -121.1 -121.1 181.2<br />
(Inc)/dec in Investments 1.4 0.0 0.0 0.0<br />
(Inc)/dec in Fixed Asset -556.4 -101.1 -101.1 -103.7<br />
Others 0.0 0.0 0.0 0.0<br />
CF from investing activi -555.0 -101.1 -101.1 -103.7<br />
Issue/(Buy back) of Equ 0.0 0.0 0.0 0.0<br />
Inc/(dec) in loan funds 871.8 169.3 169.3 -122.8<br />
Dividend paid & dividend -23.6 0.0 0.0 23.8<br />
Inc/(dec) in Sec. premiu 0.0 0.0 0.0 0.0<br />
Others 0.0 0.0 0.0 0.0<br />
CF from financing activi 848.2 169.3 169.3 -99.0<br />
Net Cash flow -280.1 -53.0 -53.0 -21.5<br />
Opening Cash 644.7 364.8 364.8 374.5<br />
Closing Cash 364.8 374.5 344.5 424.7<br />
Source: Company, <strong>ICICI</strong>direct.com Research<br />
Balance sheet<br />
(| Crore)<br />
(Year-end March) FY12 FY13E FY14E FY15E<br />
Liabilities<br />
Equity Capital 50.9 50.9 50.9 50.9<br />
Reserve and Surplus 1,452.7 1,510.3 1,616.9 1,728.2<br />
Total Shareholders funds 1,503.6 1,561.2 1,667.8 1,779.1<br />
Long term Borrowings 1,365.3 1,534.6 1,411.7 1,287.2<br />
Deferred Tax Liability 466.3 466.3 466.3 466.3<br />
Minority Interest 9.3 12.8 11.7 10.0<br />
Total Liabilities 3,350.4 3,574.9 3,557.5 3,542.6<br />
Assets<br />
Gross Block 1,525.3 1,625.3 1,700.3 1,775.3<br />
Less: Acc Depreciation 445.4 546.5 650.3 767.3<br />
Net Block 1,079.9 1,078.8 1,050.0 1,008.0<br />
Capital WIP 1,424.0 1,324.0 1,249.0 1,174.0<br />
Intangible assets 36.0 36.0 36.0 36.0<br />
Total Fixed Assets 2,539.81 2,438.69 2,334.95 2,217.91<br />
Non Current Investments 6.8 6.8 6.8 6.8<br />
Long term loans and advances 725.1 732.3 796.9 864.7<br />
Current Investments 222.1 222.1 222.1 222.1<br />
Inventory 3,357.5 3,547.0 3,679.3 3,790.9<br />
Debtors 72.1 92.5 98.6 102.5<br />
Loans and Advances 1,296.7 1,233.8 1,314.0 1,366.1<br />
Other Current Assets 522.4 574.6 689.5 827.4<br />
Cash 364.8 374.5 344.5 424.7<br />
Total Current Assets 5,835.53 6,044.59 6,348.03 6,733.71<br />
Short term borrowings 2,036.70 2,851.38 3,136.52 3,450.17<br />
Creditors 1,071.7 925.3 919.8 956.3<br />
other curr liab & Provisions 2,678.9 1,870.8 1,872.8 1,874.1<br />
Total Current Liabilities 5,787.22 5,647.52 5,929.17 6,280.56<br />
Net Current Assets 48.31 397.07 418.86 453.14<br />
Others non current assets 30.4 0.0 0.0 0.0<br />
Application of Funds 3,350.4 3,574.9 3,557.5 3,542.6<br />
Key ratios<br />
(Year-end March) FY12 FY13E FY14E FY15E<br />
Per share data (|)<br />
EPS 36.5 22.2 22.2 25.6<br />
Cash EPS 59.0 53.8 53.8 58.4<br />
BV 295.3 306.6 306.6 327.5<br />
DPS 0.0 4.0 4.0 4.0<br />
Cash Per Share 71.6 73.6 73.6 67.7<br />
Operating Ratios (%)<br />
PBT / Total Operating in 11.7 7.9 7.9 8.3<br />
Inventory days 495.7 575.0 575.0 560.0<br />
Debtor days 10.6 15.0 15.0 15.0<br />
Creditor days 158.2 150.0 150.0 140.0<br />
Return Ratios (%)<br />
RoE 12.7 11.1 11.1 11.6<br />
RoCE 20.9 19.4 19.4 20.6<br />
RoIC 7.4 4.2 4.2 4.8<br />
Valuation Ratios (x)<br />
P/E 10.1 16.6 16.6 14.4<br />
EV / EBITDA 4.1 4.4 4.4 4.0<br />
EV / Net Sales 1.2 1.3 1.3 1.2<br />
Market Cap / Sales 0.8 0.8 0.8 0.8<br />
Price to Book Value 1.2 1.2 1.2 1.1<br />
Solvency Ratios<br />
Debt/EBITDA 2.0 2.4 2.4 2.1<br />
Debt / Equity 2.1 2.7 2.7 2.7<br />
Current Ratio 2.0 2.0 2.0 2.0<br />
Quick Ratio 2.3 2.7 2.7 2.9<br />
Source: Company, <strong>ICICI</strong>direct.com Research<br />
Source: Company, <strong>ICICI</strong>direct.com Research<br />
<strong>ICICI</strong> Securities Ltd | Retail Equity Research Page 6
Company Description<br />
<strong>ABG</strong> <strong>Shipyard</strong> Limited is a private sector ship building company with<br />
facilities to build and repair a variety of marine ships. The company<br />
manufactures bulk carriers, deck barges, interceptor boats and offshore<br />
vessels. The company serves commercial and government customers.<br />
Exhibit 15: Recommendation History<br />
500<br />
450<br />
400<br />
350<br />
300<br />
250<br />
200<br />
150<br />
100<br />
50<br />
0<br />
Mar-12<br />
Apr-12<br />
May-12<br />
Jul-12<br />
Aug-12<br />
Oct-12<br />
Nov-12<br />
Jan-13<br />
Feb-13<br />
Price<br />
Target Price<br />
Source: Company, <strong>ICICI</strong>direct.com Research<br />
Exhibit 16: Recent Releases<br />
Date Event CMP Target Price Rating<br />
6-Jan-12 Q3FY12 Result preview 392 373 HOLD<br />
21-Feb-12 Q3FY12 Result Update 434 427 HOLD<br />
7-Jun-12 Q4FY12 Result update 377 432 BUY<br />
21-Aug-12 Q1FY13 Result Update 360 375 HOLD<br />
12-Nov-12 Q2FY13 Result Update 393 372 HOLD<br />
8-Jan-13 Q3FY13 Result Preview 410 372<br />
Source: Company, <strong>ICICI</strong>direct.com Research<br />
HOLD<br />
<strong>ICICI</strong> Securities Ltd | Retail Equity Research Page 7
<strong>ICICI</strong>direct.com coverage universe (Shipping)<br />
EPS (|) P/E (x) EV/EBITDA (x)<br />
RoCE (%) RoE (%)<br />
CMP (|) TP (|) Rating Mcap (| Cr) FY12E FY13E FY14E FY12E FY13E FY14E FY12E FY13E FY14E FY12E FY13E FY14E FY12E FY13E FY14E<br />
Aban Offshore 316 386 BUY 1,392.0 40.2 60.4 65.5 8.9 5.9 5.4 6.0 5.7 5.3 10.4 10.5 11.0 5.5 8.1 8.5<br />
<strong>ABG</strong> <strong>Shipyard</strong> 369 349 HOLD 2,005.5 22.2 25.6 26.5 16.6 14.4 13.9 4.4 4.0 3.6 19.4 20.6 21.8 11.1 11.6 11.1<br />
G.E Shipping 256 280 HOLD 3,739.2 35.1 38.6 44.6 7.1 6.4 5.6 4.8 3.5 2.3 4.6 5.5 5.9 8.0 8.2 8.8<br />
Global Offshore 62 85 BUY 142.8 21.8 19.8 21.1 2.8 3.1 2.9 4.6 5.8 5.6 9.0 8.7 8.3 17.1 13.5 12.6<br />
Mercator Ltd 20 20 HOLD 441.0 0.8 1.9 3.6 23.5 10.1 5.4 5.0 4.3 3.8 3.5 4.7 5.6 0.8 1.9 3.5<br />
Pipavav Defence 85 89 HOLD 5,944.3 0.3 0.6 1.5 260.8 150.3 54.3 19.1 15.8 13.6 8.5 9.0 10.0 1.1 1.8 4.7<br />
SCI 48 48 HOLD 2,496.7 -9.2 -0.6 -6.3 - - - 282.4 26.2 30.2 -4.7 -3.4 -3.5 -6.4 -0.4 -4.5<br />
Source: Company, <strong>ICICI</strong>direct.com Research<br />
Global Valuation (Shipping)<br />
P/BV (x) P/E (x) EV/EBITDA (x) ROE (%)<br />
Company<br />
Country CY11 CY12E CY13E CY11 CY12E CY13E CY11 CY12E CY13E CY11 CY12E CY13E<br />
Shipbuilding<br />
Daewoo Shipbuilding* South Korea 1.1 1.1 1.0 14.5 11.8 9.1 11.5 10.6 8.9 8.0 9.3 11.0<br />
Hyundai Heavy Industries* South Korea 0.9 0.8 0.8 9.5 8.3 7.4 8.1 7.3 6.6 9.1 10.0 11.0<br />
Keppel Corp. Ltd* Singapore 2.3 2.1 2.0 10.4 13.0 12.7 10.2 12.2 11.7 23.4 16.8 16.2<br />
Samsung Heavy Industries* South Korea 1.6 1.4 1.2 10.0 9.9 9.0 6.4 6.4 6.0 20.6 16.3 15.5<br />
Sembcorp Marine* Singapore 3.6 3.9 3.5 12.8 16.1 14.1 10.0 11.4 9.6 17.0 14.9 14.4<br />
<strong>ABG</strong> <strong>Shipyard</strong># India 1.2 1.2 1.1 16.6 16.6 14.4 4.4 4.4 4.0 11.1 11.1 11.6<br />
Pipavav Defence & Offshore Engineering Co# India 2.9 2.7 2.5 260.8 150.3 54.3 19.1 15.8 13.6 1.1 1.8 4.7<br />
Pipavav <strong>Shipyard</strong># India 3.2 3.1 2.9 - - 41.7 - 80.3 20.6 - - 6.9<br />
# With regards to Indian companies three year data represents FY12, FY13 and FY14 (financial year ending in March)<br />
<strong>ICICI</strong> Securities Ltd | Retail Equity Research Page 8
RATING RATIONALE<br />
<strong>ICICI</strong>direct.com endeavours to provide objective opinions and recommendations. <strong>ICICI</strong>direct.com assigns<br />
ratings to its stocks according to their notional target price vs. current market price and then categorises them<br />
as Strong Buy, Buy, Hold and Sell. The performance horizon is two years unless specified and the notional<br />
target price is defined as the analysts' valuation for a stock.<br />
Strong Buy: >15%/20% for large caps/midcaps, respectively, with high conviction;<br />
Buy: >10%/15% for large caps/midcaps, respectively;<br />
Hold: Up to +/-10%;<br />
Sell: -10% or more;<br />
Pankaj Pandey Head – Research pankaj.pandey@icicisecurities.com<br />
<strong>ICICI</strong>direct.com Research Desk,<br />
<strong>ICICI</strong> Securities Limited,<br />
1 st Floor, Akruti Trade Centre,<br />
Road No. 7, MIDC,<br />
Andheri (East)<br />
Mumbai – 400 093<br />
research@icicidirect.com<br />
ANALYST CERTIFICATION<br />
We /I, Bharat Chhoda MBA, Soumojeet Kr Banerjee, MBA research analysts, authors and the names subscribed to this report, hereby certify that all of the views expressed in this research report accurately<br />
reflect our personal views about any and all of the subject issuer(s) or securities. We also certify that no part of our compensation was, is, or will be directly or indirectly related to the specific<br />
recommendation(s) or view(s) in this report. Analysts aren't registered as research analysts by FINRA and might not be an associated person of the <strong>ICICI</strong> Securities Inc.<br />
Disclosures:<br />
<strong>ICICI</strong> Securities Limited (<strong>ICICI</strong> Securities) and its affiliates are a full-service, integrated investment banking, investment management and brokerage and financing group. We along with affiliates are leading<br />
underwriter of securities and participate in virtually all securities trading markets in India. We and our affiliates have investment banking and other business relationship with a significant percentage of<br />
companies covered by our Investment Research Department. Our research professionals provide important input into our investment banking and other business selection processes. <strong>ICICI</strong> Securities<br />
generally prohibits its analysts, persons reporting to analysts and their dependent family members from maintaining a financial interest in the securities or derivatives of any companies that the analysts<br />
cover.<br />
The information and opinions in this report have been prepared by <strong>ICICI</strong> Securities and are subject to change without any notice. The report and information contained herein is strictly confidential and<br />
meant solely for the selected recipient and may not be altered in any way, transmitted to, copied or distributed, in part or in whole, to any other person or to the media or reproduced in any form, without<br />
prior written consent of <strong>ICICI</strong> Securities. While we would endeavour to update the information herein on reasonable basis, <strong>ICICI</strong> Securities, its subsidiaries and associated companies, their directors and<br />
employees (“<strong>ICICI</strong> Securities and affiliates”) are under no obligation to update or keep the information current. Also, there may be regulatory, compliance or other reasons that may prevent <strong>ICICI</strong> Securities<br />
from doing so. Non-rated securities indicate that rating on a particular security has been suspended temporarily and such suspension is in compliance with applicable regulations and/or <strong>ICICI</strong> Securities<br />
policies, in circumstances where <strong>ICICI</strong> Securities is acting in an advisory capacity to this company, or in certain other circumstances.<br />
This report is based on information obtained from public sources and sources believed to be reliable, but no independent verification has been made nor is its accuracy or completeness guaranteed. This<br />
report and information herein is solely for informational purpose and may not be used or considered as an offer document or solicitation of offer to buy or sell or subscribe for securities or other financial<br />
instruments. Though disseminated to all the customers simultaneously, not all customers may receive this report at the same time. <strong>ICICI</strong> Securities will not treat recipients as customers by virtue of their<br />
receiving this report. Nothing in this report constitutes investment, legal, accounting and tax advice or a representation that any investment or strategy is suitable or appropriate to your specific<br />
circumstances. The securities discussed and opinions expressed in this report may not be suitable for all investors, who must make their own investment decisions, based on their own investment<br />
objectives, financial positions and needs of specific recipient. This may not be taken in substitution for the exercise of independent judgment by any recipient. The recipient should independently evaluate<br />
the investment risks. The value and return of investment may vary because of changes in interest rates, foreign exchange rates or any other reason. <strong>ICICI</strong> Securities and affiliates accept no liabilities for any<br />
loss or damage of any kind arising out of the use of this report. Past performance is not necessarily a guide to future performance. Investors are advised to see Risk Disclosure Document to understand the<br />
risks associated before investing in the securities markets. Actual results may differ materially from those set forth in projections. Forward-looking statements are not predictions and may be subject to<br />
change without notice.<br />
<strong>ICICI</strong> Securities and its affiliates might have managed or co-managed a public offering for the subject company in the preceding twelve months. <strong>ICICI</strong> Securities and affiliates might have received<br />
compensation from the companies mentioned in the report during the period preceding twelve months from the date of this report for services in respect of public offerings, corporate finance, investment<br />
banking or other advisory services in a merger or specific transaction. It is confirmed that Bharat Chhoda MBA, Soumojeet Kr Banerjee, MBA research analysts and the authors of this report have not<br />
received any compensation from the companies mentioned in the report in the preceding twelve months. Our research professionals are paid in part based on the profitability of <strong>ICICI</strong> Securities, which<br />
include earnings from Investment Banking and other business.<br />
<strong>ICICI</strong> Securities or its subsidiaries collectively do not own 1% or more of the equity securities of the Company mentioned in the report as of the last day of the month preceding the publication of the<br />
research report.<br />
It is confirmed that Bharat Chhoda MBA, Soumojeet Kr Banerjee, MBA research analysts and the authors of this report or any of their family members does not serve as an officer, director or advisory<br />
board member of the companies mentioned in the report.<br />
<strong>ICICI</strong> Securities may have issued other reports that are inconsistent with and reach different conclusion from the information presented in this report. <strong>ICICI</strong> Securities and affiliates may act upon or make use<br />
of information contained in the report prior to the publication thereof.<br />
This report is not directed or intended for distribution to, or use by, any person or entity who is a citizen or resident of or located in any locality, state, country or other jurisdiction, where such distribution,<br />
publication, availability or use would be contrary to law, regulation or which would subject <strong>ICICI</strong> Securities and affiliates to any registration or licensing requirement within such jurisdiction. The securities<br />
described herein may or may not be eligible for sale in all jurisdictions or to certain category of investors. Persons in whose possession this document may come are required to inform themselves of and<br />
to observe such restriction.<br />
<strong>ICICI</strong> Securities Ltd | Retail Equity Research Page 9