Lovable Lingerie Ltd (LOVLIN) - ICICI Direct
Lovable Lingerie Ltd (LOVLIN) - ICICI Direct
Lovable Lingerie Ltd (LOVLIN) - ICICI Direct
- No tags were found...

You also want an ePaper? Increase the reach of your titles
YUMPU automatically turns print PDFs into web optimized ePapers that Google loves.
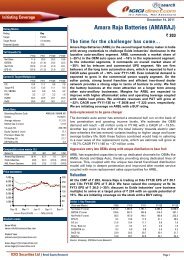
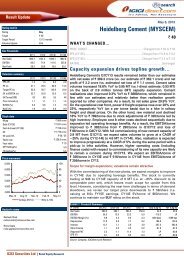
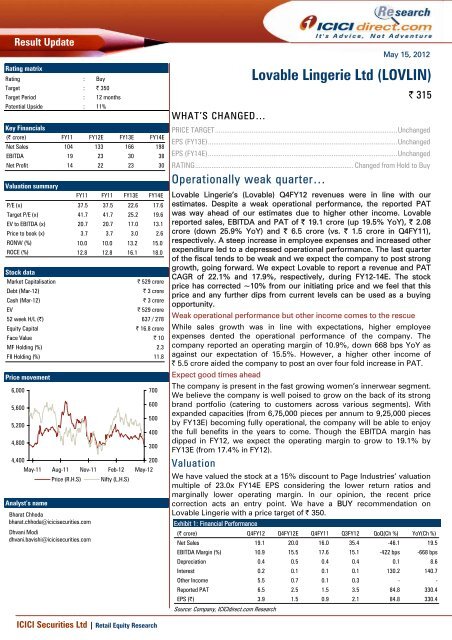
Result UpdateRating matrixRating : BuyTarget : | 350Target Period : 12 monthsPotential Upside : 11%Key Financials(| crore) FY11 FY12E FY13E FY14ENet Sales 104 133 166 198EBITDA 19 23 30 38Net Profit 14 22 23 30Valuation summaryFY11 FY11 FY13E FY14EP/E (x) 37.5 37.5 22.6 17.6Target P/E (x) 41.7 41.7 25.2 19.6EV to EBITDA (x) 20.7 20.7 17.0 13.1Price to book (x) 3.7 3.7 3.0 2.6RONW (%) 10.0 10.0 13.2 15.0ROCE (%) 12.8 12.8 16.1 18.0Stock dataMarket Capitalisation| 529 croreDebt (Mar-12)| 3 croreCash (Mar-12)| 3 croreEV| 529 crore52 week H/L (|) 637 / 278Equity Capital| 16.8 croreFace Value | 10MF Holding (%) 2.3FII Holding (%) 11.8Price movement6,0005,6005,2004,8004,400May-11Analyst’s nameAug-11Price (R.H.S)Nov-11Bharat Chhodabharat.chhoda@icicisecurities.comDhvani Modidhvani.bavishi@icicisecurities.comFeb-12Nifty (L.H.S)May-12700600500400300200WHAT’S CHANGED…May 15, 2012<strong>Lovable</strong> <strong>Lingerie</strong> <strong>Ltd</strong> (<strong>LOVLIN</strong>)| 315PRICE TARGET....................................................................................................UnchangedEPS (FY13E)........................................................................................................UnchangedEPS (FY14E)........................................................................................................UnchangedRATING....................................................................................... Changed from Hold to BuyOperationally weak quarter…<strong>Lovable</strong> <strong>Lingerie</strong>’s (<strong>Lovable</strong>) Q4FY12 revenues were in line with ourestimates. Despite a weak operational performance, the reported PATwas way ahead of our estimates due to higher other income. <strong>Lovable</strong>reported sales, EBITDA and PAT of | 19.1 crore (up 19.5% YoY), | 2.08crore (down 25.9% YoY) and | 6.5 crore (vs. | 1.5 crore in Q4FY11),respectively. A steep increase in employee expenses and increased otherexpenditure led to a depressed operational performance. The last quarterof the fiscal tends to be weak and we expect the company to post stronggrowth, going forward. We expect <strong>Lovable</strong> to report a revenue and PATCAGR of 22.1% and 17.9%, respectively, during FY12-14E. The stockprice has corrected ~10% from our initiating price and we feel that thisprice and any further dips from current levels can be used as a buyingopportunity.Weak operational performance but other income comes to the rescueWhile sales growth was in line with expectations, higher employeeexpenses dented the operational performance of the company. Thecompany reported an operating margin of 10.9%, down 668 bps YoY asagainst our expectation of 15.5%. However, a higher other income of| 5.5 crore aided the company to post an over four fold increase in PAT.Expect good times aheadThe company is present in the fast growing women’s innerwear segment.We believe the company is well poised to grow on the back of its strongbrand portfolio (catering to customers across various segments). Withexpanded capacities (from 6,75,000 pieces per annum to 9,25,000 piecesby FY13E) becoming fully operational, the company will be able to enjoythe full benefits in the years to come. Though the EBITDA margin hasdipped in FY12, we expect the operating margin to grow to 19.1% byFY13E (from 17.4% in FY12).ValuationWe have valued the stock at a 15% discount to Page Industries’ valuationmultiple of 23.0x FY14E EPS considering the lower return ratios andmarginally lower operating margin. In our opinion, the recent pricecorrection acts an entry point. We have a BUY recommendation on<strong>Lovable</strong> <strong>Lingerie</strong> with a price target of | 350.Exhibit 1: Financial Performance(| crore) Q4FY12 Q4FY12E Q4FY11 Q3FY12 QoQ(Ch %) YoY(Ch %)Net Sales 19.1 20.0 16.0 35.4 -46.1 19.5EBITDA Margin (%) 10.9 15.5 17.6 15.1 -422 bps -668 bpsDepreciation 0.4 0.5 0.4 0.4 0.1 8.6Interest 0.2 0.1 0.1 0.1 130.2 140.7Other Income 5.5 0.7 0.1 0.3 - -Reported PAT 6.5 2.5 1.5 3.5 84.8 330.4EPS (|) 3.9 1.5 0.9 2.1 84.8 330.4Source: Company, <strong>ICICI</strong>direct.com Research<strong>ICICI</strong> Securities <strong>Ltd</strong> | Retail Equity Research
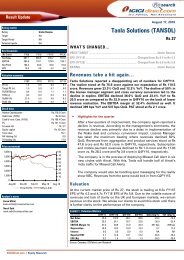
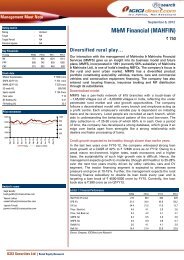
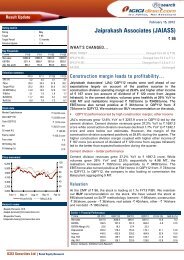
A steep increase in the employee costs and otherexpenses dented the operational performance of thecompanyExhibit 4: Cost analysis (as a percentage of sales)Q4FY11 Q1FY12 Q2FY12 Q3FY12 Q4FY12Raw Material Cost 46.1 41.8 42.0 42.6 34.1Employee Cost 13.4 8.2 10.9 10.7 18.6Other Expenses 22.9 31.2 28.6 31.5 36.4Source: Company, <strong>ICICI</strong>direct.com ResearchDespite a weak operational performance, the PAT stood at| 6.5 crore on the back of high other incomeExhibit 5: Net profit trend30252023.4| crore151051.57.04.63.56.5-Q4FY11Q1FY12Q2FY12Q3FY12Q4FY12FY13EFY14ESource: Company, <strong>ICICI</strong>direct.com ResearchValuationWe have valued the stock at a 15% discount to Page Industries’ valuationmultiple of 23.0x FY14E EPS considering the lower return ratios andmarginally lower operating margin. In our opinion, the recent pricecorrection acts an entry point. We have a BUY recommendation on<strong>Lovable</strong> <strong>Lingerie</strong> with a price target of | 350.<strong>ICICI</strong> Securities <strong>Ltd</strong> | Retail Equity Research Page 3
Financial summaryProfit and loss statement(| Crore)(Year-end March) FY11 FY12E FY13E FY14ETotal operating Income 104.0 133.0 165.7 198.4Growth (%) 19.6 27.8 24.6 19.7Raw Material Expenses 49.2 52.8 80.1 94.0Employee Expenses 11.6 15.5 16.8 19.5Manufacturing Expenses 3.3 4.3 5.4 7.5Selling Expenses 20.4 27.7 33.3 39.5Total Operating Expenditure 84.6 100.2 135.6 160.5EBITDA 19.5 32.8 30.1 37.9Growth (%) 20.6 18.5 30.4 25.8Depreciation 1.4 1.5 1.7 1.8EBIT 18.1 31.3 28.4 36.1Growth (%) 22.0 19.2 31.8 26.8Interest 0.5 0.6 0.5 0.5Other Income 0.9 6.7 2.8 3.9PBT 18.5 37.4 30.7 39.5Total Tax 4.4 6.1 7.3 9.4PAT 14.1 31.3 23.4 30.1Growth (%) 40.3 53.7 7.9 28.7EPS (|) 8.4 12.9 13.9 17.9Source: Company, <strong>ICICI</strong>direct.com ResearchCash flow statement(| Crore)(Year-end March) FY11 FY12E FY13E FY14EProfit before Tax 18.5 27.7 30.7 39.5Add: Depreciation 1.4 1.5 1.7 1.8(Inc)/dec in Current Assets (7.5) (22.2) (4.5) (14.4)Inc/(dec) in CL and Provisions (7.1) 7.2 0.2 4.3Taxes Paid (5.6) (6.1) (7.3) (9.4)Others (0.4) 0.6 0.5 0.5CF from operating activities (0.7) 8.7 21.2 22.3(Inc)/dec in Investments (91.1) (3.1) (0.1) (1.3)(Inc)/dec in Fixed Assets (1.5) (15.7) 2.0 2.6Others 0.9 - - -CF from investing activities (91.7) (18.7) 1.9 1.3Issue/(Buy back) of Equity 105.7 - - -Inc/(dec) in loan funds (0.3) - - -Dividend paid & dividend tax (0.9) (0.5) (8.9) (7.0)Others (0.5) (0.6) (0.5) (0.5)CF from financing activities 104.0 (1.1) (9.4) (7.5)Net Cash flow 11.6 (11.1) 13.7 16.1Opening Cash 2.7 14.3 3.3 17.0Closing Cash 14.3 3.3 17.0 33.1Source: Company, <strong>ICICI</strong>direct.com ResearchBalance sheet(| Crore)(Year-end March) FY11 FY12E FY13E FY14ELiabilitiesEquity Capital 16.8 16.8 16.8 16.8Reserve and Surplus 124.4 142.2 160.1 183.1Total Shareholders funds 141.2 159.0 176.9 199.9Total Debt - 3.4 - -Deferred Tax Liability 1.3 1.0 1.2 1.5Minority Interest / Others - - - -Total Liabilities 142.6 163.5 178.1 201.4AssetsGross Block 19.1 20.1 21.2 22.4Less: Acc Depreciation 6.1 7.7 9.4 11.2Net Block 12.9 12.4 11.9 11.3Capital WIP - 14.9 11.9 8.3Total Fixed Assets 12.9 27.2 23.7 19.6Investments 93.1 96.1 96.2 97.5Inventory 22.4 33.6 31.8 37.5Debtors 10.6 15.5 20.9 24.5Loans and Advances 3.7 9.8 10.8 15.9Other Current Assets - - - -Cash 14.3 3.3 17.0 33.1Total Current Assets 51.0 62.2 80.4 110.9Current Liabilities 11.9 15.6 16.8 19.6Provisions 2.9 6.5 5.5 7.0Total Current Liabilities 14.8 22.0 22.3 26.6Net Current Assets 36.2 40.1 58.1 84.3Others Assets 0.4 - - -Application of Funds 142.6 163.5 178.1 201.4Source: Company, <strong>ICICI</strong>direct.com ResearchKey ratios(Year-end March) FY11 FY12E FY13E FY14EPer share data (|)EPS 8.4 12.9 13.9 17.9Cash EPS 9.2 13.8 14.9 19.0BV 84.1 94.6 105.3 119.0DPS 1.5 2.0 2.8 3.6Cash Per Share 8.5 1.9 10.1 19.7Operating RatiosEBITDA Margin (%) 18.7 17.4 18.2 19.1PBT Margin (%) 17.8 20.8 18.5 19.9PAT Margin (%) 13.5 16.3 14.1 15.2Inventory days 62.1 76.8 70.0 69.0Debtor days 42.5 35.7 46.0 45.0Creditor days 36.0 35.1 37.0 36.0Return Ratios (%)RoE 10.0 13.6 13.2 15.0RoCE 12.8 13.3 16.1 18.0RoIC 41.6 34.4 36.7 43.4Valuation Ratios (x)P/E 37.5 24.4 22.6 17.6EV / EBITDA 20.7 22.9 17.0 13.1EV / Net Sales 3.9 4.0 3.1 2.5Market Cap / Sales 4.0 4.0 3.2 2.7Price to Book Value 3.7 3.3 3.0 2.6Solvency RatiosDebt/EBITDA - 0.1 - -Debt / Equity - 0.0 - -Current Ratio 3.4 2.8 3.6 4.2Quick Ratio 1.9 1.3 2.2 2.8Source: Company, <strong>ICICI</strong>direct.com Research<strong>ICICI</strong> Securities <strong>Ltd</strong> | Retail Equity Research Page 4
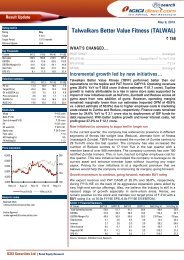
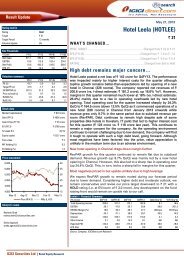
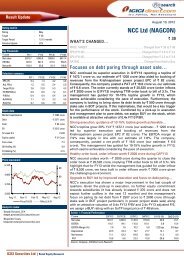
<strong>ICICI</strong>direct.com coverage universe (Textiles)Alok IndustriesSales (| Crore) EPS (|) PE (x) EV/EBITDA (x) RoNW(%) RoCE (%)Idirect Code ALOTEX CMP (|) 18 FY11 6,375.7 5.1 3.6 5.9 13.1 9.7Target (|) 25 FY12E 8,760.2 3.4 5.4 5.3 8.0 10.9MCap 1471 Upside (%) 38 FY13E 11,012.8 7.2 2.5 4.6 14.6 12.3Bombay Rayon FashionsIdirect Code BOMRAY CMP (|) 243 FY11 2,254.8 16.0 15.3 11.3 8.5 7.0Target (|) 244 FY12E 2,666.4 15.9 15.3 10.3 7.5 7.3MCap 3275 Upside (%) 0 FY13E 3,386.3 25.7 9.5 8.7 10.3 8.7JBF IndustriesIdirect Code JBFIND CMP (|) 111 FY11 6,465.6 76.2 1.5 2.5 47.5 30.7Target (|) 120 FY12E 7,040.1 37.6 2.9 4.8 17.4 16.8MCap 798 Upside (%) 8 FY13E 8,183.1 44.4 2.5 5.4 17.7 13.2Kewal Kiran ClothingIdirect Code KEWKIR CMP (|) 592 FY12E 301.9 42.3 14.0 8.9 22.5 27.3Target (|) 611 FY13E 364.9 51.9 11.4 6.9 23.6 29.2MCap 730 Upside (%) 3 FY14E 436.6 61.1 9.7 5.7 23.4 29.3<strong>Lovable</strong> <strong>Lingerie</strong>Idirect Code <strong>LOVLIN</strong> CMP (|) 315 FY12E 145.7 10.5 30.0 23.5 11.4 14.4Target (|) 350 FY13E 175.4 13.9 22.6 18.3 13.5 16.5MCap 315 Upside (%) 11 FY14E 209.9 17.9 17.6 14.2 15.4 18.4Page IndustriesIdirect Code PAGIND CMP (|) 3050 FY12E 686.0 78.2 39.0 23.8 52.8 39.0Target (|) 3106 FY13E 892.0 106.2 28.7 17.9 55.3 43.5MCap 3401 Upside (%) 2 FY14E 1,099.6 135.1 22.6 14.2 56.2 47.0Rupa & CompanyIdirect Code RUPACO CMP (|) 140 FY12E 728.1 5.0 27.7 15.4 20.5 20.2Target (|) Unrated FY13E 835.0 6.2 22.6 13.2 21.3 21.5MCap 1113 Upside (%) - FY14E 948.6 7.8 18.0 10.9 22.6 23.8Vardhman TextilesIdirect Code MAHSPI CMP (|) 218 FY12E 4,640.7 22.6 9.7 6.4 7.2 7.7Target (|) 229 FY13E 5,318.6 29.3 7.5 4.4 8.8 8.9MCap 1388 Upside (%) 5 FY14E 6,242.2 38.2 5.7 4.1 10.7 9.8Exhibit 6: Recommendation History625550475400325250Aug-11Oct-11Nov-11Jan-12Feb-12Mar-12May-12PriceTarget PriceSource: Company, <strong>ICICI</strong>direct.com Research<strong>ICICI</strong> Securities <strong>Ltd</strong> | Retail Equity Research Page 5
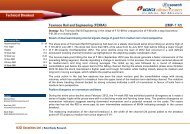
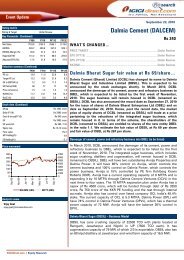
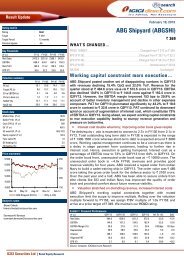
Exhibit 7: Recent ReleasesDate Event CMP Target Price Rating29-Mar-12 Initiating Coverage 351 350 HOLD4-Apr-12 Q4FY12 Preview 372 350 HOLDSource: Company, <strong>ICICI</strong>direct.com ResearchExhibit 8: The road ahead2002415016613.919817.918| crore1001048.413810.512|506-1914 18 23 3024FY11 FY12E FY13E FY14ENet Sales EBITDA Net Profit EPS (RHS)30380Source: Company, <strong>ICICI</strong>direct.com ResearchExhibit 9: Shareholding patternJun-11 Sep-11 Dec-11 Mar-12Promoters 67.0 67.0 67.0 67.0FIIs 10.8 11.3 10.3 11.8DIIs 5.5 3.0 3.9 2.3Public 16.7 18.8 18.8 19.0Source: Company, <strong>ICICI</strong>direct.com Research<strong>ICICI</strong> Securities <strong>Ltd</strong> | Retail Equity Research Page 6
RATING RATIONALE<strong>ICICI</strong>direct.com endeavours to provide objective opinions and recommendations. <strong>ICICI</strong>direct.com assignsratings to its stocks according to their notional target price vs. current market price and then categorises themas Strong Buy, Buy, Hold and Sell. The performance horizon is two years unless specified and the notionaltarget price is defined as the analysts' valuation for a stock.Strong Buy: >15%/20% for large caps/midcaps, respectively, with high conviction;Buy: > 10%/ 15% for large caps/midcaps, respectively;Hold: Up to +/-10%;Sell: -10% or more;Pankaj Pandey Head – Research pankaj.pandey@icicisecurities.com<strong>ICICI</strong>direct.com Research Desk,<strong>ICICI</strong> Securities Limited,1 st Floor, Akruti Trade Centre,Road No. 7, MIDC,Andheri (East)Mumbai – 400 093research@icicidirect.comANALYST CERTIFICATIONWe /I, Bharat Chhoda MBA (FINANCE) Dhvani Modi MBA (FINANCE) research analysts, authors and the names subscribed to this report, hereby certify that all of the views expressed in this researchreport accurately reflect our personal views about any and all of the subject issuer(s) or securities. We also certify that no part of our compensation was, is, or will be directly or indirectly related to thespecific recommendation(s) or view(s) in this report. Analysts aren't registered as research analysts by FINRA and might not be an associated person of the <strong>ICICI</strong> Securities Inc.Disclosures:<strong>ICICI</strong> Securities Limited (<strong>ICICI</strong> Securities) and its affiliates are a full-service, integrated investment banking, investment management and brokerage and financing group. We along with affiliates are leadingunderwriter of securities and participate in virtually all securities trading markets in India. We and our affiliates have investment banking and other business relationship with a significant percentage ofcompanies covered by our Investment Research Department. Our research professionals provide important input into our investment banking and other business selection processes. <strong>ICICI</strong> Securitiesgenerally prohibits its analysts, persons reporting to analysts and their dependent family members from maintaining a financial interest in the securities or derivatives of any companies that the analystscover.The information and opinions in this report have been prepared by <strong>ICICI</strong> Securities and are subject to change without any notice. The report and information contained herein is strictly confidential andmeant solely for the selected recipient and may not be altered in any way, transmitted to, copied or distributed, in part or in whole, to any other person or to the media or reproduced in any form, withoutprior written consent of <strong>ICICI</strong> Securities. While we would endeavour to update the information herein on reasonable basis, <strong>ICICI</strong> Securities, its subsidiaries and associated companies, their directors andemployees (“<strong>ICICI</strong> Securities and affiliates”) are under no obligation to update or keep the information current. Also, there may be regulatory, compliance or other reasons that may prevent <strong>ICICI</strong> Securitiesfrom doing so. Non-rated securities indicate that rating on a particular security has been suspended temporarily and such suspension is in compliance with applicable regulations and/or <strong>ICICI</strong> Securitiespolicies, in circumstances where <strong>ICICI</strong> Securities is acting in an advisory capacity to this company, or in certain other circumstances.This report is based on information obtained from public sources and sources believed to be reliable, but no independent verification has been made nor is its accuracy or completeness guaranteed. Thisreport and information herein is solely for informational purpose and may not be used or considered as an offer document or solicitation of offer to buy or sell or subscribe for securities or other financialinstruments. Though disseminated to all the customers simultaneously, not all customers may receive this report at the same time. <strong>ICICI</strong> Securities will not treat recipients as customers by virtue of theirreceiving this report. Nothing in this report constitutes investment, legal, accounting and tax advice or a representation that any investment or strategy is suitable or appropriate to your specificcircumstances. The securities discussed and opinions expressed in this report may not be suitable for all investors, who must make their own investment decisions, based on their own investmentobjectives, financial positions and needs of specific recipient. This may not be taken in substitution for the exercise of independent judgment by any recipient. The recipient should independently evaluatethe investment risks. The value and return of investment may vary because of changes in interest rates, foreign exchange rates or any other reason. <strong>ICICI</strong> Securities and affiliates accept no liabilities for anyloss or damage of any kind arising out of the use of this report. Past performance is not necessarily a guide to future performance. Investors are advised to see Risk Disclosure Document to understand therisks associated before investing in the securities markets. Actual results may differ materially from those set forth in projections. Forward-looking statements are not predictions and may be subject tochange without notice.<strong>ICICI</strong> Securities and its affiliates might have managed or co-managed a public offering for the subject company in the preceding twelve months. <strong>ICICI</strong> Securities and affiliates might have receivedcompensation from the companies mentioned in the report during the period preceding twelve months from the date of this report for services in respect of public offerings, corporate finance, investmentbanking or other advisory services in a merger or specific transaction. It is confirmed that Bharat Chhoda MBA (FINANCE) Dhvani Modi MBA (FINANCE) research analysts and the authors of this reporthave not received any compensation from the companies mentioned in the report in the preceding twelve months. Our research professionals are paid in part based on the profitability of <strong>ICICI</strong> Securities,which include earnings from Investment Banking and other business.<strong>ICICI</strong> Securities or its subsidiaries collectively do not own 1% or more of the equity securities of the Company mentioned in the report as of the last day of the month preceding the publication of theresearch report.It is confirmed that Bharat Chhoda MBA (FINANCE) Dhvani Modi MBA (FINANCE)advisory board member of the companies mentioned in the report.research analysts and the authors of this report or any of their family members does not serve as an officer, director or<strong>ICICI</strong> Securities may have issued other reports that are inconsistent with and reach different conclusion from the information presented in this report. <strong>ICICI</strong> Securities and affiliates may act upon or make useof information contained in the report prior to the publication thereof.This report is not directed or intended for distribution to, or use by, any person or entity who is a citizen or resident of or located in any locality, state, country or other jurisdiction, where such distribution,publication, availability or use would be contrary to law, regulation or which would subject <strong>ICICI</strong> Securities and affiliates to any registration or licensing requirement within such jurisdiction. The securitiesdescribed herein may or may not be eligible for sale in all jurisdictions or to certain category of investors. Persons in whose possession this document may come are required to inform themselves of andto observe such restriction.<strong>ICICI</strong> Securities <strong>Ltd</strong> | Retail Equity Research Page 7