Bosch Ltd (MICO) - ICICI Direct
Bosch Ltd (MICO) - ICICI Direct
Bosch Ltd (MICO) - ICICI Direct

You also want an ePaper? Increase the reach of your titles
YUMPU automatically turns print PDFs into web optimized ePapers that Google loves.
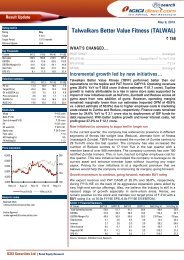
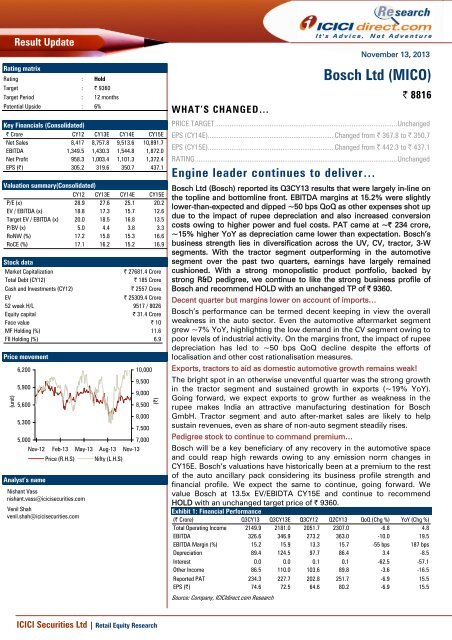
Result UpdateRating matrixRating : HoldTarget : | 9360Target Period : 12 monthsPotential Upside : 6%Key Financials (Consolidated)| Crore CY12 CY13E CY14E CY15ENet Sales 8,417 8,757.8 9,513.6 10,891.7EBITDA 1,349.5 1,430.3 1,544.8 1,872.0Net Profit 958.3 1,003.4 1,101.3 1,372.4EPS (|) 305.2 319.6 350.7 437.1Valuation summary(Consolidated)CY12 CY13E CY14E CY15EP/E (x) 28.9 27.6 25.1 20.2EV / EBITDA (x) 18.8 17.3 15.7 12.6Target EV / EBITDA (x) 20.0 18.5 16.8 13.5P/BV (x) 5.0 4.4 3.8 3.3RoNW (%) 17.2 15.8 15.3 16.6RoCE (%) 17.1 16.2 15.2 16.9Stock dataMarket Capitalization| 27681.4 CroreTotal Debt (CY12)| 185 CroreCash and Investments (CY12)| 2557 CroreEV| 25309.4 Crore52 week H/L 9517 / 8026Equity capital| 31.4 CroreFace value | 10MF Holding (%) 11.6FII Holding (%) 6.9Price movement(unit)6,2005,9005,6005,3005,000Nov-12Analyst’s nameFeb-13Price (R.H.S)May-13Nishant Vassnishant.vass@icicisecurities.comVenil Shahvenil.shah@icicisecurities.comAug-13Nifty (L.H.S)Nov-1310,0009,5009,0008,5008,0007,5007,000(|)WHAT’S CHANGED…November 13, 2013PRICE TARGET....................................................................................................UnchangedEPS (CY14E)..................................................................... Changed from | 367.8 to | 350.7EPS (CY15E)..................................................................... Changed from | 442.3 to | 437.1RATING...............................................................................................................UnchangedEngine leader continues to deliver…<strong>Bosch</strong> <strong>Ltd</strong> (<strong>Bosch</strong>) reported its Q3CY13 results that were largely in-line onthe topline and bottomline front. EBITDA margins at 15.2% were slightlylower-than-expected and dipped ~50 bps QoQ as other expenses shot updue to the impact of rupee depreciation and also increased conversioncosts owing to higher power and fuel costs. PAT came at ~| 234 crore,~15% higher YoY as depreciation came lower than expectation. <strong>Bosch</strong>’sbusiness strength lies in diversification across the UV, CV, tractor, 3-Wsegments. With the tractor segment outperforming in the automotivesegment over the past two quarters, earnings have largely remainedcushioned. With a strong monopolistic product portfolio, backed bystrong R&D pedigree, we continue to like the strong business profile of<strong>Bosch</strong> and recommend HOLD with an unchanged TP of | 9360.Decent quarter but margins lower on account of imports…<strong>Bosch</strong>’s performance can be termed decent keeping in view the overallweakness in the auto sector. Even the automotive aftermarket segmentgrew ~7% YoY, highlighting the low demand in the CV segment owing topoor levels of industrial activity. On the margins front, the impact of rupeedepreciation has led to ~50 bps QoQ decline despite the efforts oflocalisation and other cost rationalisation measures.Exports, tractors to aid as domestic automotive growth remains weak!The bright spot in an otherwise uneventful quarter was the strong growthin the tractor segment and sustained growth in exports (~19% YoY).Going forward, we expect exports to grow further as weakness in therupee makes India an attractive manufacturing destination for <strong>Bosch</strong>GmbH. Tractor segment and auto after-market sales are likely to helpsustain revenues, even as share of non-auto segment steadily rises.Pedigree stock to continue to command premium…<strong>Bosch</strong> will be a key beneficiary of any recovery in the automotive spaceand could reap high rewards owing to any emission norm changes inCY15E. <strong>Bosch</strong>’s valuations have historically been at a premium to the restof the auto ancillary pack considering its business profile strength andfinancial profile. We expect the same to continue, going forward. Wevalue <strong>Bosch</strong> at 13.5x EV/EBIDTA CY15E and continue to recommendHOLD with an unchanged target price of | 9360.Exhibit 1: Financial Performance(| Crore) Q3CY13 Q3CY13E Q3CY12 Q2CY13 QoQ (Chg %) YoY (Chg %)Total Operating Income 2149.9 2181.0 2051.7 2307.0 -6.8 4.8EBITDA 326.6 346.9 273.2 363.0 -10.0 19.5EBITDA Margin (%) 15.2 15.9 13.3 15.7 -55 bps 187 bpsDepreciation 89.4 124.5 97.7 86.4 3.4 -8.5Interest 0.0 0.0 0.1 0.1 -62.5 -57.1Other Income 86.5 110.0 103.6 89.8 -3.6 -16.5Reported PAT 234.3 227.7 202.8 251.7 -6.9 15.5EPS (|) 74.6 72.5 64.6 80.2 -6.9 15.5Source: Company, <strong>ICICI</strong>direct.com Research<strong>Bosch</strong> <strong>Ltd</strong> (<strong>MICO</strong>)| 8816<strong>ICICI</strong> Securities <strong>Ltd</strong> | Retail Equity Research
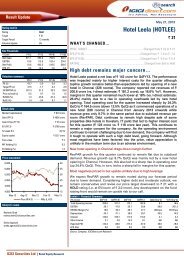
Exhibit 2: AssumptionCY11 CY12 CY13E CY14E CY15ERevenue (| crore)Automotive 7,241.4 7,728.5 7,841.4 8,469.6 9,677.5Non-automotive 847.4 977.1 1,098.5 1,241.7 1,443.1EBIT margins (%)Automotive 17.3 13.3 14.8 14.9 16.6Non-automotive 6.8 9.1 5.3 4.9 6.0Source: Company, <strong>ICICI</strong>direct.com ResearchExhibit 3: Net sales and PAT margin trend(| crore)1200011000100009000800022.28,1668,6598,9319,7068.711,11614.525201510(%)700060006.03.155000CY11 CY12 CY13E CY14E CY15ETotal operating income % increase-Source: Company, <strong>ICICI</strong>direct.com ResearchWith <strong>Bosch</strong> entering a high capex cycle, return ratios arelikely to remain healthy but below its routine range of~20% in the next two yearsExhibit 4: Return ratios profile262323.725.2(%)20171417.216.615.815.317.116.916.215.2CY11 CY12 CY13E CY14E CY15ERoERoCESource: Company, <strong>ICICI</strong>direct.com Research * (net of Interest & Inter segment eliminations)<strong>ICICI</strong> Securities <strong>Ltd</strong> | Retail Equity Research Page 2
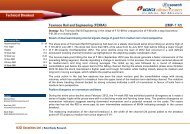
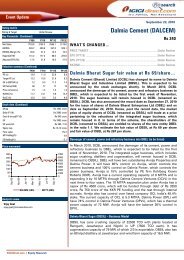
<strong>Bosch</strong> is the largest importer in the auto ancillary. Hence,it is impacted more by the volatility in the currencymarkets than other ancillary players. Over the years, netimports have crept up due to an increase in the tradedgoods component. For <strong>Bosch</strong>, a majority of the exposureis in the form of raw materials and traded goods while asmall portion is also from royalty and other technicalexpensesExhibit 5: Import content trending down(| crore)2,2001,8001,4001,00060020015.871817.583325.922.321.7 20.01,440CY08 CY09 CY10 CY11 CY12 CY13*2,0551,8771,75230262218(%)1410Net Forex Exposure% of SalesSource: Company, <strong>ICICI</strong>direct.com Research * CY13 is estimatedKey management takeawaysThe management indicated that growth in Q3 was mainly driven by thetractor segment, which grew ~26% YoY at an industry level. The PV & UVsegments witnessed ~6% YoY growth on a low base with new productlaunches of Ecosport & Amaze. The HCV space continued to decline~33% YoY.Exports witnessed growth of ~19% YoY in Q3 and for nine monthsexports stood at | 777 crore in revenues. The domestic businesswitnessed growth of ~1.6% in Q3.On the exports front, the company said it was receiving a strong responseto its jointly developed baseline generators and expects to ramp upproduction for other markets considering the increase in competitivenessof the India business with INR depreciation.The company continued to highlight its target of ~| 600 crore capitalexpenditure in CY14E and ~| 500 crore in CY13E.On the forex exposure side, the management highlighted that net importexposure has come down to ~20% of net sales from ~22% in CY12.On content per vehicle, the management expects double digit kind ofgrowth in the coming three to five years but did not believe they coulddouble in the same period.The management believes the strong costs control, localisation, vendor &freight rationalisation along with management of manpower costs willhelp them remain at an optimal level of performance.<strong>ICICI</strong> Securities <strong>Ltd</strong> | Retail Equity Research Page 3
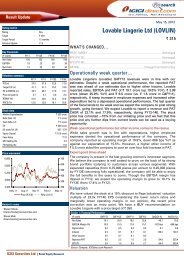
Outlook & ValuationWe believe the CV and tractor segments will be strong growth drivers for<strong>Bosch</strong>’s earnings in CY14E and CY15E. We also expect the dieselisationtrend in the PV space to continue. As PV volumes pick up, the segment islikely to add to <strong>Bosch</strong>’s revenues. An increase in the non-automotivebusiness also lends earnings stability across cycles. With a strong balancesheet supported by robust FCFs, strong return ratios and stable highmargin profile, the financials are impressive.<strong>Bosch</strong> will be a key beneficiary of any recovery in the automotive spaceand could reap high rewards owing to any emission norm changes inCY15E. <strong>Bosch</strong>’s valuations have historically been at a premium to the restof the auto ancillary pack considering its business profile strength andfinancial profile. We expect the same to continue, going forward. Wevalue <strong>Bosch</strong> at 13.5x EV/EBIDTA CY15E and continue to recommendHOLD with an unchanged target price of | 9360.<strong>Bosch</strong> is trading near the higher end of its one-yearEV/EBIDTA valuation band. However, we believe in theseuncertain times, the earnings pedigree and business profilestrength of <strong>Bosch</strong> will ensure the valuations remain atthese elevated levelsExhibit 6: One-year rolling EV/EBIDTA band300002500020000(|)150001000050000Jan-06May-06Sep-06Jan-07May-07Sep-07Jan-08May-08Sep-08Jan-09May-09Sep-09Jan-10May-10Sep-10Jan-11May-11Sep-11Jan-12May-12Sep-12Jan-13May-13Sep-13EV 18.5x 17.1x 15.6x 13.5x 12.8x 11.3xSource: Company, <strong>ICICI</strong>direct.com ResearchExhibit 7: Revised financials (Consolidated)ParticularsCY14ECY15EOld New % Change Old New % ChangeRevenue 9,897.8 9706.3 (1.9) 11,203.5 11115.5 (0.8)EBITDA 1,697.8 1544.8 (9.0) 2,005.5 1872.0 (6.7)EBITDA Margin 17.2 15.9 -124 bps 17.9 16.8 -106 bpsPAT 1154.9 1101.3 (4.6) 1388.8 1372.4 (1.2)EPS 367.8 350.7 (4.6) 442.3 437.1 (1.2)Source: Company, <strong>ICICI</strong>direct.com ResearchExhibit 8: ValuationSales Growth EPS Growth PE EV/EBITDA RoNW RoCE(| cr) (%) (|) (%) (x) (x) (%) (%)CY12 8417.2 305.2 28.9 18.8 17.2 17.1CY13E 8757.8 4.0 319.6 4.7 27.6 17.3 15.8 16.2CY14E 9513.6 8.6 350.7 9.8 25.1 15.7 15.3 15.2CY15E 10891.7 14.5 437.1 24.6 20.2 12.6 16.6 16.9Source: Company, <strong>ICICI</strong>direct.com Research<strong>ICICI</strong> Securities <strong>Ltd</strong> | Retail Equity Research Page 4
Financial summaryProfit and loss statement(| Crore)(Year-end March) CY12 CY13E CY14E CY15ETotal operating Income 8,659.1 8,931.0 9,706.3 11,115.5Growth (%) 6.0 3.1 8.7 14.5Raw Material Expenses 4,753.4 4,867.1 5,271.9 5,954.0Employee Expenses 1,037.1 1,161.4 1,285.2 1,463.6Other Expenses 1,388.8 1,490.1 1,624.5 1,847.8Total Operating Expenditure 7,309.6 7,500.7 8,161.5 9,243.5EBITDA 1,349.5 1,430.3 1,544.8 1,872.0Growth (%) -10.7 6.0 8.0 21.2Depreciation 367.0 370.7 423.9 458.4Interest 5.5 0.5 0.4 0.2Other Income 369.2 385.6 478.0 580.0PBT 1,346.2 1,444.6 1,598.6 1,993.4Exceptional items 0.0 0.0 110.0 0.0Total Tax 387.9 441.2 497.2 621.0PAT 958.3 1,003.4 1,101.3 1,372.4Growth (%) -14.6 4.7 9.8 24.6EPS (|) 305.2 319.6 350.7 437.1Source: Company, <strong>ICICI</strong>direct.com ResearchCash flow statement(| Crore)(Year-end March) CY12 CY13E CY14E CY15EProfit after Tax 958.3 1,003.4 1,101.3 1,372.4Add: Depreciation 367.0 370.7 423.9 458.4(Inc)/dec in Current Assets -63.7 -267.5 -241.6 -605.4Inc/(dec) in CL and Provisions -54.6 100.9 212.4 358.4CF from operating activities 1,207.0 1,207.5 1,496.0 1,583.8(Inc)/dec in Investments 114.9 -310.0 -260.0 -500.0(Inc)/dec in Fixed Assets -735.0 -500.0 -700.0 -600.0Others 122.6 15.9 14.7 13.1CF from investing activities -497.5 -794.1 -945.3 -1,086.9Issue/(Buy back) of Equity 0.0 0.0 0.0 0.0Inc/(dec) in loan funds -60.4 0.0 -10.0 -70.0Dividend paid & dividend tax -219.0 -219.0 -255.5 -292.0Others 100.1 -0.5 -0.4 -0.2CF from financing activities -179.3 -219.5 -265.8 -362.2Net Cash flow 535.7 194.4 285.3 134.9Opening Cash 951.5 1,487.2 1,681.6 1,966.8Closing Cash 1,487.2 1,681.6 1,966.8 2,101.7Source: Company, <strong>ICICI</strong>direct.com ResearchBalance Sheet(| Crore)(Year-end March) CY12 CY13E CY14E CY15ELiabilitiesEquity Capital 31.4 31.4 31.4 31.4Reserve and Surplus 5,541.9 6,326.3 7,172.1 8,252.6Total Shareholders funds 5,573.3 6,357.7 7,203.5 8,284.0Total Debt 185.0 185.0 175.0 105.0Other non-current Liabilities 251.8 291.8 341.8 391.8Total Liabilities 6,010.1 6,834.5 7,720.3 8,780.8AssetsGross Block 3,947.9 4,447.9 5,147.9 5,747.9Less: Acc Depreciation 3,084.6 3,455.3 3,879.2 4,337.6Net Block 863.3 992.6 1,268.7 1,410.3Capital WIP 417.1 417.1 417.1 417.1Total Fixed Assets 1,280.4 1,409.7 1,685.8 1,827.4Investments 1,519.8 1,829.8 2,089.8 2,589.8Inventory 1,095.7 1,151.7 1,225.0 1,417.4Debtors 1,021.0 1,103.7 1,172.9 1,372.7Loans and Advances 878.7 914.3 993.2 1,169.7Other current assets 140.3 233.6 253.7 290.5Cash 1,487.2 1,681.6 1,966.8 2,101.7Total Current Assets 4,622.9 5,084.8 5,611.6 6,351.9Creditors 930.4 983.7 1,094.7 1,278.4Provisions 506.5 535.5 596.0 695.9Other Current Liabilities 456.9 475.4 516.4 591.2Total Current Liabilities 1,893.8 1,994.7 2,207.1 2,565.5Net Current Assets 2,729.1 3,090.1 3,404.6 3,786.4Deferred Tax Asset 255.2 270.2 285.2 285.2Other non-current Assets 225.6 234.7 255.0 291.9Application of Funds 6,010.1 6,834.5 7,720.3 8,780.8Source: Company, <strong>ICICI</strong>direct.com ResearchKey ratios(Year-end March) CY12 CY13E CY14E CY15EPer share data (|)EPS 305.2 319.6 350.7 437.1Cash EPS 422.1 437.6 485.7 583.1BV 1,775.0 2,024.8 2,294.2 2,638.3DPS 60.0 60.0 70.0 80.0Cash Per Share 473.6 535.5 626.4 669.4Operating Ratios (%)EBITDA Margin 15.6 16.0 15.9 16.8PBT / Net sales 16.0 16.5 16.8 18.3PAT Margin 11.1 11.2 11.3 12.3Inventory days 47.5 48.0 47.0 47.5Debtor days 40.3 41.0 42.0 42.8Creditor days 44.3 46.0 45.0 46.0Return Ratios (%)RoE 17.2 15.8 15.3 16.6RoCE 17.1 16.2 15.2 16.9RoIC 24.3 22.8 21.5 23.2Valuation Ratios (x)P/E 28.9 27.6 25.1 20.2EV / EBITDA 18.8 17.3 15.7 12.6EV / Net Sales 3.0 2.8 2.6 2.2Market Cap / Sales 3.3 3.2 2.9 2.5Price to Book Value 5.0 4.4 3.8 3.3Solvency RatiosDebt/Equity 0.0 0.0 0.0 0.0Current Ratio 2.4 2.5 2.5 2.5Quick Ratio 1.9 2.0 2.0 1.9Source: Company, <strong>ICICI</strong>direct.com Research<strong>ICICI</strong> Securities <strong>Ltd</strong> | Retail Equity Research Page 5
Company Description<strong>Bosch</strong> is a leading supplier of technology and services in the areas ofautomotive and industrial technology, consumer goods and buildingtechnology. In India, <strong>Bosch</strong> <strong>Ltd</strong> is the flagship company of the <strong>Bosch</strong>Group and is a leading global supplier of technology & services andcomprises Robert <strong>Bosch</strong> GmbH and ~360 subsidiaries and regionalcompanies in ~50 countries with ~77,000 patents and utility models to itsname. <strong>Bosch</strong> <strong>Ltd</strong> also has among the largest distribution networks ofspare parts in the country with after-market sales contributing ~25% of itsturnover. It has plants spread across Nashik, Pune, Ahmedabad, Jaipur,Goa, Bangalore, Coimbatore and Chennai, which are close to its majorclients. <strong>Bosch</strong> also has a strong dealer network, which spans ~1000towns across the country, which facilitates product availability and aftersalesservices.Exhibit 9: Recommendation History10,0009,6009,2008,8008,4008,000Jan-13Feb-13Apr-13May-13Jul-13Aug-13Sep-13Nov-13PriceTarget PriceSource: Company, <strong>ICICI</strong>direct.com ResearchExhibit 10: Recent ReleasesDate Event CMP Target Price Rating15-Oct-13 Initiating Coverage 8586 9360 HOLDSource: Company, <strong>ICICI</strong>direct.com Research<strong>ICICI</strong> Securities <strong>Ltd</strong> | Retail Equity Research Page 6
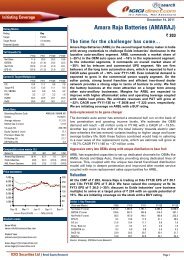
<strong>ICICI</strong>direct.com Research coverage universe (Auto & auto ancillaries)CMPM Cap EPS (|) P/E (x) EV/EBITDA (x) RoCE (%)RoE (%)Sector / Company (|) TP(|) Rating (| Cr) FY13E FY14E FY15E FY13E FY14E FY15E FY13E FY14E FY15E FY13E FY14E FY15E FY13E FY14E FY15EAmara Raja (AMARAJ) 313 300 Hold 5,353 16.8 20.6 23.1 18.7 15.2 13.6 9.7 8.3 6.9 33.6 34.0 32.3 27.1 26.3 24.0Apollo Tyre (APOTYR) 70 76 Hold 3,539 12.2 16.5 15.8 5.8 4.2 4.4 3.8 3.2 2.9 18.7 19.1 17.8 18.0 19.9 16.1Ashok Leyland (ASHLEY) 16 16 Hold 4,138 1.6 0.1 1.4 9.5 161.0 11.3 9.4 19.6 6.9 6.2 0.4 9.5 9.7 0.6 8.1Automotive Axle (AUTAXL)* 245 196 Hold 370 29.8 13.0 28.0 6.7 15.4 7.2 3.5 5.4 3.3 22.6 10.2 18.4 16.6 7.1 14.0Bajaj Auto (BAAUTO) 2,021 2,450 Buy 58,490 103.8 124.2 153.1 19.5 16.3 13.2 15.8 16.0 12.0 58.2 43.5 43.0 49.7 36.7 36.3Balkrishna Ind. (BALIND) 285 244 Sell 2,754 37.6 43.0 34.9 7.4 6.4 7.9 6.6 5.7 6.1 16.2 16.0 11.7 25.5 16.2 16.0Bharat Forge (BHAFOR) 291 281 Hold 6,785 10.6 15.6 23.2 27.4 18.7 12.5 10.5 8.5 6.5 9.1 11.9 14.6 11.0 14.2 18.0Eicher Motors (EICMOT)` 4,200 5,400 Buy 11,344 148.7 227.7 305.5 28.2 18.4 13.7 19.0 9.4 6.4 19.4 23.8 26.3 19.2 23.4 24.5Escorts (ESCORT)* 115 85 Sell 1,368 14.1 15.5 17.1 6.8 6.2 5.6 3.5 3.1 2.5 9.9 11.2 10.8 9.4 9.6 9.7Exide Industries (EXIIND) 117 123 Hold 9,971 6.1 6.8 8.2 19.1 17.2 14.3 13.0 10.5 8.8 19.6 21.0 21.9 15.3 15.1 16.2Hero Mototcorp (HERHON) 2,002 2,100 Hold 39,972 106.1 111.4 144.8 18.9 18.0 13.8 11.5 12.6 11.0 42.8 45.8 53.3 42.3 38.9 42.9JK Tyre & Ind (JKIND) 127 131 Hold 519 44.9 66.2 87.2 2.8 1.9 1.5 4.5 2.9 3.0 14.5 20.3 19.3 22.4 24.3 24.5M&M (MAHMAH) 895 1,150 Buy 52,854 51.6 59.8 71.0 17.4 15.0 12.6 11.0 9.0 7.4 22.5 23.2 24.1 23.0 22.1 21.7Maruti Suzuki (MARUTI) 1,580 1,663 Hold 47,732 79.2 97.8 118.8 19.9 16.1 13.3 9.7 7.2 5.9 11.9 14.1 15.3 12.9 13.9 14.7Motherson (MOTSUM) 259 266 Hold 15,230 11.3 12.2 20.1 22.8 21.3 12.9 12.9 7.4 5.3 11.3 23.6 29.7 19.4 26.0 33.1Tata Motors (TELCO) 366 475 Buy 108,458 31.0 47.0 60.6 12.4 8.2 6.3 5.2 3.7 3.2 23.2 24.8 25.6 26.3 27.5 28.3<strong>Bosch</strong> (<strong>MICO</strong>) 8,816 9,360 Hold 27,682 319.6 350.7 437.1 27.6 25.1 20.2 17.3 15.7 12.6 15.8 15.3 16.6 16.2 15.2 16.9Source: Company, <strong>ICICI</strong>direct.com Research SY~ September Year endThe chart compares the movement of OEM stocks in the<strong>ICICI</strong>direct.com Universe with the BSE Auto index, therebyreflecting the degree of mimicking of the index<strong>ICICI</strong>direct.com Universe price movement vis-à-vis BSE Auto indexExhibit 11: OEM comparison with BSE AutoSince March 2012, Bajaj Auto and Maruti Suzuki haveoutperformed while Hero MotoCorp and Escorts haveunderperformed in comparison to the index by beingdivergent on the upside and downside, respectivelyBSE AutoAshok LeylandOct-12 Dec-12 Feb-13 Apr-13 Jun-13 Aug-13 Oct-13BSE Auto Bajaj MarutiTata Motors M & M EscortsHero MotoCorp Ashok Leyland Eicher MotorsSource: Company, <strong>ICICI</strong>direct.com ResearchExhibit 12: Ancillaries comparison with BSE AutoThe chart compares the movement of auto ancillarystocks in the <strong>ICICI</strong>direct.com universe with the BSE AutoindexBSE AutoThe volatile nature of smaller ancillary companies isreflected. These have met with numerous fluctuationswith the exception of Motherson Sumi and Amara Rajabatteries, which mimic the index greatly. Tyre companieslike JK Tyre and Apollo Tyres have performed well due tothe weakening of rubber pricesBharat ForgeOct-12 Dec-12 Feb-13 Apr-13 Jun-13 Aug-13 Oct-13BSE Auto Auto Axl Bharat Forge Balkrishna JK TyresApollo Tyres Subros Motherson Exide Inds Amara rajaSource: Company, <strong>ICICI</strong>direct.com Research<strong>ICICI</strong> Securities <strong>Ltd</strong> | Retail Equity Research Page 7
RATING RATIONALE<strong>ICICI</strong>direct.com endeavours to provide objective opinions and recommendations. <strong>ICICI</strong>direct.com assignsratings to its stocks according to their notional target price vs. current market price and then categorises themas Strong Buy, Buy, Hold and Sell. The performance horizon is two years unless specified and the notionaltarget price is defined as the analysts' valuation for a stock.Strong Buy: >15%/20% for large caps/midcaps, respectively, with high conviction;Buy: >10%/15% for large caps/midcaps, respectively;Hold: Up to +/-10%;Sell: -10% or more;Pankaj Pandey Head – Research pankaj.pandey@icicisecurities.com<strong>ICICI</strong>direct.com Research Desk,<strong>ICICI</strong> Securities Limited,1 st Floor, Akruti Trade Centre,Road No. 7, MIDC,Andheri (East)Mumbai – 400 093research@icicidirect.comANALYST CERTIFICATIONWe /I, Nishant Vass MBA(FINANCE) Venil Shah MBA research analysts, authors and the names subscribed to this report, hereby certify that all of the views expressed in this research report accuratelyreflect our personal views about any and all of the subject issuer(s) or securities. We also certify that no part of our compensation was, is, or will be directly or indirectly related to the specificrecommendation(s) or view(s) in this report. Analysts aren't registered as research analysts by FINRA and might not be an associated person of the <strong>ICICI</strong> Securities Inc.Disclosures:<strong>ICICI</strong> Securities Limited (<strong>ICICI</strong> Securities) and its affiliates are a full-service, integrated investment banking, investment management and brokerage and financing group. We along with affiliates are leadingunderwriter of securities and participate in virtually all securities trading markets in India. We and our affiliates have investment banking and other business relationship with a significant percentage ofcompanies covered by our Investment Research Department. Our research professionals provide important input into our investment banking and other business selection processes. <strong>ICICI</strong> Securitiesgenerally prohibits its analysts, persons reporting to analysts and their dependent family members from maintaining a financial interest in the securities or derivatives of any companies that the analystscover.The information and opinions in this report have been prepared by <strong>ICICI</strong> Securities and are subject to change without any notice. The report and information contained herein is strictly confidential andmeant solely for the selected recipient and may not be altered in any way, transmitted to, copied or distributed, in part or in whole, to any other person or to the media or reproduced in any form, withoutprior written consent of <strong>ICICI</strong> Securities. While we would endeavour to update the information herein on reasonable basis, <strong>ICICI</strong> Securities, its subsidiaries and associated companies, their directors andemployees (“<strong>ICICI</strong> Securities and affiliates”) are under no obligation to update or keep the information current. Also, there may be regulatory, compliance or other reasons that may prevent <strong>ICICI</strong> Securitiesfrom doing so. Non-rated securities indicate that rating on a particular security has been suspended temporarily and such suspension is in compliance with applicable regulations and/or <strong>ICICI</strong> Securitiespolicies, in circumstances where <strong>ICICI</strong> Securities is acting in an advisory capacity to this company, or in certain other circumstances.This report is based on information obtained from public sources and sources believed to be reliable, but no independent verification has been made nor is its accuracy or completeness guaranteed. Thisreport and information herein is solely for informational purpose and may not be used or considered as an offer document or solicitation of offer to buy or sell or subscribe for securities or other financialinstruments. Though disseminated to all the customers simultaneously, not all customers may receive this report at the same time. <strong>ICICI</strong> Securities will not treat recipients as customers by virtue of theirreceiving this report. Nothing in this report constitutes investment, legal, accounting and tax advice or a representation that any investment or strategy is suitable or appropriate to your specificcircumstances. The securities discussed and opinions expressed in this report may not be suitable for all investors, who must make their own investment decisions, based on their own investmentobjectives, financial positions and needs of specific recipient. This may not be taken in substitution for the exercise of independent judgment by any recipient. The recipient should independently evaluatethe investment risks. The value and return of investment may vary because of changes in interest rates, foreign exchange rates or any other reason. <strong>ICICI</strong> Securities and affiliates accept no liabilities for anyloss or damage of any kind arising out of the use of this report. Past performance is not necessarily a guide to future performance. Investors are advised to see Risk Disclosure Document to understand therisks associated before investing in the securities markets. Actual results may differ materially from those set forth in projections. Forward-looking statements are not predictions and may be subject tochange without notice.<strong>ICICI</strong> Securities and its affiliates might have managed or co-managed a public offering for the subject company in the preceding twelve months. <strong>ICICI</strong> Securities and affiliates might have receivedcompensation from the companies mentioned in the report during the period preceding twelve months from the date of this report for services in respect of public offerings, corporate finance, investmentbanking or other advisory services in a merger or specific transaction. It is confirmed that Nishant Vass MBA(FINANCE) Venil Shah MBA research analysts and the authors of this report have not receivedany compensation from the companies mentioned in the report in the preceding twelve months. Our research professionals are paid in part based on the profitability of <strong>ICICI</strong> Securities, which includeearnings from Investment Banking and other business.<strong>ICICI</strong> Securities or its subsidiaries collectively do not own 1% or more of the equity securities of the Company mentioned in the report as of the last day of the month preceding the publication of theresearch report.It is confirmed that Nishant Vass MBA(FINANCE) Venil Shah MBA research analysts and the authors of this report or any of their family members does not serve as an officer, director or advisory boardmember of the companies mentioned in the report.<strong>ICICI</strong> Securities may have issued other reports that are inconsistent with and reach different conclusion from the information presented in this report. <strong>ICICI</strong> Securities and affiliates may act upon or make useof information contained in the report prior to the publication thereof.This report is not directed or intended for distribution to, or use by, any person or entity who is a citizen or resident of or located in any locality, state, country or other jurisdiction, where such distribution,publication, availability or use would be contrary to law, regulation or which would subject <strong>ICICI</strong> Securities and affiliates to any registration or licensing requirement within such jurisdiction. The securitiesdescribed herein may or may not be eligible for sale in all jurisdictions or to certain category of investors. Persons in whose possession this document may come are required to inform themselves of andto observe such restriction.<strong>ICICI</strong> Securities <strong>Ltd</strong> | Retail Equity Research Page 8