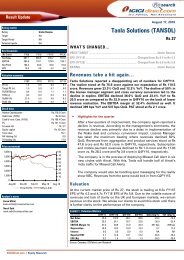
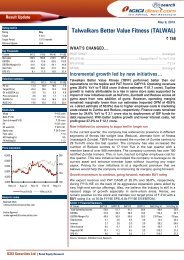
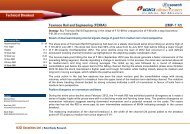
Outlook & ValuationWe believe the CV and tractor segments will be strong growth drivers for<strong>Bosch</strong>’s earnings in CY14E and CY15E. We also expect the dieselisationtrend in the PV space to continue. As PV volumes pick up, the segment islikely to add to <strong>Bosch</strong>’s revenues. An increase in the non-automotivebusiness also lends earnings stability across cycles. With a strong balancesheet supported by robust FCFs, strong return ratios and stable highmargin profile, the financials are impressive.<strong>Bosch</strong> will be a key beneficiary of any recovery in the automotive spaceand could reap high rewards owing to any emission norm changes inCY15E. <strong>Bosch</strong>’s valuations have historically been at a premium to the restof the auto ancillary pack considering its business profile strength andfinancial profile. We expect the same to continue, going forward. Wevalue <strong>Bosch</strong> at 13.5x EV/EBIDTA CY15E and continue to recommendHOLD with an unchanged target price of | 9360.<strong>Bosch</strong> is trading near the higher end of its one-yearEV/EBIDTA valuation band. However, we believe in theseuncertain times, the earnings pedigree and business profilestrength of <strong>Bosch</strong> will ensure the valuations remain atthese elevated levelsExhibit 6: One-year rolling EV/EBIDTA band300002500020000(|)150001000050000Jan-06May-06Sep-06Jan-07May-07Sep-07Jan-08May-08Sep-08Jan-09May-09Sep-09Jan-10May-10Sep-10Jan-11May-11Sep-11Jan-12May-12Sep-12Jan-13May-13Sep-13EV 18.5x 17.1x 15.6x 13.5x 12.8x 11.3xSource: Company, <strong>ICICI</strong>direct.com ResearchExhibit 7: Revised financials (Consolidated)ParticularsCY14ECY15EOld New % Change Old New % ChangeRevenue 9,897.8 9706.3 (1.9) 11,203.5 11115.5 (0.8)EBITDA 1,697.8 1544.8 (9.0) 2,005.5 1872.0 (6.7)EBITDA Margin 17.2 15.9 -124 bps 17.9 16.8 -106 bpsPAT 1154.9 1101.3 (4.6) 1388.8 1372.4 (1.2)EPS 367.8 350.7 (4.6) 442.3 437.1 (1.2)Source: Company, <strong>ICICI</strong>direct.com ResearchExhibit 8: ValuationSales Growth EPS Growth PE EV/EBITDA RoNW RoCE(| cr) (%) (|) (%) (x) (x) (%) (%)CY12 8417.2 305.2 28.9 18.8 17.2 17.1CY13E 8757.8 4.0 319.6 4.7 27.6 17.3 15.8 16.2CY14E 9513.6 8.6 350.7 9.8 25.1 15.7 15.3 15.2CY15E 10891.7 14.5 437.1 24.6 20.2 12.6 16.6 16.9Source: Company, <strong>ICICI</strong>direct.com Research<strong>ICICI</strong> Securities <strong>Ltd</strong> | Retail Equity Research Page 4
Financial summaryProfit and loss statement(| Crore)(Year-end March) CY12 CY13E CY14E CY15ETotal operating Income 8,659.1 8,931.0 9,706.3 11,115.5Growth (%) 6.0 3.1 8.7 14.5Raw Material Expenses 4,753.4 4,867.1 5,271.9 5,954.0Employee Expenses 1,037.1 1,161.4 1,285.2 1,463.6Other Expenses 1,388.8 1,490.1 1,624.5 1,847.8Total Operating Expenditure 7,309.6 7,500.7 8,161.5 9,243.5EBITDA 1,349.5 1,430.3 1,544.8 1,872.0Growth (%) -10.7 6.0 8.0 21.2Depreciation 367.0 370.7 423.9 458.4Interest 5.5 0.5 0.4 0.2Other Income 369.2 385.6 478.0 580.0PBT 1,346.2 1,444.6 1,598.6 1,993.4Exceptional items 0.0 0.0 110.0 0.0Total Tax 387.9 441.2 497.2 621.0PAT 958.3 1,003.4 1,101.3 1,372.4Growth (%) -14.6 4.7 9.8 24.6EPS (|) 305.2 319.6 350.7 437.1Source: Company, <strong>ICICI</strong>direct.com ResearchCash flow statement(| Crore)(Year-end March) CY12 CY13E CY14E CY15EProfit after Tax 958.3 1,003.4 1,101.3 1,372.4Add: Depreciation 367.0 370.7 423.9 458.4(Inc)/dec in Current Assets -63.7 -267.5 -241.6 -605.4Inc/(dec) in CL and Provisions -54.6 100.9 212.4 358.4CF from operating activities 1,207.0 1,207.5 1,496.0 1,583.8(Inc)/dec in Investments 114.9 -310.0 -260.0 -500.0(Inc)/dec in Fixed Assets -735.0 -500.0 -700.0 -600.0Others 122.6 15.9 14.7 13.1CF from investing activities -497.5 -794.1 -945.3 -1,086.9Issue/(Buy back) of Equity 0.0 0.0 0.0 0.0Inc/(dec) in loan funds -60.4 0.0 -10.0 -70.0Dividend paid & dividend tax -219.0 -219.0 -255.5 -292.0Others 100.1 -0.5 -0.4 -0.2CF from financing activities -179.3 -219.5 -265.8 -362.2Net Cash flow 535.7 194.4 285.3 134.9Opening Cash 951.5 1,487.2 1,681.6 1,966.8Closing Cash 1,487.2 1,681.6 1,966.8 2,101.7Source: Company, <strong>ICICI</strong>direct.com ResearchBalance Sheet(| Crore)(Year-end March) CY12 CY13E CY14E CY15ELiabilitiesEquity Capital 31.4 31.4 31.4 31.4Reserve and Surplus 5,541.9 6,326.3 7,172.1 8,252.6Total Shareholders funds 5,573.3 6,357.7 7,203.5 8,284.0Total Debt 185.0 185.0 175.0 105.0Other non-current Liabilities 251.8 291.8 341.8 391.8Total Liabilities 6,010.1 6,834.5 7,720.3 8,780.8AssetsGross Block 3,947.9 4,447.9 5,147.9 5,747.9Less: Acc Depreciation 3,084.6 3,455.3 3,879.2 4,337.6Net Block 863.3 992.6 1,268.7 1,410.3Capital WIP 417.1 417.1 417.1 417.1Total Fixed Assets 1,280.4 1,409.7 1,685.8 1,827.4Investments 1,519.8 1,829.8 2,089.8 2,589.8Inventory 1,095.7 1,151.7 1,225.0 1,417.4Debtors 1,021.0 1,103.7 1,172.9 1,372.7Loans and Advances 878.7 914.3 993.2 1,169.7Other current assets 140.3 233.6 253.7 290.5Cash 1,487.2 1,681.6 1,966.8 2,101.7Total Current Assets 4,622.9 5,084.8 5,611.6 6,351.9Creditors 930.4 983.7 1,094.7 1,278.4Provisions 506.5 535.5 596.0 695.9Other Current Liabilities 456.9 475.4 516.4 591.2Total Current Liabilities 1,893.8 1,994.7 2,207.1 2,565.5Net Current Assets 2,729.1 3,090.1 3,404.6 3,786.4Deferred Tax Asset 255.2 270.2 285.2 285.2Other non-current Assets 225.6 234.7 255.0 291.9Application of Funds 6,010.1 6,834.5 7,720.3 8,780.8Source: Company, <strong>ICICI</strong>direct.com ResearchKey ratios(Year-end March) CY12 CY13E CY14E CY15EPer share data (|)EPS 305.2 319.6 350.7 437.1Cash EPS 422.1 437.6 485.7 583.1BV 1,775.0 2,024.8 2,294.2 2,638.3DPS 60.0 60.0 70.0 80.0Cash Per Share 473.6 535.5 626.4 669.4Operating Ratios (%)EBITDA Margin 15.6 16.0 15.9 16.8PBT / Net sales 16.0 16.5 16.8 18.3PAT Margin 11.1 11.2 11.3 12.3Inventory days 47.5 48.0 47.0 47.5Debtor days 40.3 41.0 42.0 42.8Creditor days 44.3 46.0 45.0 46.0Return Ratios (%)RoE 17.2 15.8 15.3 16.6RoCE 17.1 16.2 15.2 16.9RoIC 24.3 22.8 21.5 23.2Valuation Ratios (x)P/E 28.9 27.6 25.1 20.2EV / EBITDA 18.8 17.3 15.7 12.6EV / Net Sales 3.0 2.8 2.6 2.2Market Cap / Sales 3.3 3.2 2.9 2.5Price to Book Value 5.0 4.4 3.8 3.3Solvency RatiosDebt/Equity 0.0 0.0 0.0 0.0Current Ratio 2.4 2.5 2.5 2.5Quick Ratio 1.9 2.0 2.0 1.9Source: Company, <strong>ICICI</strong>direct.com Research<strong>ICICI</strong> Securities <strong>Ltd</strong> | Retail Equity Research Page 5