Jaiprakash Associates (JAIASS) - ICICI Direct
Jaiprakash Associates (JAIASS) - ICICI Direct
Jaiprakash Associates (JAIASS) - ICICI Direct
- No tags were found...

Create successful ePaper yourself
Turn your PDF publications into a flip-book with our unique Google optimized e-Paper software.
Segmental detailsExhibit 4: Segmental revenues break-up| crore Q3FY12 Q3FY11 Y-o-Y% M9FY12 M9FY11 Y-o-Y%Cement & cement products 1697.3 1237.4 37.2 4548.5 3887.3 17.0Construction 1242.1 1263.9 -1.7 4071.7 4272.1 -4.7Power 3.3 4.3 -23.5 31.3 27.5 13.8Hotel/Hospitality 60.4 54.9 10.0 140.8 129.3 8.9Real Estate 307.9 425.5 -27.6 856.5 1114.9 -23.2Investment 120.5 3.9 2989.0 181.9 11.2 1524.1Others 8.2 2.1 298.1 12.4 7.2 71.2Unallocated 15.6 32.8 -52.5 58.7 95.3 -38.5Total 3455.2 3024.8 14.2 9901.6 9544.9 3.7Less: Intersgmnt revenues 29.3 72.2 -59.4 104.1 299.4 -65.2Total Revenues 3425.9 2952.6 16.0 9797.5 9245.5 6.0Less: Other Income 167.9 58.8 185.4 329.8 185.0 78.3Net Revenues 3257.9 2893.7 12.6 9467.7 9060.6 4.5Source: Company, <strong>ICICI</strong>direct.com ResearchExhibit 5: Segmental EBIT break-up| crore Q3FY12 Q3FY11 Y-o-Y% M9FY12 M9FY11 Y-o-Y%Cement & cement products 169.8 142.2 19.4 334.3 616.8 -45.8Construction 370.8 272.4 36.1 1182.4 708.2 67.0Power -1.7 0.2 -1260.0 16.4 15.2 8.0Hotel/Hospitality 9.2 9.3 -0.6 0.6 6.5 -91.1Real Estate 147.6 294.2 -49.8 420.0 583.1 -28.0Investment 120.5 2.9 4127.0 181.9 11.2 1524.1Others 0.8 -1.1 -8.3 -2.6Less: Unallocable Expenses -80.2 -25.8 -157.8 -95.5EBIT 736.6 694.2 6.1 1969.5 1842.9 6.9Source: Company, <strong>ICICI</strong>direct.com ResearchExhibit 6: Segmental EBIT margin (%)(%) Q3FY12 Q3FY11 Y-o-Y(bps) M9FY12 M9FY11 Y-o-Y(bps)Cement & cement products 10.0 11.5 -149 7.3 15.9 -852Construction 29.8 21.6 829 29.0 16.6 1246Power -53.5 3.5 -5707 52.4 55.2 -284Hotel/Hospitality 15.3 16.9 -164 0.4 5.0Real Estate 47.9 69.1 -2119 49.0 52.3 -327EBIT Margin 22.6 24.0 -138 20.8 20.3 46Source: Company, <strong>ICICI</strong>direct.com Research<strong>ICICI</strong> Securities Ltd | Retail Equity Research Page 3
ValuationWe have fine tuned our earnings estimates to incorporate 9MFY12results. Consequently, we have revised our FY12E and FY13E earningestimates downward by ~12% and 18%, respectively.At the CMP , the stock is trading at 1.7x FY13 P/BV. We maintain our BUYrecommendation with an SOTP price target of | 95. We have valued thecement business at | 69/share (US$110/tonne for the operational capacityof 26.7 MTPA, construction business at | 36/share (6x FY13 EV/EBITDA),power business at | 36/share (JPVL at 20% discount to CMP and directstake in Karcham Wangtoo using DCF methodology), real estate businessat | 40/share (Jaypee Infratech at 20% discount to CMP).We maintain our BUY recommendation with an SOTP pricetarget of | 95Exhibit 7: Valuation metricsSales (| cr) Sales Gr (%) EPS (|) EPS Gr (%) P/E (x) P/BV(x) RoNW(%) RoCE(%)FY10 10088.9 74.2 4.2 0.2 20.4 2.1 11.7 8.0FY11 12966.5 28.5 3.5 -15.8 24.2 1.9 13.0 7.9FY12E 13048.9 0.6 3.1 -13.4 27.9 1.8 6.7 7.2FY13E 14999.3 14.9 3.1 -0.7 28.1 1.7 6.2 6.7Source: Company, <strong>ICICI</strong>direct.com ResearchExhibit 8: Valuation summaryBusiness Value (| cr) Per share CommentCement Division 14685 69 Value operational capacity at US$110/tonneConstruction Division 7640 36 6x FY13E EV/EBITDAPower Division 7595 36JPVL 6140 29 At 20% discount to CMPKarcham Wantgoo 1455 7 Remaining ~43% stake held by JAL based on FCFE used in JPVL valluationReal Estate Division 8466 40Yamuna Expressway 4763 22 At 20% discount to CMPJaypee Greens - Noida & Greater Noida 3703 17 at 0.9x of its NAVHotel Division 113 1 5x FY13E EV/EBITDAGanga Expressway 271 1 1x P/BVJaypee Sports International Ltd 500 2 1x P/BVHimalayan Expressway 118 1 1x P/BVWind Power 490 2 2x P/BVCaptive coal mine 66 0 1x P/BVTreasury shares 1465 7 18.9 crore valued at 10% discount to CMPTotal Enterprise Value 41409 195Less: Net debt 21275 100 Less:Net debtTarget 20134 95Source: Company, <strong>ICICI</strong>direct.com Research<strong>ICICI</strong> Securities Ltd | Retail Equity Research Page 4
Financial summaryProfit and loss statement(| Crore) FY10 FY11 FY12E FY13ENet Sales 10,088.9 12,966.5 13,048.9 14,999.3Growth (%) 74.2 28.5 0.6 14.9Op.Expenditure 7,777.6 10,077.8 10,038.4 11,970.5EBITDA 2,311.4 2,888.7 3,010.5 3,028.7Growth (%) 35.6 25.0 4.2 0.6Other income 768.5 455.8 468.6 534.0Depreciation 456.1 607.9 751.4 860.5EBIT 2,623.8 2,736.6 2,727.7 2,702.3Interest 1,055.8 1,394.2 1,721.2 1,734.9PBT 1,568.0 1,342.4 1,006.5 967.4Tax 673.3 588.0 354.0 319.2Extraordinary item 814.4 410.9 0.0 1.0Rep. PAT before MI 1,709.1 1,165.2 652.5 649.1MI 0.0 0.0 0.0 0.0Rep. PAT after MI 1,709.1 1,165.2 652.5 649.1Adjustment 814.4 410.9 -1.1 0.0Adj. Net Profit 894.7 754.3 653.6 649.1Growth (%) 0.2 -15.7 -13.4 -0.7EPS (|) 4.2 3.5 3.1 3.1Source: Company, <strong>ICICI</strong>direct.com ResearchCash flow statement(| Crore) FY10 FY11 FY12E FY13ENet Profit before tax 2,381.7 1,754.7 1,007.6 967.4Depreciation & Amortisation 456.1 607.9 751.4 860.5Others -201.5 657.5 3,017.3 3,392.9<strong>Direct</strong> tax paid -270.7 -283.7 -354.0 -319.2CF before change in WC 2,365.5 2,736.5 2,657.6 2,710.5Inc/Dec in Trade Recv. -1,263.0 -525.6 848.3 -297.7Inc/Dec in Inventories -325.0 -112.8 -470.5 -187.4Inc/Dec in Loans & Adv -506.8 -590.5 -728.5 -351.7Inc/Dec in other current assets -630.0 -119.0 18.6 -133.9Inc/Dec in cur liabilities 544.6 -180.7 2,477.2 906.0CF from operations 185.3 1,207.9 4,802.8 2,645.8Purchase of Fixed Assets -3,076.4 -4,659.8 -2,000.0 -2,000.0(Inc)/Dec in investments 127.4 -259.4 368.6 434.0CF from investing -2,949.0 -4,919.2 -1,631.4 -1,566.0Inc/(Dec) in Debt 3,646.4 2,281.5 -1,721.2 -1,734.9Inc/(Dec) in Net worth 86.6 13.4 -34.8 -33.9CF from Financing 3,733.0 2,294.9 -1,756.1 -1,768.7Net Inc/Dec in cash & eq. 969.2 -1,416.7 1,415.3 -688.9Opening cash balance 2,909.1 3,879.2 2,462.5 3,877.9Closing cash balance 3,878.3 2,462.5 3,877.9 3,188.0Source: Company, <strong>ICICI</strong>direct.com ResearchBalance Sheet(| Crore) FY10 FY11 FY12E FY13ELiabilitiesEquity capital 424.9 425.3 425.3 425.3Reserves & Surplus 8,075.8 8,972.1 9,749.5 10,363.8Shareholder's fund 8,500.7 9,397.4 10,174.8 10,789.0Minority Interest 0.0 0.0 0.0 0.0Secured & unsecured debt 17,908.7 21,707.6 21,707.6 21,707.6Deferred Tax Liablity 923.3 1,194.0 1,194.0 1,194.0Sources of funds 27,332.7 32,299.0 33,076.4 33,690.7AssetsGross Block 12847.1 14796.4 18311.4 21711.4less: Acc. Depreciation 2228.5 2839.5 3432.5 4293.0Net Block 10618.7 11956.9 14878.9 17418.4Capital WIP 3891.6 6352.7 4837.7 3437.7Net Fixed Assets 14510.3 18309.6 19716.6 20856.1Investment 5576.3 6483.8 6583.8 6683.8Inventories 1553.6 1666.5 2136.9 2324.4Trade Receivables 2285.0 2810.6 1962.3 2260.0Cash 3879.2 2462.5 3877.9 3188.0Loans & Advances 3994.7 4569.7 5298.2 5649.9Other current assets 1386.4 1643.1 1624.4 1758.3Total current assets 13099.0 13152.3 14899.7 15180.5Current Liab. & Prov. 5852.9 5646.7 8123.8 9029.8Net Current Asset 7246.1 7505.7 6775.9 6150.6Misc Expenditure 0.0 0.0 0.0 0.0Application of funds 27,332.7 32,299.0 33,076.4 33,690.7Source: Company, <strong>ICICI</strong>direct.com ResearchKey ratiosFY10 FY11 FY12E FY13EPer share data (|)EPS 4.2 3.5 3.1 3.1Cash EPS 4.0 3.4 3.0 2.9BV 40.0 44.2 47.8 50.7Revenue per share 47.5 61.0 61.4 70.5Cash Per Share 18.3 11.6 18.2 15.0Operating Ratios (%)EBITDA Margin 22.9 22.3 23.1 20.2PBT / Net Sales 15.5 10.4 7.7 6.4PAT Margin 8.9 5.8 5.0 4.3Working Capital (ex cash) days 121.8 142.0 81.1 72.1Debtor days 59.8 71.7 66.8 51.4Creditor days 306.5 240.0 307.9 313.0Return Ratios (%)RoE 8.0 7.9 7.2 6.7RoCE 12.8 10.3 9.2 9.3RoIC 0.0 0.0 0.0 0.0Valuation Ratios (x)P/E 20.4 24.2 27.9 28.1EV / EBITDA 14.0 13.0 12.0 12.1EV / Net Sales 0.0 0.0 0.0 0.0Div Yield (%) 2.1 1.9 1.8 1.7Price to Book Value 0.0 0.0 0.0 0.0Solvency RatiosDebt/EBITDA 0.0 0.0 0.0 0.0Debt / Equity 0.5 0.6 0.5 0.5Current Ratio 2.2 2.3 1.8 1.7Quick Ratio 1.6 1.9 1.4 1.3Source: Company, <strong>ICICI</strong>direct.com Research<strong>ICICI</strong> Securities Ltd | Retail Equity Research Page 5
<strong>ICICI</strong>direct.com coverage universe (Infrastructure)JP <strong>Associates</strong> Sales (| Crore) EPS (|) PE (x) P/BV(x) RoNW (%) RoCE (%)Idirect Code <strong>JAIASS</strong> CMP 86 FY10 10,088.9 4.2 20.4 2.1 11.7 8.0Mcap (| crore) 18243 Target 95 FY11 12,966.5 3.5 24.2 1.9 13.0 7.9GMR Infra% Upside 11% FY12E 13,048.9 3.1 27.9 1.8 6.7 7.2FY13E 14,999.3 3.1 28.1 1.7 6.2 6.7Idirect Code GMRINF CMP 32 FY10 4,566.5 0.4 71.7 1.3 2.3 3.9Mcap (| crore) 12435 Target 32 FY11 5,773.8 -0.3 NA 1.0 -9.8 3.1GVK Power% Upside 0% FY12E 7,796.8 -0.5 NA 1.1 -2.9 2.9FY13E 9,689.6 0.5 67.5 1.1 1.9 4.2Idirect Code GVKPOW CMP 19 FY10 1,786.6 1.0 17.4 0.9 4.9 4.2Mcap (| crore) 2945 Target 28 FY11 1,914.7 1.0 17.5 0.8 4.6 3.3IRB Infrastructure% Upside 50% FY12E 2,053.7 1.0 16.9 0.8 4.5 2.4FY13E 2,353.0 1.2 14.2 0.7 5.1 3.9Idirect Code IRBINF CMP 189 FY10 1,704.9 11.6 15.2 2.9 18.9 12.3Mcap (| crore) 6287 Target 189 FY11 2,438.1 13.6 13.0 2.4 18.6 12.2Source: Company, <strong>ICICI</strong>direct.com Research% Upside 0% FY12E 3,041.1 13.9 12.1 2.0 16.3 10.6FY13E 3,959.1 13.9 12.1 1.7 14.2 10.0<strong>ICICI</strong> Securities Ltd | Retail Equity Research Page 6
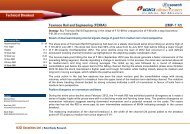
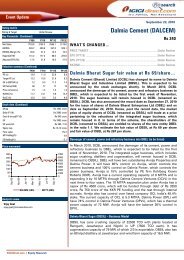
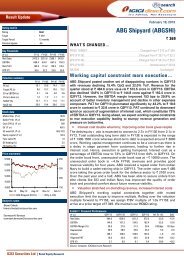
Exhibit 9: Recommendation History20016012080400Feb-11Apr-11May-11Jul-11Aug-11Oct-11Nov-11Jan-12Feb-12PriceTarget PriceSource: Reuters, <strong>ICICI</strong>direct.com ResearchExhibit 10: Recent ReleasesDate Event CMP Target Price Rating1-Feb-11 Q3FY11 Result Update 80 90 Hold17-May-11 Q4FY11 Result Update 83 106 Buy17-Aug-11 Q1FY12 Result Update 58 88 Buy15-Nov-11 Q2FY12 Result Update 70 82 BuySource: Company, <strong>ICICI</strong>direct.com Research<strong>ICICI</strong> Securities Ltd | Retail Equity Research Page 7
RATING RATIONALE<strong>ICICI</strong>direct.com endeavours to provide objective opinions and recommendations. <strong>ICICI</strong>direct.com assignsratings to its stocks according to their notional target price vs. current market price and then categorises themas Strong Buy, Buy, Hold and Sell. The performance horizon is two years unless specified and the notionaltarget price is defined as the analysts' valuation for a stock.Strong Buy: >15%/20% for large caps/midcaps, respectively, with high conviction;Buy: >10%/15% for large caps/midcaps, respectively;Hold: Up to +/-10%;Sell: -10% or more;Pankaj Pandey Head – Research pankaj.pandey@icicisecurities.com<strong>ICICI</strong>direct.com Research Desk,<strong>ICICI</strong> Securities Limited,1 st Floor, Akruti Trade Centre,Road No. 7, MIDC,Andheri (East)Mumbai – 400 093research@icicidirect.comANALYST CERTIFICATIONWe /I, Deepak Purswani CFA, PGDM (FINANCE) Bhupendra Tiwary MBA (FINANCE) research analysts, authors and the names subscribed to this report, hereby certify that all of the views expressed in thisresearch report accurately reflect our personal views about any and all of the subject issuer(s) or securities. We also certify that no part of our compensation was, is, or will be directly or indirectly related tothe specific recommendation(s) or view(s) in this report. Analysts aren't registered as research analysts by FINRA and might not be an associated person of the <strong>ICICI</strong> Securities Inc.Disclosures:<strong>ICICI</strong> Securities Limited (<strong>ICICI</strong> Securities) and its affiliates are a full-service, integrated investment banking, investment management and brokerage and financing group. We along with affiliates are leadingunderwriter of securities and participate in virtually all securities trading markets in India. We and our affiliates have investment banking and other business relationship with a significant percentage ofcompanies covered by our Investment Research Department. Our research professionals provide important input into our investment banking and other business selection processes. <strong>ICICI</strong> Securitiesgenerally prohibits its analysts, persons reporting to analysts and their dependent family members from maintaining a financial interest in the securities or derivatives of any companies that the analystscover.The information and opinions in this report have been prepared by <strong>ICICI</strong> Securities and are subject to change without any notice. The report and information contained herein is strictly confidential andmeant solely for the selected recipient and may not be altered in any way, transmitted to, copied or distributed, in part or in whole, to any other person or to the media or reproduced in any form, withoutprior written consent of <strong>ICICI</strong> Securities. While we would endeavour to update the information herein on reasonable basis, <strong>ICICI</strong> Securities, its subsidiaries and associated companies, their directors andemployees (“<strong>ICICI</strong> Securities and affiliates”) are under no obligation to update or keep the information current. Also, there may be regulatory, compliance or other reasons that may prevent <strong>ICICI</strong> Securitiesfrom doing so. Non-rated securities indicate that rating on a particular security has been suspended temporarily and such suspension is in compliance with applicable regulations and/or <strong>ICICI</strong> Securitiespolicies, in circumstances where <strong>ICICI</strong> Securities is acting in an advisory capacity to this company, or in certain other circumstances.This report is based on information obtained from public sources and sources believed to be reliable, but no independent verification has been made nor is its accuracy or completeness guaranteed. Thisreport and information herein is solely for informational purpose and may not be used or considered as an offer document or solicitation of offer to buy or sell or subscribe for securities or other financialinstruments. Though disseminated to all the customers simultaneously, not all customers may receive this report at the same time. <strong>ICICI</strong> Securities will not treat recipients as customers by virtue of theirreceiving this report. Nothing in this report constitutes investment, legal, accounting and tax advice or a representation that any investment or strategy is suitable or appropriate to your specificcircumstances. The securities discussed and opinions expressed in this report may not be suitable for all investors, who must make their own investment decisions, based on their own investmentobjectives, financial positions and needs of specific recipient. This may not be taken in substitution for the exercise of independent judgment by any recipient. The recipient should independently evaluatethe investment risks. The value and return of investment may vary because of changes in interest rates, foreign exchange rates or any other reason. <strong>ICICI</strong> Securities and affiliates accept no liabilities for anyloss or damage of any kind arising out of the use of this report. Past performance is not necessarily a guide to future performance. Investors are advised to see Risk Disclosure Document to understand therisks associated before investing in the securities markets. Actual results may differ materially from those set forth in projections. Forward-looking statements are not predictions and may be subject tochange without notice.<strong>ICICI</strong> Securities and its affiliates might have managed or co-managed a public offering for the subject company in the preceding twelve months. <strong>ICICI</strong> Securities and affiliates might have receivedcompensation from the companies mentioned in the report during the period preceding twelve months from the date of this report for services in respect of public offerings, corporate finance, investmentbanking or other advisory services in a merger or specific transaction. It is confirmed that Deepak Purswani CFA, PGDM (FINANCE) Bhupendra Tiwary MBA (FINANCE) research analysts and the authors ofthis report have not received any compensation from the companies mentioned in the report in the preceding twelve months. Our research professionals are paid in part based on the profitability of <strong>ICICI</strong>Securities, which include earnings from Investment Banking and other business.<strong>ICICI</strong> Securities or its subsidiaries collectively do not own 1% or more of the equity securities of the Company mentioned in the report as of the last day of the month preceding the publication of theresearch report.It is confirmed that Deepak Purswani CFA, PGDM (FINANCE) Bhupendra Tiwary MBA (FINANCE)officer, director or advisory board member of the companies mentioned in the report.research analysts and the authors of this report or any of their family members does not serve as an<strong>ICICI</strong> Securities may have issued other reports that are inconsistent with and reach different conclusion from the information presented in this report. <strong>ICICI</strong> Securities and affiliates may act upon or make useof information contained in the report prior to the publication thereof.This report is not directed or intended for distribution to, or use by, any person or entity who is a citizen or resident of or located in any locality, state, country or other jurisdiction, where such distribution,publication, availability or use would be contrary to law, regulation or which would subject <strong>ICICI</strong> Securities and affiliates to any registration or licensing requirement within such jurisdiction. The securitiesdescribed herein may or may not be eligible for sale in all jurisdictions or to certain category of investors. Persons in whose possession this document may come are required to inform themselves of andto observe such restriction.<strong>ICICI</strong> Securities Limited has been mandated to act as one of the Book Running Lead Managers to manage the IPO of the group company of Hindustan Construction Co Ltd, viz., Lavasa Corporation Ltd. Thisreport is prepared on the basis of publicly available information.<strong>ICICI</strong> Securities Ltd | Retail Equity Research Page 8