ABG Shipyard (ABGSHI) - ICICI Direct
ABG Shipyard (ABGSHI) - ICICI Direct
ABG Shipyard (ABGSHI) - ICICI Direct

You also want an ePaper? Increase the reach of your titles
YUMPU automatically turns print PDFs into web optimized ePapers that Google loves.
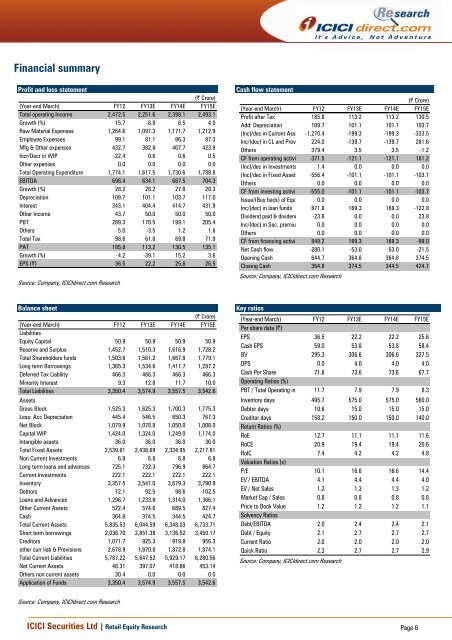
Financial summary<br />
Profit and loss statement<br />
(| Crore)<br />
(Year-end March) FY12 FY13E FY14E FY15E<br />
Total operating Income 2,472.5 2,251.6 2,398.1 2,493.1<br />
Growth (%) 15.7 -8.9 6.5 4.0<br />
Raw Material Expenses 1,264.6 1,097.3 1,171.7 1,212.9<br />
Employee Expenses 99.1 81.1 86.3 87.3<br />
Mfg & Other expenses 432.7 382.8 407.7 423.8<br />
Incr/Decr in WIP -22.4 0.6 0.6 0.5<br />
Other expenses 0.0 0.0 0.0 0.0<br />
Total Operating Expenditure 1,774.1 1,617.5 1,730.6 1,788.8<br />
EBITDA 698.4 634.1 667.5 704.3<br />
Growth (%) 28.2 28.2 27.8 28.3<br />
Depreciation 109.7 101.1 103.7 117.0<br />
Interest 343.1 404.4 414.7 431.9<br />
Other Income 43.7 50.0 50.0 50.0<br />
PBT 289.3 178.5 199.1 205.4<br />
Others -5.0 -3.5 1.2 1.6<br />
Total Tax 98.6 61.8 69.8 71.9<br />
PAT 185.8 113.2 130.5 135.1<br />
Growth (%) -4.2 -39.1 15.2 3.6<br />
EPS (|) 36.5 22.2 25.6 26.5<br />
Source: Company, <strong>ICICI</strong>direct.com Research<br />
Cash flow statement<br />
(| Crore)<br />
(Year-end March) FY12 FY13E FY14E FY15E<br />
Profit after Tax 185.8 113.2 113.2 130.5<br />
Add: Depreciation 109.7 101.1 101.1 103.7<br />
(Inc)/dec in Current Ass -1,270.4 -199.3 -199.3 -333.5<br />
Inc/(dec) in CL and Prov 224.0 -139.7 -139.7 281.6<br />
Others 379.4 3.5 3.5 -1.2<br />
CF from operating activi -371.5 -121.1 -121.1 181.2<br />
(Inc)/dec in Investments 1.4 0.0 0.0 0.0<br />
(Inc)/dec in Fixed Asset -556.4 -101.1 -101.1 -103.7<br />
Others 0.0 0.0 0.0 0.0<br />
CF from investing activi -555.0 -101.1 -101.1 -103.7<br />
Issue/(Buy back) of Equ 0.0 0.0 0.0 0.0<br />
Inc/(dec) in loan funds 871.8 169.3 169.3 -122.8<br />
Dividend paid & dividend -23.6 0.0 0.0 23.8<br />
Inc/(dec) in Sec. premiu 0.0 0.0 0.0 0.0<br />
Others 0.0 0.0 0.0 0.0<br />
CF from financing activi 848.2 169.3 169.3 -99.0<br />
Net Cash flow -280.1 -53.0 -53.0 -21.5<br />
Opening Cash 644.7 364.8 364.8 374.5<br />
Closing Cash 364.8 374.5 344.5 424.7<br />
Source: Company, <strong>ICICI</strong>direct.com Research<br />
Balance sheet<br />
(| Crore)<br />
(Year-end March) FY12 FY13E FY14E FY15E<br />
Liabilities<br />
Equity Capital 50.9 50.9 50.9 50.9<br />
Reserve and Surplus 1,452.7 1,510.3 1,616.9 1,728.2<br />
Total Shareholders funds 1,503.6 1,561.2 1,667.8 1,779.1<br />
Long term Borrowings 1,365.3 1,534.6 1,411.7 1,287.2<br />
Deferred Tax Liability 466.3 466.3 466.3 466.3<br />
Minority Interest 9.3 12.8 11.7 10.0<br />
Total Liabilities 3,350.4 3,574.9 3,557.5 3,542.6<br />
Assets<br />
Gross Block 1,525.3 1,625.3 1,700.3 1,775.3<br />
Less: Acc Depreciation 445.4 546.5 650.3 767.3<br />
Net Block 1,079.9 1,078.8 1,050.0 1,008.0<br />
Capital WIP 1,424.0 1,324.0 1,249.0 1,174.0<br />
Intangible assets 36.0 36.0 36.0 36.0<br />
Total Fixed Assets 2,539.81 2,438.69 2,334.95 2,217.91<br />
Non Current Investments 6.8 6.8 6.8 6.8<br />
Long term loans and advances 725.1 732.3 796.9 864.7<br />
Current Investments 222.1 222.1 222.1 222.1<br />
Inventory 3,357.5 3,547.0 3,679.3 3,790.9<br />
Debtors 72.1 92.5 98.6 102.5<br />
Loans and Advances 1,296.7 1,233.8 1,314.0 1,366.1<br />
Other Current Assets 522.4 574.6 689.5 827.4<br />
Cash 364.8 374.5 344.5 424.7<br />
Total Current Assets 5,835.53 6,044.59 6,348.03 6,733.71<br />
Short term borrowings 2,036.70 2,851.38 3,136.52 3,450.17<br />
Creditors 1,071.7 925.3 919.8 956.3<br />
other curr liab & Provisions 2,678.9 1,870.8 1,872.8 1,874.1<br />
Total Current Liabilities 5,787.22 5,647.52 5,929.17 6,280.56<br />
Net Current Assets 48.31 397.07 418.86 453.14<br />
Others non current assets 30.4 0.0 0.0 0.0<br />
Application of Funds 3,350.4 3,574.9 3,557.5 3,542.6<br />
Key ratios<br />
(Year-end March) FY12 FY13E FY14E FY15E<br />
Per share data (|)<br />
EPS 36.5 22.2 22.2 25.6<br />
Cash EPS 59.0 53.8 53.8 58.4<br />
BV 295.3 306.6 306.6 327.5<br />
DPS 0.0 4.0 4.0 4.0<br />
Cash Per Share 71.6 73.6 73.6 67.7<br />
Operating Ratios (%)<br />
PBT / Total Operating in 11.7 7.9 7.9 8.3<br />
Inventory days 495.7 575.0 575.0 560.0<br />
Debtor days 10.6 15.0 15.0 15.0<br />
Creditor days 158.2 150.0 150.0 140.0<br />
Return Ratios (%)<br />
RoE 12.7 11.1 11.1 11.6<br />
RoCE 20.9 19.4 19.4 20.6<br />
RoIC 7.4 4.2 4.2 4.8<br />
Valuation Ratios (x)<br />
P/E 10.1 16.6 16.6 14.4<br />
EV / EBITDA 4.1 4.4 4.4 4.0<br />
EV / Net Sales 1.2 1.3 1.3 1.2<br />
Market Cap / Sales 0.8 0.8 0.8 0.8<br />
Price to Book Value 1.2 1.2 1.2 1.1<br />
Solvency Ratios<br />
Debt/EBITDA 2.0 2.4 2.4 2.1<br />
Debt / Equity 2.1 2.7 2.7 2.7<br />
Current Ratio 2.0 2.0 2.0 2.0<br />
Quick Ratio 2.3 2.7 2.7 2.9<br />
Source: Company, <strong>ICICI</strong>direct.com Research<br />
Source: Company, <strong>ICICI</strong>direct.com Research<br />
<strong>ICICI</strong> Securities Ltd | Retail Equity Research Page 6