Financial summary Profit and loss statement (| Crore) (Year-end March) FY12 FY13E FY14E FY15E Total operating Income 2,472.5 2,251.6 2,398.1 2,493.1 Growth (%) 15.7 -8.9 6.5 4.0 Raw Material Expenses 1,264.6 1,097.3 1,171.7 1,212.9 Employee Expenses 99.1 81.1 86.3 87.3 Mfg & Other expenses 432.7 382.8 407.7 423.8 Incr/Decr in WIP -22.4 0.6 0.6 0.5 Other expenses 0.0 0.0 0.0 0.0 Total Operating Expenditure 1,774.1 1,617.5 1,730.6 1,788.8 EBITDA 698.4 634.1 667.5 704.3 Growth (%) 28.2 28.2 27.8 28.3 Depreciation 109.7 101.1 103.7 117.0 Interest 343.1 404.4 414.7 431.9 Other Income 43.7 50.0 50.0 50.0 PBT 289.3 178.5 199.1 205.4 Others -5.0 -3.5 1.2 1.6 Total Tax 98.6 61.8 69.8 71.9 PAT 185.8 113.2 130.5 135.1 Growth (%) -4.2 -39.1 15.2 3.6 EPS (|) 36.5 22.2 25.6 26.5 Source: Company, <strong>ICICI</strong>direct.com Research Cash flow statement (| Crore) (Year-end March) FY12 FY13E FY14E FY15E Profit after Tax 185.8 113.2 113.2 130.5 Add: Depreciation 109.7 101.1 101.1 103.7 (Inc)/dec in Current Ass -1,270.4 -199.3 -199.3 -333.5 Inc/(dec) in CL and Prov 224.0 -139.7 -139.7 281.6 Others 379.4 3.5 3.5 -1.2 CF from operating activi -371.5 -121.1 -121.1 181.2 (Inc)/dec in Investments 1.4 0.0 0.0 0.0 (Inc)/dec in Fixed Asset -556.4 -101.1 -101.1 -103.7 Others 0.0 0.0 0.0 0.0 CF from investing activi -555.0 -101.1 -101.1 -103.7 Issue/(Buy back) of Equ 0.0 0.0 0.0 0.0 Inc/(dec) in loan funds 871.8 169.3 169.3 -122.8 Dividend paid & dividend -23.6 0.0 0.0 23.8 Inc/(dec) in Sec. premiu 0.0 0.0 0.0 0.0 Others 0.0 0.0 0.0 0.0 CF from financing activi 848.2 169.3 169.3 -99.0 Net Cash flow -280.1 -53.0 -53.0 -21.5 Opening Cash 644.7 364.8 364.8 374.5 Closing Cash 364.8 374.5 344.5 424.7 Source: Company, <strong>ICICI</strong>direct.com Research Balance sheet (| Crore) (Year-end March) FY12 FY13E FY14E FY15E Liabilities Equity Capital 50.9 50.9 50.9 50.9 Reserve and Surplus 1,452.7 1,510.3 1,616.9 1,728.2 Total Shareholders funds 1,503.6 1,561.2 1,667.8 1,779.1 Long term Borrowings 1,365.3 1,534.6 1,411.7 1,287.2 Deferred Tax Liability 466.3 466.3 466.3 466.3 Minority Interest 9.3 12.8 11.7 10.0 Total Liabilities 3,350.4 3,574.9 3,557.5 3,542.6 Assets Gross Block 1,525.3 1,625.3 1,700.3 1,775.3 Less: Acc Depreciation 445.4 546.5 650.3 767.3 Net Block 1,079.9 1,078.8 1,050.0 1,008.0 Capital WIP 1,424.0 1,324.0 1,249.0 1,174.0 Intangible assets 36.0 36.0 36.0 36.0 Total Fixed Assets 2,539.81 2,438.69 2,334.95 2,217.91 Non Current Investments 6.8 6.8 6.8 6.8 Long term loans and advances 725.1 732.3 796.9 864.7 Current Investments 222.1 222.1 222.1 222.1 Inventory 3,357.5 3,547.0 3,679.3 3,790.9 Debtors 72.1 92.5 98.6 102.5 Loans and Advances 1,296.7 1,233.8 1,314.0 1,366.1 Other Current Assets 522.4 574.6 689.5 827.4 Cash 364.8 374.5 344.5 424.7 Total Current Assets 5,835.53 6,044.59 6,348.03 6,733.71 Short term borrowings 2,036.70 2,851.38 3,136.52 3,450.17 Creditors 1,071.7 925.3 919.8 956.3 other curr liab & Provisions 2,678.9 1,870.8 1,872.8 1,874.1 Total Current Liabilities 5,787.22 5,647.52 5,929.17 6,280.56 Net Current Assets 48.31 397.07 418.86 453.14 Others non current assets 30.4 0.0 0.0 0.0 Application of Funds 3,350.4 3,574.9 3,557.5 3,542.6 Key ratios (Year-end March) FY12 FY13E FY14E FY15E Per share data (|) EPS 36.5 22.2 22.2 25.6 Cash EPS 59.0 53.8 53.8 58.4 BV 295.3 306.6 306.6 327.5 DPS 0.0 4.0 4.0 4.0 Cash Per Share 71.6 73.6 73.6 67.7 Operating Ratios (%) PBT / Total Operating in 11.7 7.9 7.9 8.3 Inventory days 495.7 575.0 575.0 560.0 Debtor days 10.6 15.0 15.0 15.0 Creditor days 158.2 150.0 150.0 140.0 Return Ratios (%) RoE 12.7 11.1 11.1 11.6 RoCE 20.9 19.4 19.4 20.6 RoIC 7.4 4.2 4.2 4.8 Valuation Ratios (x) P/E 10.1 16.6 16.6 14.4 EV / EBITDA 4.1 4.4 4.4 4.0 EV / Net Sales 1.2 1.3 1.3 1.2 Market Cap / Sales 0.8 0.8 0.8 0.8 Price to Book Value 1.2 1.2 1.2 1.1 Solvency Ratios Debt/EBITDA 2.0 2.4 2.4 2.1 Debt / Equity 2.1 2.7 2.7 2.7 Current Ratio 2.0 2.0 2.0 2.0 Quick Ratio 2.3 2.7 2.7 2.9 Source: Company, <strong>ICICI</strong>direct.com Research Source: Company, <strong>ICICI</strong>direct.com Research <strong>ICICI</strong> Securities Ltd | Retail Equity Research Page 6
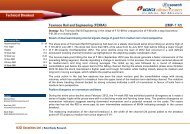
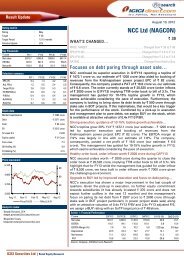
Company Description <strong>ABG</strong> <strong>Shipyard</strong> Limited is a private sector ship building company with facilities to build and repair a variety of marine ships. The company manufactures bulk carriers, deck barges, interceptor boats and offshore vessels. The company serves commercial and government customers. Exhibit 15: Recommendation History 500 450 400 350 300 250 200 150 100 50 0 Mar-12 Apr-12 May-12 Jul-12 Aug-12 Oct-12 Nov-12 Jan-13 Feb-13 Price Target Price Source: Company, <strong>ICICI</strong>direct.com Research Exhibit 16: Recent Releases Date Event CMP Target Price Rating 6-Jan-12 Q3FY12 Result preview 392 373 HOLD 21-Feb-12 Q3FY12 Result Update 434 427 HOLD 7-Jun-12 Q4FY12 Result update 377 432 BUY 21-Aug-12 Q1FY13 Result Update 360 375 HOLD 12-Nov-12 Q2FY13 Result Update 393 372 HOLD 8-Jan-13 Q3FY13 Result Preview 410 372 Source: Company, <strong>ICICI</strong>direct.com Research HOLD <strong>ICICI</strong> Securities Ltd | Retail Equity Research Page 7