investment statement for - Pumpkin Patch investor relations
investment statement for - Pumpkin Patch investor relations
investment statement for - Pumpkin Patch investor relations

Create successful ePaper yourself
Turn your PDF publications into a flip-book with our unique Google optimized e-Paper software.
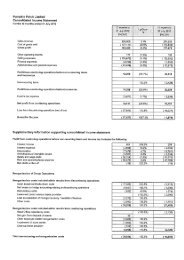
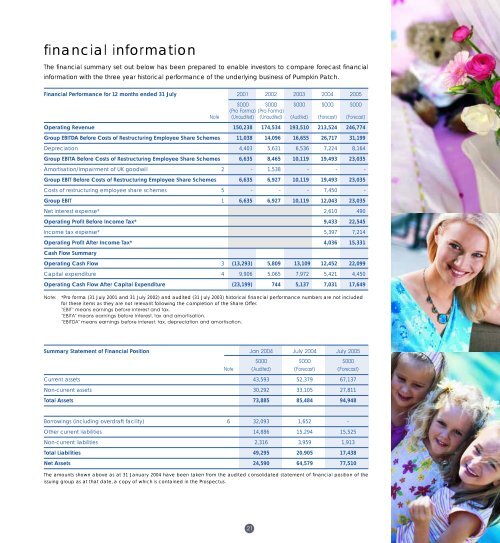
financial in<strong>for</strong>mationThe financial summary set out below has been prepared to enable <strong>investor</strong>s to compare <strong>for</strong>ecast financialin<strong>for</strong>mation with the three year historical per<strong>for</strong>mance of the underlying business of <strong>Pumpkin</strong> <strong>Patch</strong>.Financial Per<strong>for</strong>mance <strong>for</strong> 12 months ended 31 July 2001 2002 2003 2004 2005$000 $000 $000 $000 $000(Pro Forma) (Pro Forma)Note (Unaudited) (Unaudited) (Audited) (Forecast) (Forecast)Operating Revenue 150,238 174,534 193,510 213,524 246,774Group EBITDA Be<strong>for</strong>e Costs of Restructuring Employee Share Schemes 11,038 14,096 16,655 26,717 31,199Depreciation 4,403 5,631 6,536 7,224 8,164Group EBITA Be<strong>for</strong>e Costs of Restructuring Employee Share Schemes 6,635 8,465 10,119 19,493 23,035Amortisation/Impairment of UK goodwill 2 - 1,538 - - -Group EBIT Be<strong>for</strong>e Costs of Restructuring Employee Share Schemes 6,635 6,927 10,119 19,493 23,035Costs of restructuring employee share schemes 5 - - - 7,450 -Group EBIT 1 6,635 6,927 10,119 12,043 23,035Net interest expense* 2,610 490Operating Profit Be<strong>for</strong>e Income Tax* 9,433 22,545Income tax expense* 5,397 7,214Operating Profit After Income Tax* 4,036 15,331Cash Flow SummaryOperating Cash Flow 3 (13,293) 5,809 13,109 12,452 22,099Capital expenditure 4 9,906 5,065 7,972 5,421 4,450Operating Cash Flow After Capital Expenditure (23,199) 744 5,137 7,031 17,649Note:*Pro <strong>for</strong>ma (31 July 2001 and 31 July 2002) and audited (31 July 2003) historical financial per<strong>for</strong>mance numbers are not included<strong>for</strong> these items as they are not relevant following the completion of the Share Offer.“EBIT” means earnings be<strong>for</strong>e interest and tax.“EBITA” means earnings be<strong>for</strong>e interest, tax and amortisation.“EBITDA” means earnings be<strong>for</strong>e interest, tax, depreciation and amortisation.Summary Statement of Financial Position Jan 2004 July 2004 July 2005$000 $000 $000Note (Audited) (Forecast) (Forecast)Current assets 43,593 52,379 67,137Non-current assets 30,292 33,105 27,811Total Assets 73,885 85,484 94,948Borrowings (including overdraft facility) 6 32,093 1,652 -Other current liabilities 14,886 15,294 15,525Non-current liabilities 2,316 3,959 1,913Total Liabilities 49,295 20,905 17,438Net Assets 24,590 64,579 77,510The amounts shown above as at 31 January 2004 have been taken from the audited consolidated <strong>statement</strong> of financial position of theissuing group as at that date, a copy of which is contained in the Prospectus.21