
You also want an ePaper? Increase the reach of your titles
YUMPU automatically turns print PDFs into web optimized ePapers that Google loves.
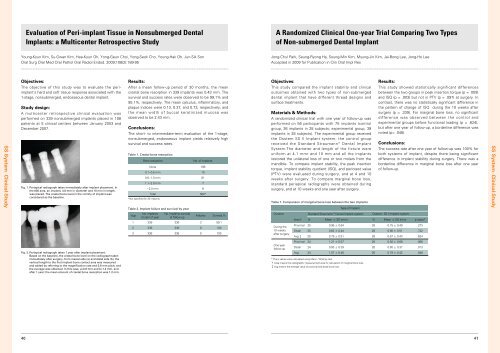
Evaluation of Peri-implant Tissue in Nonsubmerged DentalImplants: a Multicenter Retrospective StudyA Randomized Clinical One-year Trial Comparing Two Typesof Non-submerged Dental ImplantYoung-Kyun Kim, Su-Gwan Kim, Hee-Kyun Oh, Yong-Geun Choi, Yong-Seok Cho, Young-Hak Oh, Jun-Sik SonOral Surg Oral Med Oral Pathol Oral Radiol Endod. 2009;108(2):189-95Jong-Chul Park, Seung-Ryong Ha, Soung-Min Kim, Myung-Jin Kim, Jai-Bong Lee, Jong-Ho LeeAccepted in 2009 for Publication in Clin Oral Impl ResSS <strong>System</strong> Clinical StudyObjectives:The objective of this study was to evaluate the periimplant’shard and soft tissue response associated with the1-stage, nonsubmerged, endosseous dental implant.Study design:A multicenter retrospective clinical evaluation wasperformed on 339 nonsubmerged implants placed in 108patients at 5 clinical centers between January 2003 andDecember 2007.Fig. 1. Periapical radiograph taken immediately after implant placement. Inthe #36 area, an implant, 4.8 mm in diameter and 10 mm in length,was placed. The crestal bone level in the vicinity of implant wasconsidered as the baseline.Results:After a mean follow-up period of 30 months, the meancrestal bone resorption in 339 implants was 0.43 mm. Thesurvival and success rates were observed to be 99.1% and95.1%, respectively. The mean calculus, inflammatory, andplaque indices were 0.13, 0.37, and 0.73, respectively, andthe mean width of buccal keratinized mucosa wasobserved to be 2.43 mm.Conclusions:The short- to intermediate-term evaluation of the 1-stage,nonsubmerged, endosseous implant yields relatively highsurvival and success rates.Table 1. Crestal bone resorptionBone resorptionNo. of implantsNone 1980.1~0.5 mm 100.6~1.0 mm 811.1~2.0 mm 7~2.0 mm 8Total 304**Not specified for 35 implants.Table 2. Implant failure and survival by yearYearNo. implantsat start of yearNo. implants survivalat follow-upFailuresSurvival,%1 339 336 3 99.12 336 336 0 1003 336 336 0 100Objectives:This study compared the implant stability and clinicaloutcomes obtained with two types of non-submergeddental implant that have different thread designs andsurface treatments.Materials & Methods:A randomized clinical trial with one year of follow-up wasperformed on 56 participants with 75 implants (controlgroup, 36 implants in 28 subjects; experimental group, 39implants in 28 subjects). The experimental group receivedthe <strong>Osstem</strong> SS II Implant system; the control groupreceived the Standard Straumann Dental Implant<strong>System</strong>.The diameter and length of the fixture wereuniform at 4.1 mmr and 10 mm and all the implantsrestored the unilateral loss of one or two molars from themandible. To compare implant stability, the peak insertiontorque, implant stability quotient (ISQ), and periotest value(PTV) were evaluated during surgery, and at 4 and 10weeks after surgery. To compare marginal bone loss,standard periapical radiographs were obtained duringsurgery, and at 10 weeks and one year after surgery.Table 1. Comparison of marginal bone loss between the two implantsDurationDuring the10 weeksafter surgeryType of ImplantStandard Straumann Dental Implant systemArea N Mean ± SD (mm) N Mean ± SD (mm) p value*Results:This study showed statistically significant differencesbetween the two groups in peak insertion torque (p = .009)and ISQ (p = .003) but not in PTV (p = .097) at surgery. Incontrast, there was no statistically significant difference inthe pattern of change of ISQ during the 10 weeks aftersurgery (p = .339). For marginal bone loss, no significantdifference was observed between the control andexperimental groups before functional loading (p = .624),but after one year of follow-up, a borderline difference wasnoted (p= .048).Conclusions:The success rate after one year of follow-up was 100% forboth systems of implant, despite there being significantdifference in implant stability during surgery. There was aborderline difference in marginal bone loss after one yearof follow-up.<strong>Osstem</strong> SS II Implant systemProximal 25 0.96 ± 0.64 28 0.75 ± 0.49 .273Distal 25 0.62 ± 0.44 28 0.60 ± 0.51 .722Avg 25 0.79 ± 0.51 28 0.67 ± 0.43 .624Proximal 24 1.21 ± 0.57 26 0.92 ± 0.68 .066Distal 24 0.93 ± 0.39 26 0.65 ± 0.37 .013Avg 24 1.07 ± 0.46 26 0.79 ± 0.42 .048SS <strong>System</strong> Clinical StudyFig. 2. Periapical radiograph taken 1 year after implant placement.Based on the baseline, the crestal bone level on the radiograph takenimmediately after surgery, from mesial side (a) and distal side (b), thevertical length to the first implant-bone contact area was measuredand added by referring to the magnification rate and 0.8 mm pitch, andthe average was obtained. In this case, a=0.8 mm and b=1.2 mm, andafter 1 year; the mean amount of crestal bone resorption was 1.2 mm.One yearfollow-up* The p values were calculated using Mann - Whitney test. Area means the radiographic measurement area for calculation of marginal bone loss.Avg means the average value of proximal and distal bone loss.4041