State of Environment Report 2007-08 - Wollongong City Council
State of Environment Report 2007-08 - Wollongong City Council
State of Environment Report 2007-08 - Wollongong City Council

Create successful ePaper yourself
Turn your PDF publications into a flip-book with our unique Google optimized e-Paper software.
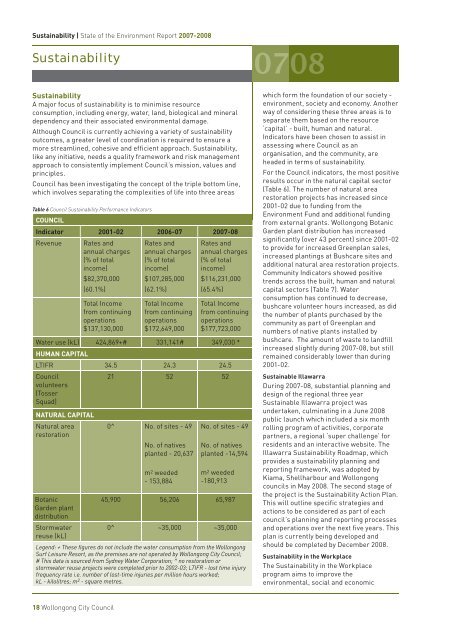
Sustainability | <strong>State</strong> <strong>of</strong> the <strong>Environment</strong> <strong>Report</strong> <strong>2007</strong>-20<strong>08</strong>SustainabilitySustainabilityA major focus <strong>of</strong> sustainability is to minimise resourceconsumption, including energy, water, land, biological and mineraldependency and their associated environmental damage.Although <strong>Council</strong> is currently achieving a variety <strong>of</strong> sustainabilityoutcomes, a greater level <strong>of</strong> coordination is required to ensure amore streamlined, cohesive and efficient approach. Sustainability,like any initiative, needs a quality framework and risk managementapproach to consistently implement <strong>Council</strong>’s mission, values andprinciples.<strong>Council</strong> has been investigating the concept <strong>of</strong> the triple bottom line,which involves separating the complexities <strong>of</strong> life into three areasTable 6 <strong>Council</strong> Sustainability Performance IndicatorsCOUNCILIndicator 2001-02 2006-07 <strong>2007</strong>-<strong>08</strong>Revenue Rates andannual charges(% <strong>of</strong> totalincome)$82,370,000(60.1%)Rates andannual charges(% <strong>of</strong> totalincome)$107,285,000(62.1%)Rates andannual charges(% <strong>of</strong> totalincome)$116,231,000(65.4%)Total Incomefrom continuingoperations$137,130,000Total Incomefrom continuingoperations$172,649,000Total Incomefrom continuingoperations$177,723,000Water use (kL) 424,869+# 331,141# 349,030 *HUMAN CAPITALLTIFR 34.5 24.3 24.5<strong>Council</strong>volunteers(TosserSquad)21 52 52NATURAL CAPITALNatural arearestorationBotanicGarden plantdistributionStormwaterreuse (kL)0^ No. <strong>of</strong> sites - 49No. <strong>of</strong> nativesplanted - 20,637m 2 weeded- 153,884No. <strong>of</strong> sites - 49No. <strong>of</strong> nativesplanted -14,594m 2 weeded-180,91345,900 56,206 65,9870^ ~35,000 ~35,000Legend: + These figures do not include the water consumption from the <strong>Wollongong</strong>Surf Leisure Resort, as the premises are not operated by <strong>Wollongong</strong> <strong>City</strong> <strong>Council</strong>;# This data is sourced from Sydney Water Corporation; ^ no restoration orstormwater reuse projects were completed prior to 2002-03; LTIFR - lost time injuryfrequency rate i.e. number <strong>of</strong> lost-time injuries per million hours worked;kL - kilolitres; m 2 - square metres.which form the foundation <strong>of</strong> our society -environment, society and economy. Anotherway <strong>of</strong> considering these three areas is toseparate them based on the resource‘capital’ - built, human and natural.Indicators have been chosen to assist inassessing where <strong>Council</strong> as anorganisation, and the community, areheaded in terms <strong>of</strong> sustainability.For the <strong>Council</strong> indicators, the most positiveresults occur in the natural capital sector(Table 6). The number <strong>of</strong> natural arearestoration projects has increased since2001-02 due to funding from the<strong>Environment</strong> Fund and additional fundingfrom external grants. <strong>Wollongong</strong> BotanicGarden plant distribution has increasedsignificantly (over 43 percent) since 2001-02to provide for increased Greenplan sales,increased plantings at Bushcare sites andadditional natural area restoration projects.Community Indicators showed positivetrends across the built, human and naturalcapital sectors (Table 7). Waterconsumption has continued to decrease,bushcare volunteer hours increased, as didthe number <strong>of</strong> plants purchased by thecommunity as part <strong>of</strong> Greenplan andnumbers <strong>of</strong> native plants installed bybushcare. The amount <strong>of</strong> waste to landfillincreased slightly during <strong>2007</strong>-<strong>08</strong>, but stillremained considerably lower than during2001-02.Sustainable IllawarraDuring <strong>2007</strong>-<strong>08</strong>, substantial planning anddesign <strong>of</strong> the regional three yearSustainable Illawarra project wasundertaken, culminating in a June 20<strong>08</strong>public launch which included a six monthrolling program <strong>of</strong> activities, corporatepartners, a regional ‘super challenge’ forresidents and an interactive website. TheIllawarra Sustainability Roadmap, whichprovides a sustainability planning andreporting framework, was adopted byKiama, Shellharbour and <strong>Wollongong</strong>councils in May 20<strong>08</strong>. The second stage <strong>of</strong>the project is the Sustainability Action Plan.This will outline specific strategies andactions to be considered as part <strong>of</strong> eachcouncil’s planning and reporting processesand operations over the next five years. Thisplan is currently being developed andshould be completed by December 20<strong>08</strong>.Sustainability in the WorkplaceThe Sustainability in the Workplaceprogram aims to improve theenvironmental, social and economic18 <strong>Wollongong</strong> <strong>City</strong> <strong>Council</strong>