A review of greenhouse gas emission factors for fertiliser production.
A review of greenhouse gas emission factors for fertiliser production.
A review of greenhouse gas emission factors for fertiliser production.

Create successful ePaper yourself
Turn your PDF publications into a flip-book with our unique Google optimized e-Paper software.
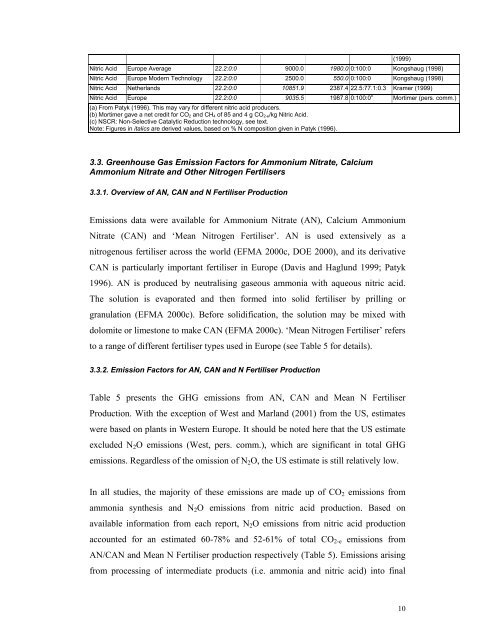
Nitric Acid Europe Average 22.2:0:0 9000.0 1980.0 0:100:0 Kongshaug (1998)Nitric Acid Europe Modern Technology 22.2:0:0 2500.0 550.0 0:100:0 Kongshaug (1998)(1999)Nitric Acid Netherlands 22.2:0:0 10851.9 2387.4 22.5:77.1:0.3 Kramer (1999)Nitric Acid Europe 22.2:0:0 9035.5 1987.8 0:100:0 b Mortimer (pers. comm.)(a) From Patyk (1996). This may vary <strong>for</strong> different nitric acid producers.(b) Mortimer gave a net credit <strong>for</strong> CO 2 and CH 4 <strong>of</strong> 85 and 4 g CO 2-e/kg Nitric Acid.(c) NSCR: Non-Selective Catalytic Reduction technology, see text.Note: Figures in italics are derived values, based on % N composition given in Patyk (1996).3.3. Greenhouse Gas Emission Factors <strong>for</strong> Ammonium Nitrate, CalciumAmmonium Nitrate and Other Nitrogen Fertilisers3.3.1. Overview <strong>of</strong> AN, CAN and N Fertiliser ProductionEmissions data were available <strong>for</strong> Ammonium Nitrate (AN), Calcium AmmoniumNitrate (CAN) and ‘Mean Nitrogen Fertiliser’. AN is used extensively as anitrogenous <strong>fertiliser</strong> across the world (EFMA 2000c, DOE 2000), and its derivativeCAN is particularly important <strong>fertiliser</strong> in Europe (Davis and Haglund 1999; Patyk1996). AN is produced by neutralising <strong>gas</strong>eous ammonia with aqueous nitric acid.The solution is evaporated and then <strong>for</strong>med into solid <strong>fertiliser</strong> by prilling orgranulation (EFMA 2000c). Be<strong>for</strong>e solidification, the solution may be mixed withdolomite or limestone to make CAN (EFMA 2000c). ‘Mean Nitrogen Fertiliser’ refersto a range <strong>of</strong> different <strong>fertiliser</strong> types used in Europe (see Table 5 <strong>for</strong> details).3.3.2. Emission Factors <strong>for</strong> AN, CAN and N Fertiliser ProductionTable 5 presents the GHG <strong>emission</strong>s from AN, CAN and Mean N FertiliserProduction. With the exception <strong>of</strong> West and Marland (2001) from the US, estimateswere based on plants in Western Europe. It should be noted here that the US estimateexcluded N 2 O <strong>emission</strong>s (West, pers. comm.), which are significant in total GHG<strong>emission</strong>s. Regardless <strong>of</strong> the omission <strong>of</strong> N 2 O, the US estimate is still relatively low.In all studies, the majority <strong>of</strong> these <strong>emission</strong>s are made up <strong>of</strong> CO 2 <strong>emission</strong>s fromammonia synthesis and N 2 O <strong>emission</strong>s from nitric acid <strong>production</strong>. Based onavailable in<strong>for</strong>mation from each report, N 2 O <strong>emission</strong>s from nitric acid <strong>production</strong>accounted <strong>for</strong> an estimated 60-78% and 52-61% <strong>of</strong> total CO 2-e <strong>emission</strong>s fromAN/CAN and Mean N Fertiliser <strong>production</strong> respectively (Table 5). Emissions arisingfrom processing <strong>of</strong> intermediate products (i.e. ammonia and nitric acid) into final10