A review of greenhouse gas emission factors for fertiliser production.
A review of greenhouse gas emission factors for fertiliser production.
A review of greenhouse gas emission factors for fertiliser production.

You also want an ePaper? Increase the reach of your titles
YUMPU automatically turns print PDFs into web optimized ePapers that Google loves.
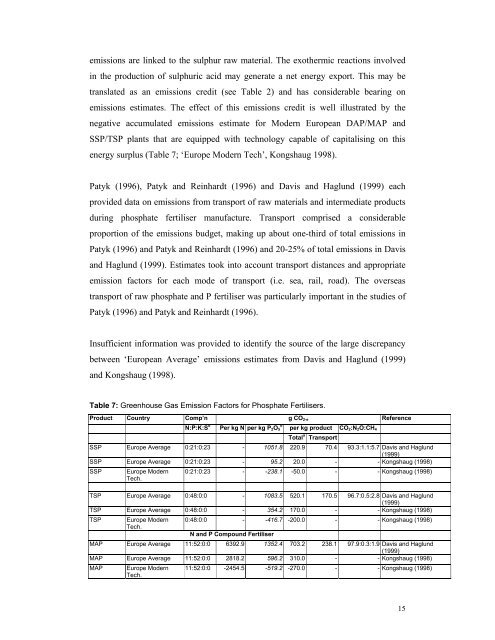
<strong>emission</strong>s are linked to the sulphur raw material. The exothermic reactions involvedin the <strong>production</strong> <strong>of</strong> sulphuric acid may generate a net energy export. This may betranslated as an <strong>emission</strong>s credit (see Table 2) and has considerable bearing on<strong>emission</strong>s estimates. The effect <strong>of</strong> this <strong>emission</strong>s credit is well illustrated by thenegative accumulated <strong>emission</strong>s estimate <strong>for</strong> Modern European DAP/MAP andSSP/TSP plants that are equipped with technology capable <strong>of</strong> capitalising on thisenergy surplus (Table 7; ‘Europe Modern Tech’, Kongshaug 1998).Patyk (1996), Patyk and Reinhardt (1996) and Davis and Haglund (1999) eachprovided data on <strong>emission</strong>s from transport <strong>of</strong> raw materials and intermediate productsduring phosphate <strong>fertiliser</strong> manufacture. Transport comprised a considerableproportion <strong>of</strong> the <strong>emission</strong>s budget, making up about one-third <strong>of</strong> total <strong>emission</strong>s inPatyk (1996) and Patyk and Reinhardt (1996) and 20-25% <strong>of</strong> total <strong>emission</strong>s in Davisand Haglund (1999). Estimates took into account transport distances and appropriate<strong>emission</strong> <strong>factors</strong> <strong>for</strong> each mode <strong>of</strong> transport (i.e. sea, rail, road). The overseastransport <strong>of</strong> raw phosphate and P <strong>fertiliser</strong> was particularly important in the studies <strong>of</strong>Patyk (1996) and Patyk and Reinhardt (1996).Insufficient in<strong>for</strong>mation was provided to identify the source <strong>of</strong> the large discrepancybetween ‘European Average’ <strong>emission</strong>s estimates from Davis and Haglund (1999)and Kongshaug (1998).Table 7: Greenhouse Gas Emission Factors <strong>for</strong> Phosphate Fertilisers.Product Country Comp’n g CO 2-e ReferenceN:P:K:S dPer kg N per kg P 2O 5dper kg product CO 2:N 2O:CH 4Total aTransportSSP Europe Average 0:21:0:23 - 1051.8 220.9 70.4 93.3:1.1:5.7 Davis and Haglund(1999)SSP Europe Average 0:21:0:23 - 95.2 20.0 - - Kongshaug (1998)SSPEurope ModernTech.0:21:0:23 - -238.1 -50.0 - - Kongshaug (1998)TSP Europe Average 0:48:0:0 - 1083.5 520.1 170.5 96.7:0.5:2.8 Davis and Haglund(1999)TSP Europe Average 0:48:0:0 - 354.2 170.0 - - Kongshaug (1998)TSPEurope ModernTech.0:48:0:0 - -416.7 -200.0 - - Kongshaug (1998)N and P Compound FertiliserMAP Europe Average 11:52:0:0 6392.9 1352.4 703.2 238.1 97.9:0.3:1.9 Davis and Haglund(1999)MAP Europe Average 11:52:0:0 2818.2 596.2 310.0 - - Kongshaug (1998)MAPEurope ModernTech.11:52:0:0 -2454.5 -519.2 -270.0 - - Kongshaug (1998)15