A review of greenhouse gas emission factors for fertiliser production.
A review of greenhouse gas emission factors for fertiliser production.
A review of greenhouse gas emission factors for fertiliser production.

You also want an ePaper? Increase the reach of your titles
YUMPU automatically turns print PDFs into web optimized ePapers that Google loves.
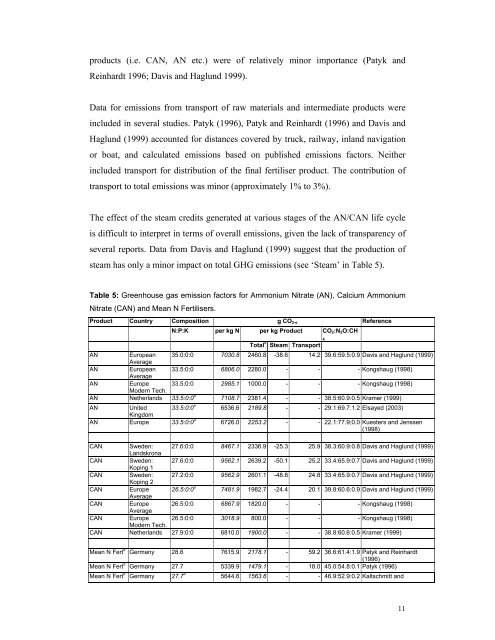
products (i.e. CAN, AN etc.) were <strong>of</strong> relatively minor importance (Patyk andReinhardt 1996; Davis and Haglund 1999).Data <strong>for</strong> <strong>emission</strong>s from transport <strong>of</strong> raw materials and intermediate products wereincluded in several studies. Patyk (1996), Patyk and Reinhardt (1996) and Davis andHaglund (1999) accounted <strong>for</strong> distances covered by truck, railway, inland navigationor boat, and calculated <strong>emission</strong>s based on published <strong>emission</strong>s <strong>factors</strong>. Neitherincluded transport <strong>for</strong> distribution <strong>of</strong> the final <strong>fertiliser</strong> product. The contribution <strong>of</strong>transport to total <strong>emission</strong>s was minor (approximately 1% to 3%).The effect <strong>of</strong> the steam credits generated at various stages <strong>of</strong> the AN/CAN life cycleis difficult to interpret in terms <strong>of</strong> overall <strong>emission</strong>s, given the lack <strong>of</strong> transparency <strong>of</strong>several reports. Data from Davis and Haglund (1999) suggest that the <strong>production</strong> <strong>of</strong>steam has only a minor impact on total GHG <strong>emission</strong>s (see ‘Steam’ in Table 5).Table 5: Greenhouse <strong>gas</strong> <strong>emission</strong> <strong>factors</strong> <strong>for</strong> Ammonium Nitrate (AN), Calcium AmmoniumNitrate (CAN) and Mean N Fertilisers.Product Country Composition g CO 2-e ReferenceN:P:K per kg N per kg Product CO 2:N 2O:CHTotal cSteam TransportANEuropean 35.0:0:0 7030.8 2460.8 -38.6 14.2 39.6:59.5:0.9 Davis and Haglund (1999)AverageANEuropean 33.5:0:0 6806.0 2280.0 - - - Kongshaug (1998)AverageANEurope 33.5:0:0 2985.1 1000.0 - - - Kongshaug (1998)Modern Tech.AN Netherlands 33.5:0:0 a 7108.7 2381.4 - - 38.5:60.9:0.5 Kramer (1999)ANUnited 33.5:0:0 a 6536.6 2189.8 - - 29.1:69.7:1.2 Elsayed (2003)KingdomAN Europe 33.5:0:0 a 6726.0 2253.2 - - 22.1:77.9;0.0 Kuesters and Jenssen(1998)CAN Sweden: 27.6:0:0 8467.1 2336.9 -25.3 25.9 38.3:60.9:0.8 Davis and Haglund (1999)LandskronaCAN Sweden: 27.6:0:0 9562.1 2639.2 -50.1 25.2 33.4:65.9:0.7 Davis and Haglund (1999)Koping 1CAN Sweden: 27.2:0:0 9562.9 2601.1 -48.8 24.8 33.4:65.9:0.7 Davis and Haglund (1999)Koping 2CAN Europe 26.5:0:0 a 7481.9 1982.7 -24.4 20.1 39.8:60.6:0.9 Davis and Haglund (1999)AverageCAN Europe 26.5:0:0 6867.9 1820.0 - - - Kongshaug (1998)AverageCAN Europe 26.5:0:0 3018.9 800.0 - - - Kongshaug (1998)Modern Tech.CAN Netherlands 27.9:0:0 6810.0 1900.0 - - 38.8:60.6:0.5 Kramer (1999)4Mean N Fert d Germany 28.6 7615.9 2178.1 - 59.2 36.6:61.4:1.9 Patyk and Reinhardt(1996)Mean N Fert d Germany 27.7 5339.9 1479.1 - 18.0 45.0:54.8:0.1 Patyk (1996)Mean N Fert d Germany 27.7 b 5644.6 1563.6 - - 46.9:52.9:0.2 Kaltschmitt and11