A review of greenhouse gas emission factors for fertiliser production.
A review of greenhouse gas emission factors for fertiliser production.
A review of greenhouse gas emission factors for fertiliser production.

Create successful ePaper yourself
Turn your PDF publications into a flip-book with our unique Google optimized e-Paper software.
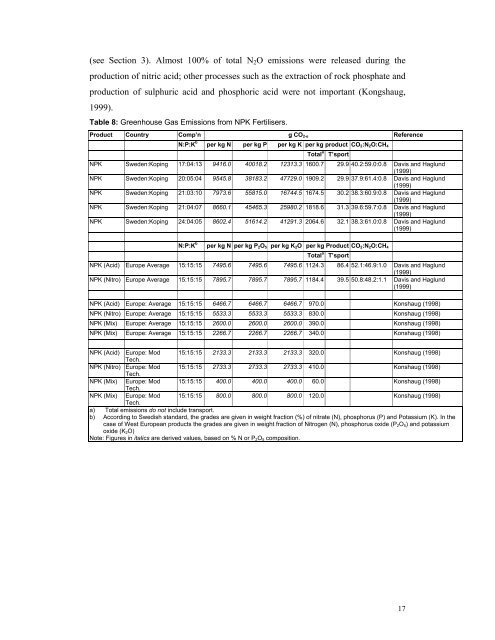
(see Section 3). Almost 100% <strong>of</strong> total N 2 O <strong>emission</strong>s were released during the<strong>production</strong> <strong>of</strong> nitric acid; other processes such as the extraction <strong>of</strong> rock phosphate and<strong>production</strong> <strong>of</strong> sulphuric acid and phosphoric acid were not important (Kongshaug,1999).Table 8: Greenhouse Gas Emissions from NPK Fertilisers.Product Country Comp’n g CO 2-e ReferenceN:P:K b per kg N per kg P per kg K per kg product CO 2:N 2O:CH 4Total aT’sportNPK Sweden:Koping 17:04:13 9416.0 40018.2 12313.3 1600.7 29.9 40.2:59.0:0.8 Davis and Haglund(1999)NPK Sweden:Koping 20:05:04 9545.8 38183.2 47729.0 1909.2 29.9 37.9:61.4:0.8 Davis and Haglund(1999)NPK Sweden:Koping 21:03:10 7973.6 55815.0 16744.5 1674.5 30.2 38.3:60.9:0.8 Davis and Haglund(1999)NPK Sweden:Koping 21:04:07 8660.1 45465.3 25980.2 1818.6 31.3 39.6:59.7:0.8 Davis and Haglund(1999)NPK Sweden:Koping 24:04:05 8602.4 51614.2 41291.3 2064.6 32.1 38.3:61.0:0.8 Davis and Haglund(1999)N:P:K b per kg N per kg P 2O 5 per kg K 2O per kg Product CO 2:N 2O:CH 4Total aT’sportNPK (Acid) Europe Average 15:15:15 7495.6 7495.6 7495.6 1124.3 86.4 52.1:46.9:1.0 Davis and Haglund(1999)NPK (Nitro) Europe Average 15:15:15 7895.7 7895.7 7895.7 1184.4 39.5 50.8:48.2:1.1 Davis and Haglund(1999)NPK (Acid) Europe: Average 15:15:15 6466.7 6466.7 6466.7 970.0 Konshaug (1998)NPK (Nitro) Europe: Average 15:15:15 5533.3 5533.3 5533.3 830.0 Konshaug (1998)NPK (Mix) Europe: Average 15:15:15 2600.0 2600.0 2600.0 390.0 Konshaug (1998)NPK (Mix) Europe: Average 15:15:15 2266.7 2266.7 2266.7 340.0 Konshaug (1998)NPK (Acid) Europe: Mod 15:15:15 2133.3 2133.3 2133.3 320.0 Konshaug (1998)Tech.NPK (Nitro) Europe: Mod 15:15:15 2733.3 2733.3 2733.3 410.0 Konshaug (1998)Tech.NPK (Mix) Europe: Mod 15:15:15 400.0 400.0 400.0 60.0 Konshaug (1998)Tech.NPK (Mix) Europe: Mod 15:15:15 800.0 800.0 800.0 120.0 Konshaug (1998)Tech.a) Total <strong>emission</strong>s do not include transport.b) According to Swedish standard, the grades are given in weight fraction (%) <strong>of</strong> nitrate (N), phosphorus (P) and Potassium (K). In thecase <strong>of</strong> West European products the grades are given in weight fraction <strong>of</strong> Nitrogen (N), phosphorus oxide (P 2O 5) and potassiumoxide (K 2O)Note: Figures in italics are derived values, based on % N or P 2O 5 composition.17