CONTROL PREMIUM STUDY 1ST QUARTER 2012 - BVMarketData
CONTROL PREMIUM STUDY 1ST QUARTER 2012 - BVMarketData
CONTROL PREMIUM STUDY 1ST QUARTER 2012 - BVMarketData
- No tags were found...

You also want an ePaper? Increase the reach of your titles
YUMPU automatically turns print PDFs into web optimized ePapers that Google loves.
<strong>CONTROL</strong> <strong>PREMIUM</strong> <strong>STUDY</strong><strong>1ST</strong> <strong>QUARTER</strong> <strong>2012</strong>One Gateway Center, Suite 220Newark, NJ 07102(973) 849-2420www.mergerstat.com
Copyright © <strong>2012</strong>, FactSet Mergerstat, LLC. All rights reserved. Subscription: Contact Business Valuation Resources at(888) 287-8258. For additional information about Mergerstat or our services, please visit our web site atwww.mergerstat.com. It is illegal under Federal copyright law to reproduce this publication or any portion of its contentswithout the publisher’s permission. Media: Media quotation with source attribution is encouraged. Reporters requestingadditional information or editorial comment should contact Tayo Olatoyan at (973) 849-2420. Mergerstat gathers its datafrom sources it considers reliable; however, it does not guarantee the accuracy or completeness of the information providedwithin this publication.
Mergerstat Control Premium Study1st Quarter <strong>2012</strong>Table of ContentsPageAbout the Control Premium Study .........................................................................................iiControl Premium Analytics ...................................................................................................... 1Control Premium Comparative Results .................................................................................. 212-Month Median Premiums by Industry .............................................................................. 3Premiums vs. S&P 500 Index ................................................................................................... 41st Quarter <strong>2012</strong> Summary Statistics ...................................................................................... 512-Month Summary Figures .................................................................................................... 5Control Premiums by Industry ................................................................................................ 6Transaction InformationTarget Name and SIC Number (Domestic)........................................................................... 27Target Name and SIC Number (International) .................................................................... 29Announce & Closing Dates, Total Deal Value (Domestic) ................................................. 32Announce & Closing Dates, Total Deal Value (International) ............................................ 34Purchase Price/Share – Mergerstat Unaffected Price (Domestic)......................................... 37Purchase Price/Share – Mergerstat Unaffected Price (International) .................................. 39Mergerstat Unaffected Control Premium (Domestic)........................................................... 42Mergerstat Unaffected Control Premium (International) ..................................................... 44Target Financials (Domestic)................................................................................................ 47Target Financials (International)........................................................................................... 49Target Multiples (Domestic)................................................................................................. 52Target Multiples (International)............................................................................................ 54Target Demographics (Domestic) ........................................................................................ 57Target Demographics (International) ................................................................................... 59Company DescriptionsDomestic .............................................................................................................................. 63International ......................................................................................................................... 65Standard Industry Classification (SIC) Summary ................................................................ 70Description of Terms ................................................................................................................ 72Copyright © <strong>2012</strong>, FactSet Mergerstat, LLC. All rights reserved.i
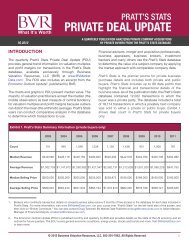
Mergerstat Control Premium Study1st Quarter <strong>2012</strong>About The Control Premium StudyA control premium is defined as the additional consideration that an investor would pay over a marketableminority equity value (i.e., current, publicly traded stock prices) in order to own a controlling interest in thecommon stock of a company. In this study, the premium is expressed as a percentage of the unaffected marketableminority price per share or the “Mergerstat Unaffected Price.” This is the price just prior to the point of changein the representative normal pricing of a given security.Mergerstat examines transactions whereby 50.01 percent or more of a company was acquired. A controllinginterest is considered to have greater value than a minority interest because of the purchaser’s ability to effectchanges in the overall business structure and to influence business policies. Control premiums can vary greatly.Factors affecting the magnitude of a given control premium include:• The nature and magnitude of nonoperating assets.• The nature and magnitude of discretionary expenses.• The perceived quality of existing management.• The nature and magnitude of business opportunities which are not currently being exploited.• The ability to integrate the acquiree into the acquirer’s business or distribution channels.In order to obtain unbiased and accurate pricing information, the scope of this study has been narrowed tocompleted transactions where the target company was publicly traded. For domestic transactions, Premiumsranged from -77.1% for GreenHouse Holdings, Inc. to 193.6% for Mainline Bancorp, Inc.. For internationaltransactions, Premiums ranged from -99.9% for Ace & Partners Corp. to 332.1% for Dhir India Investments PLC.Mergerstat does not include negative premiums in calculating average and median statistics. If negative premiumshad been included in the calculations for the 1st Quarter <strong>2012</strong>, the results would have been as follows:Including Negative PremiumsExcluding Negative Premiums# of Deals Premium # of Deals PremiumDomestic Average 43 48.4% 38 57.7%Domestic Median 43 45.8% 38 51.4%International Average 89 -1.8% 40 98.4%International Median 89 -60.0% 40 66.2%Overall Average 132 14.6% 78 78.6%Overall Median 132 23.5% 78 55.2%Throughout the Control Premium Study, negative premiums are indicated by an “*” for your reference.Tayo OlatoyanContent Manager(973) 849-2420tolatoyan@factset.comCopyright © <strong>2012</strong>, FactSet Mergerstat, LLC. All rights reserved.ii
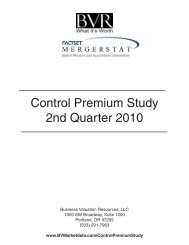
Mergerstat Control Premium Study1st Quarter <strong>2012</strong>Control Premium Analytics *OverallPremium120%# of Deals Average MedianDeals240100%20080%16060%12040%8020%400%1Q07 2Q07 3Q07 4Q07 1Q08 2Q08 3Q08 4Q08 1Q09 2Q09 3Q09 4Q09 1Q10 2Q10 3Q10 4Q10 1Q11 2Q11 3Q11 4Q11 1Q120DomesticInternational80% PremiumDeals20070%PremiumDeals14070%17560%12060%50%40%30%20%150125100755050%40%30%20%10080604010%2510%200%1Q10 2Q10# of3Q10Deals4Q10 1Q11Average2Q11 3Q11 4Q11Median1Q1200%1Q10 2Q10# of 3Q10 Deals 4Q10 1Q11 Average 2Q11 3Q11 4Q11 Median 1Q1201Q12Latest Twelve MonthsInternational57%International57%Domestic43%Domestic43%* Average and median calculations exclude negative premiumsCopyright © <strong>2012</strong>, FactSet Mergerstat, LLC. All rights reserved. 1
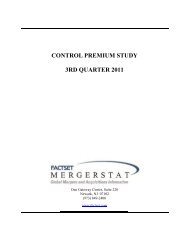
Mergerstat Control Premium Study1st Quarter <strong>2012</strong>Control Premium Study Results *ControlPremiumMERGERSTAT<strong>CONTROL</strong> <strong>PREMIUM</strong> <strong>STUDY</strong>COMPARATIVE RESULTS45% 12-Month Median 3-Month Median Transactions40%35%30%25%20%15%10%5%0%1Q09 2Q09 3Q09 4Q09 1Q10 2Q10 3Q10 4Q10 1Q11 2Q11 3Q11 4Q11 1Q1212-Month Median 34% 38% 41% 44% 41% 38% 36% 36% 35% 34% 35% 35% 38%3-Month Median 45% 56% 41% 38% 40% 32% 34% 39% 34% 31% 35% 45% 55%Transactions 100 95 124 128 92 106 134 177 145 186 152 139 132Percentages are rounded.* Median calculations excludes negative premiumsCopyright © <strong>2012</strong>, FactSet Mergerstat, LLC. All rights reserved. 2
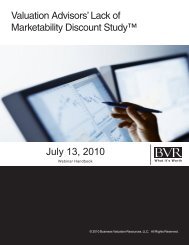
Mergerstat Control Premium Study1st Quarter <strong>2012</strong>12-Month Median Premiums by Industry*MERGERSTAT<strong>CONTROL</strong> <strong>PREMIUM</strong> <strong>STUDY</strong>12-MONTH MEDIAN <strong>PREMIUM</strong>S BY INDUSTRY60%40%20%0%Agri Mining Const Mfg Trans CommElec &GasWhsle Retail Fin Svs ServicesMedian Premium 295% 40% 22% 42% 51% 24% 10% 42% 38% 31% 40%No. of Transactions 3 65 10 197 14 10 14 24 27 106 138For the 12 months ended Mar. 31, <strong>2012</strong>.<strong>2012</strong> 2011 2010Quarter3-MonthMedianPremiumNo. ofTrans.12-MonthMedianPremium3-MonthMedianPremiumNo. ofTrans.12-MonthMedianPremium3-MonthMedianPremiumNo. ofTrans.12-MonthMedianPremiumFirst 55.2% 132 37.8% 34.1% 145 34.7% 39.6% 92 40.8%Second 30.9% 186 33.8% 32.4% 106 37.9%Third 35.5% 152 34.8% 33.7% 134 35.8%Fourth 45.0% 139 35.1% 38.9% 177 36.0%The 12-month median premiums were gathered from transactions occurring within a trailing 12-month period, whereas the 3-month medianpremiums represent similar analyses for a 3-month period.* Median calculations excludes negative premiums.Copyright © <strong>2012</strong>, FactSet Mergerstat, LLC. All rights reserved. 3
Mergerstat Control Premium Study1st Quarter <strong>2012</strong>Summary Statistics<strong>1ST</strong> <strong>QUARTER</strong> <strong>2012</strong>Domestic TransactionsNumber of Transactions 43Range -77.1% to 193.6%Median* 51.4%Average* 57.7%International TransactionsNumber of Transactions 89Range -99.9% to 332.1%Median* 66.2%Average* 98.4%Domestic and International TransactionsNumber of Transactions 132Range -99.9% to 332.1%Median* 55.2%Average* 78.6%12-MONTH SUMMARY FIGURES (04/01/11 TO 03/31/12)Number of Transactions 608Range -99.9% to 835.1%Median* 37.8%Average* 59.2%* Excludes negative premiums.Copyright © <strong>2012</strong>, FactSet Mergerstat, LLC. All rights reserved. 5
Mergerstat Control Premium Study1st Quarter <strong>2012</strong>Control Premiums by Industry – Trailing 12 MonthsSIC Target Closing Mergerstat UnaffectedCode Category Date Target Name Control Premium01-09 Agriculture and Forestry10-14 MiningRange = 295.0% to 295.0% Median = 295.0% Average = 295.0%0133 10/03/11 Nissin Sugar Manufacturing Co., Ltd. -7.6%*0179 09/16/11 Vaughan Foods, Inc. 295.0%0252 03/29/12 TPC Plus Bhd. -60.0%*Range = 0.9% to 203.0% Median = 39.9% Average = 45.1%10 Metal MiningRange = 0.9% to 203.0% Median = 33.6% Average = 47.6%1011 10/06/11 FerrAus Ltd. 0.9%1011 08/12/11 Territory Resources Ltd. 203.0%1011 05/12/11 Consolidated Thompson Iron Mines Ltd. 30.5%1021 02/17/12 Anvil Mining Ltd. 47.9%1021 06/17/11 Far West Mining Ltd. -12.8%*1021 04/13/11 Stuart Petroleum Ltd. 50.0%1041 03/28/12 Signature Metals Ltd. 92.3%1041 02/24/12 European Goldfields Ltd. 6.7%1041 02/09/12 Crocodile Gold Corp. 83.5%1041 01/24/12 Minera Andes, Inc. 10.0%1041 12/19/11 Gold One International Ltd. 27.9%1041 10/26/11 Northgate Minerals Corp. 13.7%1041 10/20/11 Century Mining Corp. -53.9%*1041 10/06/11 Crescent Gold Ltd. 4.0%1041 08/16/11 Goldstone Resources, Inc. 50.3%1041 06/27/11 Simmer & Jack Mines Ltd. -26.6%*1041 06/13/11 Medoro Resources Ltd. 36.7%1041 06/10/11 Jabiru Metals Ltd. 13.8%1041 05/19/11 Anchor Resources Ltd. 90.6%1041 04/19/11 Aragon Resources Ltd. 27.7%1041 04/08/11 Capital Gold Corp. 68.1%* Not used in range, average and median calculations.Copyright © <strong>2012</strong>, FactSet Mergerstat, LLC. All rights reserved. 6
Mergerstat Control Premium Study1st Quarter <strong>2012</strong>12 Coal MiningRange = 10.7% to 90.5% Median = 37.2% Average = 43.2%1221 06/28/11 PT Bumi Resources Tbk 10.7%1221 06/01/11 Alpha Appalachia Holdings, Inc. 41.0%1222 03/27/12 Optimum Coal Holdings Ltd. -85.1%*1222 12/20/11 Macarthur Coal Ltd. 48.4%1222 11/07/11 Hunnu Coal Ltd. 30.0%1222 09/29/11 Northern Energy Corp. Ltd. 90.5%1222 08/26/11 Caledon Resources PLC 33.3%1222 06/17/11 Tata Steel Ltd. (Riversdale Mining Ltd.) 17.0%1222 04/01/11 Western Coal Corp. 55.8%1241 03/01/12 Grande Cache Coal Corp. 72.7%1241 06/15/11 International Coal Group, Inc. 32.4%13 Oil and Gas ExtractionRange = 5.8% to 119.6% Median = 39.9% Average = 44.1%1311 03/23/12 Bellamont Exploration Ltd. 8.6%1311 03/15/12 Wild Stream Exploration, Inc. -20.3%*1311 01/09/12 Emerge Oil & Gas, Inc. 39.9%1311 12/20/11 American Eagle Energy, Inc. -47.7%*1311 12/08/11 Brigham Exploration Co. 20.2%1311 11/16/11 Alpetro Resources Ltd. 85.7%1311 10/17/11 China Liandi Energy Resources Engineering 91.6%Technology Ltd. (LianDi Clean Technology,Inc.)1311 08/26/11 Petrohawk Energy Corp. 61.9%1311 08/04/11 Torque Energy, Inc. 56.3%1311 06/02/11 Sharon Energy Ltd. 0.0% *1311 06/01/11 Spartan Exploration Ltd. -29.2%*1311 05/03/11 NuLoch Resources, Inc. 15.9%1311 04/13/11 NGAS Resources, Inc. 55.6%1311 04/12/11 Cirrus Energy Corp. 7.5%1381 12/23/11 Daylight Energy Ltd. 119.6%1381 10/04/11 Aker Capital AS (Aker Drilling ASA) 98.5%1381 07/12/11 Cinch Energy Corp. 64.0%1381 06/11/11 Ember Resources, Inc. 11.1%1381 06/10/11 Peak Energy Services Ltd. 28.4%1381 06/10/11 Stoneham Drilling Trust 40.5%1381 06/07/11 Bronco Drilling Co., Inc. 5.8%1381 05/31/11 Pride International, Inc. 20.4%1381 05/31/11 ProspEx Resources Ltd. 17.1%1381 05/31/11 Technicoil Corp. -12.4%*1381 04/14/11 Petro Uno Resources Ltd. -9.0%*1382 02/07/12 Complete Production Services, Inc. 76.7%Copyright © <strong>2012</strong>, FactSet Mergerstat, LLC. All rights reserved. 7
Mergerstat Control Premium Study1st Quarter <strong>2012</strong>1382 12/22/11 Adelaide Energy Ltd. 42.9%13 Oil and Gas Extraction (continued)1382 12/01/11 Encore Energy Partners LP -14.3%*1382 07/28/11 Culane Energy Corp. 35.7%1382 06/30/11 Sprott Resource Corp. (Orion Oil & Gas Corp.) -18.1%*1389 08/03/11 KS Energy Ltd. 10.9%14 Mining and Quarrying of Nonmetallic Minerals, Except Fuels1411 08/31/11 Dundee Corp. (Breakwater Resources Ltd.) 44.2%1499 07/19/11 Equinox Minerals Ltd. 42.7%15-17 ConstructionRange = 0.0% to 74.4% Median = 22.2% Average = 28.6%15 Building ConstructionRange = 0.0% to 15.6% Median = 7.8% Average = 7.8%1521 03/12/12 TR Shoji YK (Yasuragi Co., Ltd.) -97.9%*1521 03/05/12 GreenHouse Holdings, Inc. -77.1%*1522 09/08/11 Forever Prosperous Pte Ltd. (PT Royal Oak0.0%Development Asia Tbk)1531 03/12/12 MARUSEI Co., Ltd. -98.3%*1542 08/18/11 Sunway Holdings Bhd. 15.6%16 Heavy ConstructionRange = 2.6% to 55.3% Median = 22.2% Average = 26.7%1611 10/05/11 ConnectEast Group 22.2%1629 12/01/11 Global Industries Ltd. 55.3%1629 11/11/11 CPB Equity Co. Ltd. (Christiani & NielsenThailand Public Co. Ltd.)2.6%17 Construction - Special Trade Contractors1711 04/21/11 Eaga PLC 30.4%1731 07/05/11 EnergyConnect Group, Inc. 74.4%Copyright © <strong>2012</strong>, FactSet Mergerstat, LLC. All rights reserved. 8
Mergerstat Control Premium Study1st Quarter <strong>2012</strong>20-39 ManufacturingRange = 0.0% to 835.1% Median = 42.3% Average = 67.4%20 Food and Kindred ProductsRange = 1.3% to 162.3% Median = 51.6% Average = 60.0%2023 07/08/11 Parmalat SpA 12.5%2026 03/20/12 Alaska Milk Corp. -96.5%*2032 06/20/11 Cofigéo SA 1.3%2037 08/19/11 Charlie's Group Ltd. 57.1%2038 05/20/11 Brossard SA 82.6%2051 05/25/11 Tasty Baking Co. 148.4%2061 03/16/12 MSF Sugar Ltd. 30.9%2062 02/01/12 Société Vermandoise de Sucreries SA 162.3%2064 09/07/11 Government of Serbia (Paracinka AD) 53.2%2075 02/09/12 Solbar Industries Ltd. -42.2%*2076 07/06/11 Frankland River Olive Co. Ltd. 50.0%2079 12/15/11 Blazito Ltd. (Elstar Oil SA) 89.0%2085 05/13/11 Pioneer Distilleries Ltd. 53.5%2086 10/19/11 PepsiCo, Inc. / SS National Logistics Co. Ltd. -6.1%*(Serm Suk Public Co. Ltd.)2086 06/01/11 Grupo Continental, SAB 19.6%2087 12/21/11 M&F Worldwide Corp. 47.4%2099 05/16/11 Danisco A/S 32.1%22 Textile Mill ProductsRange = 9.7% to 14.3% Median = 12.0% Average = 12.0%2221 08/01/11 Kawashima Selkon Textiles Co., Ltd. 14.3%2231 11/23/11 Bombay Rayon Fashions Ltd. 9.7%2297 05/11/11 Finta Technologies SA (Tharreau Industries SA) -9.1%*23 ApparelRange = 3.4% to 166.4% Median = 24.2% Average = 49.5%2326 02/01/12 Cosalt PLC -61.3%*2326 05/05/11 Greatwood Investment Trading Ltd. / Respected 3.4%International Ltd. (Carry Wealth HoldingsLtd.)2329 02/16/12 Hang Ten Group Holdings Ltd. -79.5%*2331 06/30/11 Gruppo Coin SpA -3.9%*2331 06/01/11 Sanei-International Co., Ltd. 10.1%2335 02/27/12 Jacques Vert PLC 166.4%2335 06/24/11 Volcom, Inc. 24.2%2389 09/13/11 Timberland Co. 43.4%Copyright © <strong>2012</strong>, FactSet Mergerstat, LLC. All rights reserved. 9
Mergerstat Control Premium Study1st Quarter <strong>2012</strong>2389 08/01/11 Orient Garments Ltd. -37.0% *24-26 Lumber, Furniture and PaperRange = 12.0% to 151.1% Median = 37.4% Average = 49.6%2411 06/29/11 TimberWest Forest Corp. 19.5%2435 10/01/11 Hivic Co., Ltd. 69.6%2448 04/01/11 IFCO Systems NV 20.0%2512 01/20/12 Peasedow Enterprises Ltd. (Chinlink International 151.1%Holdings Ltd.)2519 06/10/11 Hero Talent Investments Ltd. / Excel Strength -26.5%*Investments Ltd. / Willhero Investments Ltd.(JF Household Furnishings Ltd.)2631 02/13/12 Temple-Inland, Inc. 37.6%2653 08/10/11 HPI Resources Bhd. 12.0%2653 05/27/11 Smurfit-Stone Container Corp. 49.4%2656 10/19/11 Watanabe Kosan KK (Chuo Kagaku Co., Ltd.) -1.0%*2671 10/19/11 PannErgy Nyrt (Pannunion Kft) -18.2%*2676 03/09/12 Asia Square Holdings Ltd. (Newtree Group -91.9%*Holdings Ltd.)2678 09/28/11 Camlin Ltd. 37.2%27 Printing, Publishing and Allied Industries2721 07/13/11 KKR & Co. LP (PRIMEDIA, Inc.) 62.1%2721 05/20/11 Independent Media Distribution Ltd. 13.8%28 Chemicals and Allied ProductsRange = 3.7% to 500.0% Median = 50.0% Average = 87.8%2812 06/16/11 Silvinit JSC 23.6%2819 09/13/11 Rhodia SA 50.0%2819 04/26/11 JPMorgan Chase & Co., Inc. (Süd-Chemie AG) -4.0%*2821 01/31/12 CPB Equity Co. Ltd. (Thai Plastic & Chemicals -96.6%*Public Co. Ltd.)2821 10/20/11 Arch Chemicals, Inc. 11.9%2821 09/08/11 Blackstone Group LP (Graham Packaging Co., 52.6%Inc.)2821 09/07/11 Nippon Kagaku Yakin Co., Ltd. 42.9%2833 10/14/11 Foshan Overseas Investment Ltd. (Winteam -0.4%*Pharmaceutical Group Ltd.)2833 10/07/11 Natunola Health Biosciences, Inc. 179.4%2834 02/13/12 Inhibitex, Inc. 163.4%2834 02/10/12 Omega Pharma NV 48.5%2834 01/17/12 Pharmasset, Inc. 88.5%2834 12/12/11 Adolor Corp. 121.4%2834 10/27/11 Icagen, Inc. 150.0%2834 10/14/11 Cephalon, Inc. 41.6%Copyright © <strong>2012</strong>, FactSet Mergerstat, LLC. All rights reserved. 10
Mergerstat Control Premium Study1st Quarter <strong>2012</strong>2834 10/11/11 Novagali Pharma SA 71.3%28 Chemicals and Allied Products (continued)2834 08/19/11 AB Invalda / Baltic Pharma Ltd. (Sanitas AB) 83.4%2834 08/10/11 Solvay SA (Solvay Pharma India Ltd.) -17.6%*2834 06/14/11 ChemGenex Pharmaceuticals Ltd. 59.1%2834 05/23/11 IS Pharma PLC 3.7%2834 05/16/11 Warburg Pincus & Co. (Inspire Pharmaceuticals, 25.6%Inc.)2834 04/08/11 Genzyme Corp. 36.6%2834 04/05/11 CPEX Pharmaceuticals, Inc. 11.0%2835 08/19/11 Immucor, Inc. 30.2%2836 03/07/12 Micromet, Inc. 32.9%2836 10/07/11 Labopharm, Inc. 68.2%2836 08/10/11 Cellestis Ltd. 26.7%2836 06/01/11 Talecris Biotherapeutics Holdings Corp. 102.5%2841 08/22/11 Henkel AG & Co. KGaA (Henkel India Ltd.) -52.9%*2844 11/15/11 Sun East Group Ltd. 500.0%2844 10/14/11 Maesa SA 44.0%2844 05/10/11 Alberto-Culver Co. 19.1%2851 03/28/12 SSCP Co., Ltd. (Schramm Holding AG) 249.6%2851 03/28/12 SSCP Co., Ltd. (Schramm Holding AG) 249.6%2851 01/26/12 Tricolor SA -99.1%*2865 10/19/11 PTT Aromatics & Refining Public Co. Ltd. -31.2%*2879 12/07/11 Sabero Organics Gujarat Ltd. 97.7%2899 12/01/11 Nalco Holding Co. 35.9%29 Petroleum RefiningRange = 18.7% to 63.4% Median = 28.0% Average = 36.7%2911 03/30/12 Exxon Mobil Corp. (Esso Malaysia Bhd.) -73.7%*2911 08/09/11 M. D. Sass Investors Services, Inc. (Sterling 63.4%Chemicals, Inc.)2911 07/01/11 Frontier Oil Corp. 18.7%2992 09/16/11 The Lubrizol Corp. 28.0%30 Rubber and Miscellaneous Plastics ProductsRange = 28.4% to 45.0% Median = 36.7% Average = 36.7%3069 06/24/11 Sinomem Technology Ltd. 28.4%3081 11/28/11 Southwall Technologies, Inc. 45.0%3084 05/30/11 Future Advance Holdings Ltd (China Primary -65.2%*Resources Holdings Ltd)3084 04/25/11 Xinjiang Tianye Water Saving Irrigation SystemCo. Ltd.-36.6%*Copyright © <strong>2012</strong>, FactSet Mergerstat, LLC. All rights reserved. 11
Mergerstat Control Premium Study1st Quarter <strong>2012</strong>31 Leather and Leather ProductsRange = 25.0% to 29.7% Median = 27.3% Average = 27.3%3161 09/06/11 Safari Industries (India) Ltd. 29.7%3161 05/17/11 D&P PME IV SAS / Saint Germain Participation 25.0%SARL / Financière Descottes SARL (LeTanneur & Cie)3199 05/23/11 Jackspeed Corp. Ltd. -1.9%*32-33 Stone, Concrete Products and Primary MetalsRange = 28.3% to 308.2% Median = 61.3% Average = 114.8%3241 03/09/12 YTL Cement Bhd. -87.5%*3253 06/06/11 PT Keramika Indonesia Assosiasi Tbk -1.2%*3272 10/05/11 Ameron International Corp. 28.3%3312 10/25/11 Thainox Stainless Public Co. Ltd. 69.2%3313 07/29/11 MagIndustries Corp. 53.4%3317 03/30/12 Lakeside Steel, Inc. 308.2%34-35 Fabricated Metal Products, Industrial Machinery and ComputersRange = 0.7% to 144.6% Median = 43.7% Average = 57.6%3432 05/06/11 Crane Group Ltd. 41.1%3433 11/09/11 EDF Energies Nouvelles SA (Supra SA) -37.6%*3462 01/23/12 Sanjo Machine Works Ltd. -97.0%*3469 05/31/11 Lincat Group PLC 37.7%3469 05/16/11 MAP Technology Holdings Ltd. 30.9%3479 11/21/11 First Prospect Holdings Ltd. (Noble Jewelry 71.9%Holdings Ltd.)3499 03/16/12 RuggedCom, Inc. 144.6%3511 11/16/11 Ecofin Ltd. / Suzlon Energy Ltd. (Hansen121.9%Transmissions International NV)3511 06/17/11 SunPower Corp. 46.2%3523 01/20/12 Kverneland ASA -69.7%*3531 11/09/11 MAN SE 0.7%3531 08/16/11 Demag Cranes AG 53.5%3532 07/08/11 Bucyrus International, Inc. 32.1%3545 05/20/11 Winterthur Technologie AG 6.9%3549 03/12/12 ADTEC Engineering Co., Ltd. -98.4%*3552 02/21/12 Alcide Ltd. (Uster Technologies AG) 26.4%3555 03/20/12 Baldwin Technology Co., Inc. 104.3%3555 12/20/11 Mars Engineering Corp. (Showa Information 90.5%Systems Ltd.)3559 11/17/11 Asia Environment Holdings Ltd. 33.3%3559 10/19/11 IHI Corp. / Effissimo Capital Management Pte 103.9%Copyright © <strong>2012</strong>, FactSet Mergerstat, LLC. All rights reserved. 12
Mergerstat Control Premium Study1st Quarter <strong>2012</strong>Ltd. (New Tachikawa Aircraft Co., Ltd.)34-35 Fabricated Metal Products, Industrial Machinery and Computers(continued)3559 08/22/11 Gerber Scientific, Inc. 35.5%3571 08/04/11 Hypercom Corp. 126.1%3571 05/20/11 Shenzhen Languang Electronic Group Co. Ltd. -54.6%*(Gansu Languang Science & Technology Co.Ltd.)3577 02/15/12 Blue Coat Systems, Inc. 47.7%3577 10/01/11 Ralink Technology Corp. 10.5%3577 09/26/11 silex technology, Inc. 73.1%3578 08/24/11 Radiant Systems, Inc. 27.6%36 Electrical and Electronic Machinery and EquipmentRange = 0.0% to 702.1% Median = 38.4% Average = 66.5%3612 02/28/12 Newave Energy Holding SA 36.4%3613 03/30/12 SMB United Ltd. 15.6%3613 01/17/12 Energy Support Corp. -97.2%*3613 05/16/11 Technology Research Corp. 84.6%3621 11/03/11 Harbin Electric, Inc. 702.1%3621 08/26/11 Tognum AG 40.5%3625 08/04/11 elexis AG 20.6%3631 10/14/11 Sigdo Koppers SA (Cia Tecno Industrial SA) 11.9%3631 09/01/11 Tong Yang Magic Co., Ltd. 31.1%3632 12/21/11 KJK Fund SICAV-SIF (Snaige AB) 314.9%3633 09/09/11 Paradise Capital Holding Co. (Olympic Group for 35.1%Financial Investments Co.)3633 07/27/11 Schulthess Group AG 28.9%3639 10/14/11 Sociedad Manufacturera de Electroartefactos SA 0.0%3661 05/31/11 XETA Technologies, Inc. 43.2%3661 05/10/11 Tollgrade Communications, Inc. 0.2%3663 01/13/12 Ace & Partners Corp. -99.9%*3663 09/16/11 China Security & Surveillance Technology, Inc. 33.2%3663 09/12/11 Maspro Denkoh Corp. 63.4%3663 08/22/11 EMS Technologies, Inc. 33.1%3663 06/17/11 Endwave Corp. -2.7%*3669 01/27/12 Tekelec 11.1%3669 06/16/11 RAE Systems, Inc. 116.3%3669 05/31/11 AML Communications, Inc. 78.6%3672 11/22/11 Circuit Systems (India) Ltd. 5.5%3674 03/20/12 Gennum Corp. 121.8%3674 02/17/12 Netlogic Microsystems, Inc. 56.7%3674 01/10/12 Advanced Analogic Technologies, Inc. 51.0%3674 11/10/11 Varian Semiconductor Equipment Associates, Inc. 55.4%3674 11/07/11 Caliper Life Sciences, Inc. 42.1%3674 10/26/11 Zarlink Semiconductor, Inc. 57.9%Copyright © <strong>2012</strong>, FactSet Mergerstat, LLC. All rights reserved. 13
Mergerstat Control Premium Study1st Quarter <strong>2012</strong>3674 09/23/11 National Semiconductor Corp. 75.7%36 Electrical and Electronic Machinery and Equipment (continued)3674 09/20/11 Zuken, Inc. / Kenny B YK (Chip One Stop, Inc.) 175.3%3674 08/31/11 Zoran Corp. -10.2%*3674 08/29/11 SMART Modular Technologies (WWH), Inc. 13.1%3674 07/05/11 Ignis ASA 58.4%3674 07/04/11 Verigy Ltd. 68.4%3674 06/28/11 LaBarge, Inc. 10.4%3674 05/24/11 Qualcomm Atheros, Inc. 21.6%3674 04/19/11 Conexant Systems, Inc. 27.0%3679 01/24/12 Valpey Fisher Corp. 62.7%3679 01/17/12 Novitus SA 35.2%3679 12/23/11 MOSAID Technologies, Inc. 46.0%3679 10/07/11 Inventec Appliances Corp. -3.5%*3679 08/16/11 ElektronikGruppen BK AB 31.0%3679 06/21/11 PCI Ltd. 4.2%3679 06/01/11 Spectrum Control, Inc. 42.8%3679 05/27/11 APW President Systems Ltd. 30.0%37 Transportation EquipmentRange = 23.9% to 90.6% Median = 40.5% Average = 48.8%3711 03/22/12 Aichi Machine Industry Co., Ltd. -98.0%*3711 03/16/12 Khazanah Nasional Bhd. (Proton Holdings Bhd.) -60.0%*3711 01/03/12 Hirotako Holdings Bhd. -65.0%*3714 02/03/12 Ripplewood Investments LLC (Asahi Tec Corp.) -98.7%*3714 05/16/11 ICWET LP / Industrie-Beteiligungs-Gesellschaft 49.8%mbH (W.E.T. Automotive Systems AG)3724 05/09/11 Ladish Co., Inc. 90.6%3732 12/20/11 Force Protection, Inc. 31.1%3743 09/07/11 Delachaux SA 23.9%38 Controlling Instruments; Photographic, Medical and Optical Goods; and ClocksRange = 6.2% to 75.4% Median = 37.7% Average = 33.0%3812 08/31/11 ECT Industries SA 44.8%3821 10/28/11 Axis-Shield PLC 46.2%3821 06/30/11 Beckman Coulter, Inc. 11.1%3826 05/17/11 Dionex Corp. 20.7%3826 04/13/11 Clinical Data, Inc. -11.5%*3841 02/14/12 Synovis Life Technologies, Inc. 51.8%3841 09/13/11 Moria SA 13.4%3841 06/27/11 Orthovita, Inc. 41.0%3841 06/17/11 American Medical Systems Holdings, Inc. 34.3%3841 05/17/11 CardioGenesis Corp. 42.8%3845 03/29/12 SonoSite, Inc. 75.4%Copyright © <strong>2012</strong>, FactSet Mergerstat, LLC. All rights reserved. 14
Mergerstat Control Premium Study1st Quarter <strong>2012</strong>3845 12/22/11 American Medical Alert Corp. 42.5%38 Controlling Instruments; Photographic, Medical and Optical Goods; andClocks (continued)3845 11/04/11 Kinetic Concepts, Inc. 6.2%3845 08/05/11 Ophthalmic Imaging Systems, Inc. 13.2%3845 06/13/11 Wisconsin Alumni Research Foundation(TomoTherapy, Inc.)19.0%39 Miscellaneous ManufacturingRange = 27.2% to 835.1% Median = 72.8% Average = 311.7%3911 06/30/11 Bulgari SpA 72.8%3944 04/29/11 RC2 Corp. 27.2%3999 11/04/11 China Fire & Security Group, Inc. 835.1%40-47 TransportationRange = 8.3% to 170.6% Median = 51.4% Average = 64.8%41 Local and Suburban Transit4119 06/30/11 Rural/Metro Corp. 37.5%4119 05/25/11 Emergency Medical Services Corp. -9.4%*42 Motor Freight Transportation4212 03/23/12 WCA Waste Corp. 30.3%44 Water TransportationRange = 8.3% to 95.3% Median = 51.8% Average = 51.8%4412 11/03/11 OceanFreight, Inc. 95.3%4412 09/30/11 Crude Carriers Corp. -17.2%*4491 07/01/11 K-Sea Transportation Partners LP -35.7%*4499 06/02/11 Forth Ports Ltd. 8.3%45 Air Transportation4512 05/02/11 AirTran Holdings, Inc. 65.3%47 Transportation ServicesRange = 32.0% to 170.6% Median = 73.1% Average = 82.4%4724 10/14/11 hotel.de AG 32.0%4725 09/27/11 Holidaybreak PLC 35.5%Copyright © <strong>2012</strong>, FactSet Mergerstat, LLC. All rights reserved. 15
Mergerstat Control Premium Study1st Quarter <strong>2012</strong>4731 11/04/11 Clark Holdings, Inc. 170.6%47 Transportation Services (continued)4731 10/03/11 SOCAM Development Ltd. / Chow Holdings Ltd. 73.1%/ CIG China Holdings Ltd. (CIG Yangtze PortsPLC)4731 09/08/11 Sical Logistics Ltd. -9.7%*4731 04/19/11 Vantec Corp. 100.6%48 CommunicationsRange = 7.6% to 76.4% Median = 24.3% Average = 29.5%4812 04/01/11 Qwest Communications International, Inc. 33.5%4813 12/01/11 PAETEC Holding Corp. 22.4%4813 10/04/11 Global Crossing Ltd. 52.4%4813 07/28/11 Outremer Télécom SA 7.6%4813 06/08/11 Hughes Communications, Inc. 30.7%4822 07/15/11 SAVVIS, Inc. 9.8%4832 09/16/11 Citadel Broadcasting Corp. 24.3%4832 04/20/11 Village Roadshow Ltd. (Austereo Group Ltd.) 8.5%4841 03/22/12 Starcat Cable Network Co., Ltd. -98.0%*4841 11/21/11 BigBand Networks, Inc. 76.4%49 Electric, Gas, and Sanitary ServicesRange = 4.1% to 132.1% Median = 9.9% Average = 37.7%4911 03/12/12 Constellation Energy Group, Inc. 9.9%4911 02/06/12 Solarparc AG -19.6%*4911 11/28/11 DPL, Inc. 8.7%4911 11/07/11 Capital Power Income LP 4.1%4911 11/01/11 Gazprom OAO (Wholesale Generation Co. 6) -35.1%*4911 09/21/11 Indian Energy Ltd. 5.3%4911 06/23/11 Société Internationale d'Investissements9.8%Financiers SARL (EDF Energies NouvellesSA)4911 05/13/11 Plutonic Power Corp. -16.4%*4911 05/12/11 Fundo de Investimento em Participaçoes PCP -0.4%*(Redentor Energia SA)4924 03/26/12 Southern Union Co. 53.8%4924 12/09/11 Nicor, Inc. 25.1%4924 10/08/11 Zhengzhou Gas Co. Ltd. -24.6%*4953 12/08/11 Palko Environmental Ltd. 90.6%4953 04/21/11 Caprius, Inc. 132.1%Copyright © <strong>2012</strong>, FactSet Mergerstat, LLC. All rights reserved. 16
Mergerstat Control Premium Study1st Quarter <strong>2012</strong>50-51 Wholesale TradeRange = 6.1% to 182.3% Median = 42.1% Average = 58.0%50 Durable goodsRange = 6.1% to 91.9% Median = 42.1% Average = 47.7%5013 03/01/12 Montecarlo Co., Ltd. -96.4%*5015 01/24/12 Up Garage Co., Ltd. -98.4%*5032 06/06/11 PT Kokoh Inti Arebama Tbk 73.5%5045 08/29/11 Icron Technologies Corp. 42.1%5047 03/09/12 Futuremed Healthcare Products Corp. 32.9%5047 06/08/11 Nishimoto Real Estate KK (ELK Corp.) 72.7%5049 10/04/11 Ophir Optronics Ltd. 91.9%5065 02/27/12 Elematec Corp. -98.3%*5065 02/20/12 Unidux Electronics Ltd. 62.9%5082 02/23/12 Mulpha International Bhd. (Manta Holdings Co. -85.4%*Ltd.)5088 09/29/11 Satair A/S 23.4%5088 09/26/11 Portek International Ltd. 6.1%5099 06/22/11 Woolite Mercantile Co. Ltd. 24.1%51 Nondurable GoodsRange = 9.8% to 182.3% Median = 40.8% Average = 67.3%5112 05/02/11 CPI Group Ltd. 32.4%5122 03/01/12 Kaigen Co., Ltd. -98.4%*5122 06/16/11 BioPhausia AB 182.3%5122 06/10/11 Animal Health International, Inc. 11.0%5141 06/20/11 Massmart Holdings Ltd. 9.8%5142 09/23/11 Uniq PLC 28.0%5143 02/15/12 Robert Wiseman Dairies PLC 150.8%5159 05/05/11 Pyne Gould Corp. (PGG Wrightson Ltd.) 22.4%5162 12/06/11 Yamato Material Co., Ltd. 49.2%5192 09/26/11 Dawson Holdings PLC 109.5%5199 06/27/11 Skor Food Group, Inc. 77.3%Copyright © <strong>2012</strong>, FactSet Mergerstat, LLC. All rights reserved. 17
Mergerstat Control Premium Study1st Quarter <strong>2012</strong>52-59 Retail TradeRange = 7.4% to 112.3% Median = 37.8% Average = 43.6%53 General Merchandise StoresRange = 7.4% to 36.7% Median = 20.2% Average = 20.9%5311 08/26/11 Shanghai Bailian Group Co. Ltd. 16.4%5311 07/18/11 Korea Value Asset Management Co., Ltd.23.7%(Hyundai DSF Co., Ltd.)5311 06/22/11 Ideal Shopping Direct Ltd. 20.2%5311 05/26/11 Retail Ventures, Inc. 36.7%5399 09/30/11 BJ's Wholesale Club, Inc. 7.4%54 Food Stores5411 03/09/12 Winn-Dixie Stores, Inc. 75.0%5411 10/21/11 Universe Co., Ltd. 37.8%56 Apparel Stores5611 08/22/11 Goto Co., Ltd. 77.1%5611 08/18/11 Forzani Group Ltd. 50.5%57 Furniture and Equipment Stores5719 10/19/11 Mitsubishi Corp. (BALS Corp.) 47.5%5722 06/13/11 Tretti AB 24.5%58 Eating and Drinking PlacesRange = 10.7% to 80.1% Median = 40.0% Average = 42.0%5812 03/13/12 Skylark Co., Ltd. (Kozosushi So-Honbu Co., Ltd.) -99.0%*5812 02/01/12 Morton's Restaurant Group, Inc. 33.7%5812 01/10/12 Prime Restaurants, Inc. 51.8%5812 01/03/12 McCormick & Schmick's Seafood Restaurants, 29.2%Inc.5812 09/08/11 CAS Capital, Inc. (Kazokutei Co., Ltd.) 46.2%5812 07/07/11 California Pizza Kitchen, Inc. 10.7%5813 08/22/11 The Capital Pub Co. PLC 80.1%59 Miscellaneous RetailRange = 17.1% to 112.3% Median = 52.1% Average = 55.6%5912 06/03/11 drugstore.com, Inc. 112.3%5941 09/15/11 Japan Fine Arts KK (Kojitu Co., Ltd.) 17.1%Copyright © <strong>2012</strong>, FactSet Mergerstat, LLC. All rights reserved. 18
Mergerstat Control Premium Study1st Quarter <strong>2012</strong>5945 11/17/11 A.C. Moore Arts & Crafts, Inc. 68.4%59 Miscellaneous Retail (continued)5947 11/15/11 RH Traveler Corp. 53.2%5961 06/20/11 GSI Commerce, Inc. 50.9%5963 03/12/12 JAFCO Co., Ltd. (Radishbo-ya Co., Ltd.) -98.3%*5999 01/13/12 99¢ Only Stores 31.9%5999 07/18/11 Liquidation World, Inc. -45.5%*5999 05/04/11 NetOnNet AB -1.0%*60-67 Finance, Insurance, and Real EstateRange = 0.3% to 784.6% Median = 31.0% Average = 53.5%60-61 Banking and Credit AgenciesRange = 0.3% to 193.6% Median = 36.9% Average = 50.2%6021 03/09/12 Mainline Bancorp, Inc. 193.6%6021 02/29/12 Herald National Bank -11.4%*6021 07/20/11 Russian Railways OJSC (TransCreditBank JSC) 4.3%6021 07/05/11 Marshall & Ilsley Corp. 39.7%6021 06/04/11 Whitney Holding Corp. 23.2%6021 05/27/11 Silvio Santos Participaçoes SA (Banco11.4%Panamericano SA)6021 04/12/11 Banco Patagonia SA 9.7%6021 04/11/11 The Wilber Corp. 57.8%6021 04/01/11 Mybank Ltd. 164.0%6021 04/01/11 Sumitomo Trust & Banking Co. Ltd. -10.5%*6022 02/17/12 Stellar Business Bank 66.5%6022 01/03/12 Bancorp Rhode Island, Inc. 57.1%6022 10/24/11 Bank of Granite Corp. 137.6%6022 10/24/11 Santa Lucia Bancorp -46.2%*6022 10/03/11 Abington Bancorp, Inc. (Pennsylvania) -37.1%*6022 07/28/11 Sterling Bancshares, Inc. 0.3%6022 07/21/11 Legacy Bancorp, Inc. 63.2%6022 05/31/11 Omni Bancshares, Inc. 27.9%6022 05/16/11 Wilmington Trust Corp. -37.6%*6029 03/30/12 Aarhus Lokalbank A/S -78.9%*6029 06/30/11 Cascade Financial Corp. -18.2%*6029 04/15/11 IXE Grupo Financiero SA 45.5%6029 04/15/11 NewAlliance Bancshares, Inc. 34.3%6035 07/01/11 Danvers Bancorp, Inc. 30.2%6035 04/01/11 Rome Bancorp, Inc. 22.7%6036 07/15/11 GS Financial Corp. 21.7%6036 05/31/11 North Penn Bancorp, Inc. 70.2%6081 12/23/11 Philippine Bank of Communications, Inc. -44.2%*6141 09/22/11 Siam Industrial Credit Public Co. Ltd. 60.2%6163 05/10/11 Next SRL (Tuscany) (Toscana Finanza SpA) 20.8%Copyright © <strong>2012</strong>, FactSet Mergerstat, LLC. All rights reserved. 19
Mergerstat Control Premium Study1st Quarter <strong>2012</strong>60-61 Banking and Credit Agencies (continued)6197 11/30/11 Promise Co., Ltd. 39.5%6197 07/15/11 Yash Trading & Finance Ltd. 2.2%62 Security and Commodity Brokers and Related ServicesRange = 13.8% to 200.0% Median = 18.4% Average = 44.0%6211 02/15/12 CIMB Securities International (Thailand) Public -96.7%*Co. Ltd.6211 10/27/11 Astaire Group PLC 20.0%6211 10/03/11 Polaris Securities Co. Ltd. -2.7%*6211 09/01/11 optionsXpress Holdings, Inc. -17.8%*6211 08/31/11 United Securities Public Co., Ltd. 36.1%6211 08/17/11 ATR Holdings, Inc. (Philippines) (ATR KimEng 13.8%Financial Corp.)6211 06/28/11 LaBranche & Co., Inc. -5.6%*6211 06/10/11 TradeStation Group, Inc. 36.2%6211 05/10/11 Yuanta Securities Asia Financial Services Ltd. 14.8%(Kim Eng Holdings Ltd.)6211 04/08/11 Hudson Holding Corp. -31.0%*6231 12/02/11 NSX Ltd. 14.6%6282 03/09/12 Merchant Securities Group PLC 200.0%6282 04/04/11 Gartmore Group Ltd. 16.9%63-64 Insurance Companies and AgentsRange = 5.6% to 81.8% Median = 35.1% Average = 35.0%6311 08/24/11 Scottish Re Group Ltd. 81.8%6311 05/11/11 TOWER Australia Group Ltd. 46.5%6321 10/19/11 FPIC Insurance Group, Inc. 30.8%6324 01/31/12 HealthSpring, Inc. 37.0%6331 03/06/12 Transatlantic Holdings, Inc. 39.5%6331 01/17/12 Jerneh Asia Bhd. -65.9%*6331 08/01/11 Fremont Michigan InsuraCorp, Inc. 35.1%6351 10/27/11 Guaranty Trust Bank PLC (Guaranty Trust18.1%Assurance PLC)6361 11/30/11 Penn Millers Holding Corp. 25.0%6411 09/15/11 CBG Group PLC 54.2%6411 07/01/11 Chaucer Holdings PLC 5.6%6411 04/26/11 Glenrand MIB Ltd. 11.1%Copyright © <strong>2012</strong>, FactSet Mergerstat, LLC. All rights reserved. 20
Mergerstat Control Premium Study1st Quarter <strong>2012</strong>65 Real EstateRange = 9.4% to 784.6% Median = 53.5% Average = 118.1%6512 10/19/11 IHI Corp. / Effissimo Capital Management Pte 57.1%Ltd. (New Tachikawa Aircraft Co., Ltd.)6531 03/30/12 Dan Ejendomme Holding A/S -74.5%*6531 03/01/12 Sankei Building Co., Ltd. -96.9%*6531 02/29/12 Foncière Paris France 58.7%6531 02/23/12 CSI Properties Ltd. -83.0%*6531 12/14/11 Parsel Investments Ltd. / Yorania Investments 784.6%Ltd. / Arpanet Holdings Ltd. (KDD GroupNV)6531 09/19/11 Minerva PLC 53.5%6531 08/26/11 Valad Property Group 55.8%6531 06/23/11 SonomaWest Holdings, Inc. 20.4%6531 04/05/11 Pangbourne Properties Ltd. -7.4%*6552 03/02/12 Cosway Corp. Ltd. -81.6%*6552 11/29/11 Asia Pacific Land Bhd. 9.8%6552 08/18/11 Sunway City Bhd. 13.6%6552 07/20/11 OSK Property Holdings Bhd. 9.4%6552 07/06/11 SIIC Shanghai Holding Co. Ltd. (ShanghaiIndustrial Development Co. Ltd.)-8.5%*67 Holding Companies and Other Investment OfficesRange = 3.5% to 332.1% Median = 27.3% Average = 45.5%6712 02/17/12 Tower Bancorp, Inc. 62.8%6712 01/06/12 Brooklyn Federal Bancorp, Inc. -5.9%*6712 01/01/12 Parkvale Financial Corp. 127.8%6712 01/01/12 State Bancorp, Inc. (Jericho, New York) 18.6%6712 11/01/11 Community Capital Corp. 4.0%6712 08/30/11 Orange Community Bancorp 51.0%6712 07/01/11 MidCarolina Financial Corp. 112.9%6712 05/09/11 Union National Financial Corp. 46.1%6712 04/11/11 Fort Orange Financial Corp. 81.5%6719 01/25/12 Pennichuck Corp. 18.9%6719 12/28/11 Aikbee Resources Bhd. 16.3%6719 12/19/11 Heng Long International Ltd. 7.1%6719 05/13/11 Watford Leisure PLC 42.9%6726 06/02/11 SVM UK Active Fund PLC 8.9%6726 05/18/11 APG Algemene Pensioen Groep NV (ProLogis 7.8%European Properties)6726 05/18/11 Brompton Equity Split Corp. 6.7%6726 05/12/11 White Funds Management Pty Ltd. (Sylvastate -3.6%*Ltd.)6771 08/04/11 OFI Private Equity Capital SCA -13.4%*Copyright © <strong>2012</strong>, FactSet Mergerstat, LLC. All rights reserved. 21
Mergerstat Control Premium Study1st Quarter <strong>2012</strong>6771 07/26/11 EDT Retail Trust 28.6%67 Holding Companies and Other Investment Offices (continued)6798 03/02/12 Whiterock Real Estate Investment Trust 16.0%6798 03/01/12 CANMARC Real Estate Investment Trust 26.0%6798 10/13/11 VastNed Offices/Industrial NV -13.0%*6798 07/01/11 Nationwide Health Properties, Inc. 6.4%6798 06/27/11 Rabinov Property Trust 81.3%6798 06/15/11 Nexity SA / Natixis SA / BPCE SA (Eurosic SA) 3.8%6798 06/03/11 ProLogis 3.5%6799 03/06/12 Guld Invest Norden AB -56.0%*6799 02/21/12 Contango Capital Partners Ltd. 42.1%6799 01/26/12 Dhir India Investments PLC 332.1%6799 11/11/11 Easyknit Enterprises Holdings Ltd. -14.3%*6799 09/30/11 Impera Total Return AG 46.5%6799 09/21/11 Pulai Springs Bhd. 31.1%6799 07/06/11 SäkI AB 4.4%6799 06/22/11 Transfield Services Infrastructure Fund Ltd. 38.2%70-99 Services and OtherRange = 0.0% to 633.7% Median = 40.2% Average = 66.5%70 Hotels and Lodging PlacesRange = 35.7% to 100.0% Median = 68.4% Average = 68.1%7011 01/31/12 Sonesta International Hotels Corp. 35.7%7011 12/20/11 Karakami Kankoh Co., Ltd. 64.4%7011 06/20/11 Oaks Hotels & Resorts Ltd. 100.0%7011 05/16/11 Silverleaf Resorts, Inc. 72.4%73-78 Business ServicesRange = 0.0% to 633.7% Median = 40.2% Average = 74.4%7311 07/26/11 MediaMind Technologies, Inc. 38.0%7311 05/10/11 Burst Media Corp. PLC 569.5%7319 12/14/11 interCLICK, Inc. 21.6%7349 01/09/12 Distinction Group, Inc. 21.1%7352 04/01/11 Emergent Group, Inc. 39.6%7359 11/01/11 Access to Money, Inc. 15.2%7361 03/09/12 Network Group Holdings PLC 120.5%7361 12/13/11 Backs Group, Inc. 22.2%7361 10/20/11 Allied Healthcare International, Inc. 59.2%7361 05/26/11 Fullcast Holdings Co. Ltd. (Fullcast Technology 81.1%Co. Ltd.)7363 09/02/11 SFN Group, Inc. 52.7%7371 03/16/12 JBIS Holdings, Inc. -98.5%*Copyright © <strong>2012</strong>, FactSet Mergerstat, LLC. All rights reserved. 22
Mergerstat Control Premium Study1st Quarter <strong>2012</strong>7371 02/28/12 Patsystems PLC 130.6%73-78 Business Services (continued)7371 02/22/12 SuccessFactors, Inc. 52.4%7371 02/13/12 S1 Corp. 45.8%7371 12/20/11 Emancipation Capital LLC (InfoVista SA) 99.8%7371 10/01/11 CSK Corp. -13.0%*7371 07/19/11 Mamut ASA 9.1%7371 05/31/11 MKS, Inc. 38.3%7371 04/04/11 Global Defense Technology & Systems, Inc. 50.8%7372 03/06/12 Aspiro AB -80.4%*7372 03/02/12 Workplace Systems International PLC 188.0%7372 02/21/12 Atlantic Global PLC 124.5%7372 02/15/12 Aldata Solution Oyj 69.6%7372 02/14/12 DemandTec, Inc. 56.6%7372 01/31/12 ORC Group AB -80.5%*7372 01/25/12 RightNow Technologies, Inc. 19.6%7372 01/05/12 Xiring SA 58.7%7372 12/29/11 Excel Score Ltd. (Flexsystem Holdings Ltd.) -11.9%*7372 11/30/11 Fundtech Ltd. 310.2%7372 11/21/11 JM Technology, Inc. 129.5%7372 11/09/11 QMastor Ltd. 93.8%7372 10/04/11 Blackboard, Inc. 21.1%7372 10/01/11 AQ Interactive, Inc. -20.6%*7372 09/23/11 eFront SA 62.2%7372 08/17/11 Bridgewater Systems Corp. 29.5%7372 07/31/11 iSOFT Group Ltd. 226.9%7372 07/26/11 L-1 Identity Solutions, Inc. 23.7%7372 07/14/11 Chartwell Technology, Inc. 50.1%7372 07/13/11 Gerako Oy (Tekla Oyj) 51.5%7372 07/05/11 Lawson Software, Inc. -2.2%*7372 07/05/11 Synergi Solutions AS 54.3%7372 06/29/11 IBS AB -7.9%*7372 06/28/11 Entraction Holding AB 33.8%7372 06/16/11 Vital Images, Inc. 31.5%7372 06/09/11 smartFOCUS Group PLC 61.3%7372 05/16/11 Epicor Software Corp. 11.2%7372 05/06/11 System C Healthcare PLC 50.5%7372 04/27/11 Novell, Inc. 9.1%7372 04/18/11 Business Trust Co., Ltd. 46.1%7372 04/13/11 SomaFlex Holdings, Inc. (Flexsystem Holdings 23.3%Ltd.)7372 04/08/11 Metrologic Group SA 0.0%7372 04/01/11 Cytiva Software, Inc. 20.0%7373 03/30/12 ATS Corp. -1.5%*7373 02/23/12 Met's Corp. -98.0%*7373 02/22/12 Magma Design Automation, Inc. 32.4%7373 01/18/12 Superclick, Inc. 18.3%7373 12/30/11 INX, Inc. 15.9%Copyright © <strong>2012</strong>, FactSet Mergerstat, LLC. All rights reserved. 23
Mergerstat Control Premium Study1st Quarter <strong>2012</strong>7373 09/22/11 Proservia SA 30.8%73-78 Business Services (continued)7373 09/01/11 Tohken Co., Ltd. 29.9%7373 08/30/11 Telvent GIT SA 40.2%7373 08/05/11 BT Group PLC (Accel Frontline Ltd.) 2.4%7373 07/28/11 Integral Systems, Inc. (Maryland) -11.8%*7373 07/20/11 SRA International, Inc. 10.2%7374 11/09/11 Computec SA 633.7%7374 11/02/11 Emdeon, Inc. 44.2%7374 08/01/11 SBI VeriTrans Co., Ltd. -30.5%*7375 03/01/12 Vertro, Inc. -13.6%*7375 12/07/11 d&shop Co. Ltd. 0.4%7375 11/17/11 Renren Inc. (eLong, Inc.) 421.2%7375 08/29/11 IntraPower Ltd. 114.3%7375 07/11/11 ITOCHU Corp. (NANO Media Inc.) 12.7%7375 06/16/11 iWeb Groupe, Inc. 25.0%7375 04/29/11 RP Data Ltd. 64.3%7375 04/14/11 Answers Corp. 18.0%7375 04/04/11 JCA Holding ApS / Soeren Alminde Holding ApS 35.1%(Euroinvestor.com A/S)7379 02/29/12 Razor Risk Technologies Ltd. 111.1%7379 01/30/12 Pinnacle Data Systems, Inc. 111.5%7379 01/13/12 Inmeta Crayon ASA -75.9%*7379 09/13/11 Quintec SA 47.1%7379 04/21/11 NaviSite, Inc. 97.1%7379 04/11/11 Terremark Worldwide, Inc. 38.7%7382 09/09/11 Niscayah Group AB 46.9%7383 09/28/11 Global Traffic Network, Inc. 20.0%7389 02/23/12 Mobile Doctors Group PLC 271.8%7389 12/23/11 The Marketingroup SA 80.0%7389 11/02/11 InfoChoice Ltd. 74.2%7389 09/21/11 KH Investment Holdings Ltd. 4.2%7389 07/11/11 WebMoney Corp. 19.5%7389 04/15/11 ToLuna PLC 30.6%7622 11/03/11 Teleplan International NV 27.7%7819 12/05/11 Coolabi PLC 4.0%7819 07/11/11 Crystal Amber Fund Ltd. (Pinewood SheppertonPLC)22.1%79 Amusement and Recreation ServicesRange = 1.6% to 142.5% Median = 23.6% Average = 35.0%7922 02/06/12 HoriPro, Inc. -97.8%*7922 06/21/11 CKx, Inc. 23.6%7941 08/18/11 A.S. Roma SpA -41.3%*7941 06/10/11 DF Nominees Ltd. (Arsenal Holdings PLC) 1.6%Copyright © <strong>2012</strong>, FactSet Mergerstat, LLC. All rights reserved. 24
Mergerstat Control Premium Study1st Quarter <strong>2012</strong>7992 11/28/11 Lone Star Management Co. Ltd. (PGM HoldingsKK)79 Amusement and Recreation Services (continued)28.6%7993 08/31/11 Centrebet International Ltd. 25.8%7993 07/25/11 Praesepe PLC 20.9%7993 07/18/11 Rank Group PLC 2.1%7999 06/26/11 Odyssey Gaming Ltd. 142.5%80-82 Health ServicesRange = 18.5% to 229.0% Median = 44.0% Average = 56.0%8011 10/04/11 Continucare Corp. 34.7%8011 05/04/11 NovaMed, Inc. 40.4%8051 03/01/12 Japan Care Service Group Corp. -98.1%*8062 09/01/11 AIM Health Group, Inc. 48.8%8062 06/01/11 RehabCare Group, Inc. 47.6%8071 05/17/11 Celera Corp. 27.6%8082 06/03/11 America Service Group, Inc. 48.7%8093 11/01/11 PHC, Inc. -75.8%*8111 06/30/11 Pre-Paid Legal Services, Inc. 18.5%8211 03/13/12 UP, Inc. -97.7%*8299 12/21/11 Global Education & Technology Group Ltd. 229.0%8299 10/19/11 Renaissance Learning, Inc. 31.0%8299 09/21/11 Daiwa Securities Group Inc. (GABA Corp.) 49.0%8299 08/09/11 Nobel Learning Communities, Inc. 36.0%8299 07/13/11 Education Development International PLC 61.3%86 Membership Organizations8641 04/19/11 VCG Holding Corp. 36.4%87 Engineering , Accounting, Research and ManagementRange = 17.6% to 83.0% Median = 54.7% Average = 50.7%8711 10/11/11 Serma Technologies SA 28.5%8711 08/29/11 Servidyne, Inc. 54.7%8731 03/30/12 Affitech A/S -70.0%*8731 12/12/11 Afexa Life Sciences, Inc. 78.9%8731 12/05/11 Pharmaceutical Product Development, Inc. 25.0%8731 10/11/11 Ipsogen SA 70.9%8731 09/06/11 Ondine Biomedical, Inc. 65.0%8731 07/12/11 Kendle International, Inc. 53.9%8731 04/21/11 ProStrakan Group PLC 19.4%8734 12/15/11 Orchid Cellmark, Inc. 39.3%8741 02/09/12 American Dental Partners, Inc. 83.0%8742 11/02/11 N.I.C. Corp. 65.6%Copyright © <strong>2012</strong>, FactSet Mergerstat, LLC. All rights reserved. 25
Mergerstat Control Premium Study1st Quarter <strong>2012</strong>8742 10/14/11 APAC Customer Service, Inc. 57.2%8748 10/11/11 Ness Technologies, Inc. 17.6%88-89 Private Households and Miscellaneous Services8999 07/20/11 Warner Music Group Corp. 11.9%8999 06/24/11 Marsulex, Inc. -0.4%*Copyright © <strong>2012</strong>, FactSet Mergerstat, LLC. All rights reserved. 26
Mergerstat Control Premium Study1st Quarter <strong>2012</strong>Target Name and SIC Number (Domestic)Target NameTargetSICAcquirer NameAcquirerSIC99¢ Only Stores 5999 Ares Partners Management Co. LLC / CanadaPension Plan Investment BoardAdvanced Analogic Technologies, Inc. 3674 Skyworks Solutions, Inc. 3674American Dental Partners, Inc. 8741 JLL Partners, Inc. 6771ATS Corp. 7373 Salient Federal Solutions, Inc. 7379Baldwin Technology Co., Inc. 3555 Forsyth Capital Investors LLC 6771Bancorp Rhode Island, Inc. 6022 Brookline Bancorp, Inc. 6035Blue Coat Systems, Inc. 3577 Blue Coat Systems, Inc. /Private Group/ 6799Brooklyn Federal Bancorp, Inc. 6712 Investors Bancorp, Inc. (New Jersey) 6036Complete Production Services, Inc. 1382 Superior Energy Services, Inc. 3317Constellation Energy Group, Inc. 4911 Exelon Corp. 4931DemandTec, Inc. 7372 International Business Machines Corp. 3571GreenHouse Holdings, Inc. 1521 Premier Alliance Group, Inc. 7371HealthSpring, Inc. 6324 CIGNA Corp. 6324Herald National Bank 6021 BankUnited, Inc. 6022Inhibitex, Inc. 2834 Bristol-Myers Squibb Co. 2834Magma Design Automation, Inc. 7373 Synopsys, Inc. 7371Mainline Bancorp, Inc. 6021 S&T Bancorp, Inc. 6712McCormick & Schmick's Seafood Restaurants, Inc. 5812 Landry's Restaurants, Inc. 5812Micromet, Inc. 2836 Amgen, Inc. 2836Minera Andes, Inc. 1041 US Gold Corp. 1041Morton's Restaurant Group, Inc. 5812 Mortons Restaurant Group, Inc. /Private Group/ 6799Netlogic Microsystems, Inc. 3674 Broadcom Corp. 3674Parkvale Financial Corp. 6712 F.N.B. Corp. (Pennsylvania) 6021Pennichuck Corp. 6719 City of Nashua (New Hampshire) 9161Pharmasset, Inc. 2834 Gilead Sciences, Inc. 2836Pinnacle Data Systems, Inc. 7379 Avnet, Inc. 5045RightNow Technologies, Inc. 7372 Oracle Corp. 7372S1 Corp. 7371 ACI Worldwide, Inc. 7372Sonesta International Hotels Corp. 7011 Hospitality Properties Trust 6798SonoSite, Inc. 3845 FUJIFILM Holdings Corp. 3861Southern Union Co. 4924 Energy Transfer Equity LP 4923State Bancorp, Inc. (Jericho, New York) 6712 Valley National Bancorp 6712Stellar Business Bank 6022 AltaPacific Bancorp 6022SuccessFactors, Inc. 7371 SAP AG (SAP America, Inc.) 7372Synovis Life Technologies, Inc. 3841 Baxter International, Inc. 2836Tekelec 3669 Tekelec /Private Group/ 6799Temple-Inland, Inc. 2631 International Paper Co. 26216282Copyright © <strong>2012</strong>, FactSet Mergerstat, LLC. All rights reserved. 27
Mergerstat Control Premium Study1st Quarter <strong>2012</strong>Target NameTargetSICAcquirer NameAcquirerSICTower Bancorp, Inc. 6712 Susquehanna Bancshares, Inc. 6712Transatlantic Holdings, Inc. 6331 Alleghany Corp. 6331Valpey Fisher Corp. 3679 CTS Corp. 3571Vertro, Inc. 7375 Inuvo, Inc. 7319Winn-Dixie Stores, Inc. 5411 Lone Star Management Co. Ltd. (BI-LO LLC) 6771Copyright © <strong>2012</strong>, FactSet Mergerstat, LLC. All rights reserved. 28
Mergerstat Control Premium Study1st Quarter <strong>2012</strong>Target Name and SIC Number (International)Target NameTargetSICAcquirer NameAcquirerSICAarhus Lokalbank A/S 6029 Vestjysk Bank A/S 6021Ace & Partners Corp. 3663 Ace Technologies Corp. 3663ADTEC Engineering Co., Ltd. 3549 Ushio, Inc. 3827Affitech A/S 8731 Trans Nova Investments Ltd. 6799Aichi Machine Industry Co., Ltd. 3711 Nissan Motor Co., Ltd. 3711Alaska Milk Corp. 2026 Royal FrieslandCampina NV 2023Alcide Ltd. (Uster Technologies AG) 3552 Toyota Industries Corp. 3711Aldata Solution Oyj 7372 Symphony Technology Group LLC 6771Anvil Mining Ltd. 1021 Minmetals Resources Ltd. 5051Asia Square Holdings Ltd. (Newtree Group HoldingsLtd.)2676 Newtree Group Holdings Ltd. /Private Group/ 6799Aspiro AB 7372 Schibsted ASA 2711Atlantic Global PLC 7372 KeyedIn Solutions, Inc. (KeyedIn (UK) Ltd.) 7372Bellamont Exploration Ltd. 1311 Storm Resources Ltd. 1311CANMARC Real Estate Investment Trust 6798 Cominar Real Estate Investment Trust 6798CIMB Securities International (Thailand) Public Co.Ltd.6211 CIMB Group Holdings Bhd. (CIMB SecuritiesInternational Pte Ltd.)Contango Capital Partners Ltd. 6799 Contango MicroCap Ltd. 6799Cosalt PLC 2326 Cosalt PLC /Management/ 6799Cosway Corp. Ltd. 6552 Berjaya Corp. Bhd. (Cosway Corp. Bhd.) 6282CPB Equity Co. Ltd. (Thai Plastic & Chemicals PublicCo. Ltd.)2821 Siam Cement Public Co. Ltd. (SCG Chemicals Co.Ltd.)Crocodile Gold Corp. 1041 Luxor Capital Group LP 6282CSI Properties Ltd. 6531 Digisino Assets Ltd. (Earnest Equity Ltd.) 6799Dan Ejendomme Holding A/S 6531 Pensionskassernes Ejendomme A/S 6799Dhir India Investments PLC 6799 Acorn Global Investments Ltd. 6799Distinction Group, Inc. 7349 Birch Hill Equity Partners Management, Inc. 6771Elematec Corp. 5065 Toyota Tsusho Corp. 5013Emerge Oil & Gas, Inc. 1311 Twin Butte Energy Ltd. 1381Energy Support Corp. 3613 NGK Insulators, Ltd. 3644European Goldfields Ltd. 1041 Eldorado Gold Corp. 1041Exxon Mobil Corp. (Esso Malaysia Bhd.) 2911 San Miguel Corp. 2086Foncière Paris France 6531 Cofitem-Cofimur / Paris Hotels Roissy Vaugirard 6531Futuremed Healthcare Products Corp. 5047 Cardinal Health Canada, Inc. 3841Gennum Corp. 3674 Semtech Corp. 3674Grande Cache Coal Corp. 1241 Marubeni Corp. / Winsway Coking Coal HoldingsLtd. (1629835 Alberta Ltd.)Guld Invest Norden AB 6799 Stureguld AB 5094602932415085Copyright © <strong>2012</strong>, FactSet Mergerstat, LLC. All rights reserved. 29
Mergerstat Control Premium Study1st Quarter <strong>2012</strong>Target NameTargetSICAcquirer NameHang Ten Group Holdings Ltd. 2329 King Lun Holdings Ltd. (Perfect Lead InvestmentsLtd.)AcquirerSICHirotako Holdings Bhd. 3711 MBM Resources Bhd. 5012HoriPro, Inc. 7922 Seishunsha YK 6799Inmeta Crayon ASA 7379 Norvestor Equity AS 6771Jacques Vert PLC 2335 Sun Capital Partners, Inc. 6771JAFCO Co., Ltd. (Radishbo-ya Co., Ltd.) 5963 Nippon Telegraph & Telephone Corp. (NTTDoCoMo, Inc.)Japan Care Service Group Corp. 8051 Message Co., Ltd. 8051JBIS Holdings, Inc. 7371 Nippon Telegraph & Telephone Corp. (NTT DATACorp.)Jerneh Asia Bhd. 6331 Jerneh Asia Bhd. /Private Group/ 5169Kaigen Co., Ltd. 5122 Sakai Chemical Industry Co. Ltd. 2819Khazanah Nasional Bhd. (Proton Holdings Bhd.) 3711 DRB-Hicom Bhd. 3711Kverneland ASA 3523 Kubota Corp. 3523Lakeside Steel, Inc. 3317 DBO Holdings, Inc. (JMC Steel Group) 6719MARUSEI Co., Ltd. 1531 Takasago Thermal Engineering Co., Ltd. 8999Merchant Securities Group PLC 6282 Sanlam Ltd. (Sanlam UK Ltd.) 6163Met's Corp. 7373 Met's Corp. /Yoshino/ 6799Mobile Doctors Group PLC 7389 Quindell Portfolio PLC 7372Montecarlo Co., Ltd. 5013 Yellow Hat Ltd. 5013MSF Sugar Ltd. 2061 Mitr Siam Sugar Corp. Ltd. (Mitr Siam InternationalPte Ltd.)Mulpha International Bhd. (Manta Holdings Co. Ltd.) 5082 Eagle Legend International Holdings Ltd. 6799Network Group Holdings PLC 7361 Lloyds Banking Group PLC (Lloyds TSBDevelopment Capital Ltd.)Newave Energy Holding SA 3612 ABB Ltd. 3679Novitus SA 3679 Comp Safe Support SA 7372Omega Pharma NV 2834 Couckinvest NV 6799Optimum Coal Holdings Ltd. 1222 Glencore International PLC / Lexshell 849Investments (Proprietary) Ltd.ORC Group AB 7372 Triona Holding SA (Nordic Capital AB) 6799Patsystems PLC 7371 Modernelite Ltd. (ION Trading Ireland Ltd.) 6719Peasedow Enterprises Ltd. (Chinlink InternationalHoldings Ltd.)6799481348130133602113112512 Wealth Keeper International Ltd. 6799Prime Restaurants, Inc. 5812 Fairfax Financial Holdings Ltd. 6361Razor Risk Technologies Ltd. 7379 TMX Group, Inc. 6231Ripplewood Investments LLC (Asahi Tec Corp.) 3714 Unison Capital, Inc. 6771Robert Wiseman Dairies PLC 5143 Unternehmensgruppe Theo Müller GmbH & Co.KG (Müller Dairy (UK) Ltd.)0241Copyright © <strong>2012</strong>, FactSet Mergerstat, LLC. All rights reserved. 30
Mergerstat Control Premium Study1st Quarter <strong>2012</strong>Target NameTargetSICAcquirer NameAcquirerSICRuggedCom, Inc. 3499 Siemens AG 3663Sanjo Machine Works Ltd. 3462 Sanjo Machine Works Ltd. /Management Members/ 6799Sankei Building Co., Ltd. 6531 Fuji Media Holdings, Inc. (Fuji Media Service KK) 4833Signature Metals Ltd. 1041 LionGold Corp. Ltd. 1041Skylark Co., Ltd. (Kozosushi So-Honbu Co., Ltd.) 5812 Equal Partners KK 6799SMB United Ltd. 3613 Osaki Electric Co., Ltd. 3679Société Vermandoise de Sucreries SA 2062 Cristal Union SCA 2063Solarparc AG 4911 SolarWorld AG 3511Solbar Industries Ltd. 2075 CHS, Inc. 0119SSCP Co., Ltd. (Schramm Holding AG) 2851 Akzo Nobel NV (Salvador AG) 2851Starcat Cable Network Co., Ltd. 4841 Community Network Center, Inc. 4841Superclick, Inc. 7373 AT&T, Inc. 4813TPC Plus Bhd. 0252 Huat Lai Resources Bhd. 0259TR Shoji YK (Yasuragi Co., Ltd.) 1521 Advantage Partners LLP 6771Tricolor SA 2851 Inversiones Breca SA (Inversiones Pinturas del Sur IIILtda.)Unidux Electronics Ltd. 5065 Avnet, Inc. (Unidux, Inc.) 5045Up Garage Co., Ltd. 5015 Up Garage Co. Ltd. /Ishida/ 6799UP, Inc. 8211 Benesse Holdings, Inc. 8299Whiterock Real Estate Investment Trust 6798 Dundee Real Estate Investment Trust 6798Wild Stream Exploration, Inc. 1311 Crescent Point Energy Corp. 1311Workplace Systems International PLC 7372 WorkPlace Systems International PLC /Management/ 6799YTL Cement Bhd. 3241 YTL Corp Bhd. 32411099Copyright © <strong>2012</strong>, FactSet Mergerstat, LLC. All rights reserved. 31
Mergerstat Control Premium Study1st Quarter <strong>2012</strong>Announce & Closing Dates, Total Deal Value (Domestic)Target NameAnnounceDateClose DateTargetMarket Valueof Equity($Mil)CurrencyExchangeRatePctg. ofCommonPreviouslyHeld by Acq.Pctg. OfCommonHeld by Acq.After Trans.99¢ Only Stores 10/11/11 01/13/12 1,551.9 1.00 0.0 100.0Advanced Analogic Technologies, Inc. 05/26/11 01/10/12 256.1 1.00 0.0 100.0American Dental Partners, Inc. 11/07/11 02/09/12 293.6 1.00 0.0 100.0ATS Corp. 02/21/12 03/30/12 73.5 1.00 0.0 100.0Baldwin Technology Co., Inc. 12/23/11 03/20/12 15.1 1.00 0.0 100.0Bancorp Rhode Island, Inc. 04/20/11 01/03/12 205.7 1.00 0.0 100.0Blue Coat Systems, Inc. 12/09/11 02/15/12 1,104.7 1.00 0.0 100.0Brooklyn Federal Bancorp, Inc. 08/17/11 01/06/12 5.8 1.00 0.0 100.0Complete Production Services, Inc. 10/10/11 02/07/12 2,875.5 1.00 0.0 100.0Constellation Energy Group, Inc. 04/28/11 03/12/12 7,305.2 1.00 0.0 100.0DemandTec, Inc. 12/08/11 02/14/12 446.4 1.00 0.0 100.0GreenHouse Holdings, Inc. 09/20/11 03/05/12 3.5 1.00 0.0 100.0HealthSpring, Inc. 10/24/11 01/31/12 3,735.2 1.00 0.0 100.0Herald National Bank 06/02/11 02/29/12 44.7 1.00 0.0 100.0Inhibitex, Inc. 01/07/12 02/13/12 2,035.6 1.00 0.0 100.0Magma Design Automation, Inc. 11/30/11 02/22/12 510.8 1.00 0.0 100.0Mainline Bancorp, Inc. 09/14/11 03/09/12 21.4 1.00 0.0 100.0McCormick & Schmick's SeafoodRestaurants, Inc.11/08/11 01/03/12 117.1 1.00 10.1 100.0Micromet, Inc. 01/26/12 03/07/12 1,048.5 1.00 0.0 100.0Minera Andes, Inc. 06/14/11 01/24/12 652.6 1.00 0.0 100.0Morton's Restaurant Group, Inc. 12/16/11 02/01/12 116.6 1.00 5.0 100.0Netlogic Microsystems, Inc. 09/12/11 02/17/12 3,577.8 1.00 0.0 100.0Parkvale Financial Corp. 06/15/11 01/01/12 138.4 1.00 0.0 100.0Pennichuck Corp. 11/12/10 01/25/12 136.0 1.00 0.0 100.0Pharmasset, Inc. 11/21/11 01/17/12 10,365.0 1.00 0.0 100.0Pinnacle Data Systems, Inc. 11/10/11 01/30/12 18.9 1.00 0.0 100.0RightNow Technologies, Inc. 10/24/11 01/25/12 1,421.7 1.00 0.0 100.0S1 Corp. 07/26/11 02/13/12 573.7 1.00 0.0 100.0Sonesta International Hotels Corp. 11/03/11 01/31/12 114.6 1.00 0.0 100.0SonoSite, Inc. 12/15/11 03/29/12 762.3 1.00 0.0 100.0Southern Union Co. 06/16/11 03/26/12 5,468.8 1.00 0.0 100.0State Bancorp, Inc. (Jericho, New York) 04/28/11 01/01/12 210.6 1.00 0.0 100.0Stellar Business Bank 09/14/11 02/17/12 17.5 1.00 0.0 100.0SuccessFactors, Inc. 12/03/11 02/22/12 3,392.1 1.00 0.0 100.0Copyright © <strong>2012</strong>, FactSet Mergerstat, LLC. All rights reserved. 32
Mergerstat Control Premium Study1st Quarter <strong>2012</strong>Target NameAnnounceDateClose DateTargetMarket Valueof Equity($Mil)CurrencyExchangeRatePctg. ofCommonPreviouslyHeld by Acq.Pctg. OfCommonHeld by Acq.After Trans.Synovis Life Technologies, Inc. 12/13/11 02/14/12 312.7 1.00 0.0 100.0Tekelec 11/07/11 01/27/12 761.8 1.00 0.0 100.0Temple-Inland, Inc. 06/06/11 02/13/12 3,508.3 1.00 0.0 100.0Tower Bancorp, Inc. 06/20/11 02/17/12 395.7 1.00 0.0 100.0Transatlantic Holdings, Inc. 11/21/11 03/06/12 3,835.3 1.00 0.0 100.0Valpey Fisher Corp. 11/17/11 01/24/12 18.1 1.00 0.0 100.0Vertro, Inc. 10/17/11 03/01/12 9.9 1.00 0.0 100.0Winn-Dixie Stores, Inc. 12/19/11 03/09/12 537.3 1.00 0.0 100.0Copyright © <strong>2012</strong>, FactSet Mergerstat, LLC. All rights reserved. 33
Mergerstat Control Premium Study1st Quarter <strong>2012</strong>Announce & Closing Dates, Total Deal Value (International) *Target NameAnnounceDateClose DateTargetMarket Valueof Equity($Mil)CurrencyExchangeRatePctg. OfCommonPreviouslyHeld by Acq.Pctg. OfCommonHeld by Acq.After Trans.Aarhus Lokalbank A/S 01/25/12 03/30/12 17.1 0.18 0.0 100.0Ace & Partners Corp. 10/17/11 01/13/12 17.6 0.0009 0.0 100.0ADTEC Engineering Co., Ltd. 02/13/12 03/12/12 8.9 0.01 25.7 50.6Affitech A/S 02/28/12 03/30/12 5.5 0.18 40.0 71.3Aichi Machine Industry Co., Ltd. 12/16/11 03/22/12 222.1 0.01 41.5 100.0Alaska Milk Corp. 03/09/12 03/20/12 299.2 0.02 8.1 68.9Alcide Ltd. (Uster Technologies AG) 11/07/11 02/21/12 77.2 1.10 28.5 50.3Aldata Solution Oyj 06/28/11 02/15/12 29.3 1.31 41.5 100.0Anvil Mining Ltd. 09/29/11 02/17/12 1,339.3 1.07 0.0 100.0Asia Square Holdings Ltd. (Newtree GroupHoldings Ltd.)03/09/12 03/09/12 32.2 0.13 0.0 71.5Aspiro AB 01/12/12 03/06/12 31.9 0.15 18.3 73.4Atlantic Global PLC 01/24/12 02/21/12 7.8 1.58 0.0 100.0Bellamont Exploration Ltd. 01/20/12 03/23/12 59.5 1.00 0.0 100.0CANMARC Real Estate Investment Trust 11/28/11 03/01/12 778.2 1.01 15.1 100.0CIMB Securities International (Thailand)Public Co. Ltd.09/28/11 02/15/12 24.9 0.03 0.0 70.1Contango Capital Partners Ltd. 09/20/11 02/21/12 13.1 1.07 8.3 74.8Cosalt PLC 11/25/11 02/01/12 1.1 1.59 15.1 100.0Cosway Corp. Ltd. 07/07/11 03/02/12 364.6 0.13 45.5 100.0CPB Equity Co. Ltd. (Thai Plastic &Chemicals Public Co. Ltd.)12/21/11 01/31/12 255.7 0.03 45.6 75.8Crocodile Gold Corp. 12/13/11 02/09/12 106.4 1.01 15.5 70.0CSI Properties Ltd. 12/14/11 02/23/12 45.2 0.13 35.0 51.7Dan Ejendomme Holding A/S 03/15/12 03/30/12 91.8 0.18 0.0 100.0Dhir India Investments PLC 12/20/11 01/26/12 11.0 1.57 0.0 100.0Distinction Group, Inc. 11/21/11 01/09/12 132.7 0.97 0.0 100.0Elematec Corp. 08/01/11 02/27/12 199.9 0.01 0.0 51.0Emerge Oil & Gas, Inc. 11/13/11 01/09/12 127.9 0.97 0.0 100.0Energy Support Corp. 11/28/11 01/17/12 49.8 0.01 49.1 96.0European Goldfields Ltd. 12/18/11 02/24/12 2,320.2 1.00 0.0 100.0Exxon Mobil Corp. (Esso Malaysia Bhd.) 08/17/11 03/30/12 200.5 0.33 0.0 65.0Foncière Paris France 10/07/11 02/29/12 177.2 1.34 24.4 84.0Futuremed Healthcare Products Corp. 10/25/11 03/09/12 125.9 1.01 0.0 100.0* Values are in U.S. Dollars, see page 59-62 for currency denomination of exchange rates.Copyright © <strong>2012</strong>, FactSet Mergerstat, LLC. All rights reserved. 34
Mergerstat Control Premium Study1st Quarter <strong>2012</strong>Target NameAnnounceDateClose DateTargetMarket Valueof Equity($Mil)CurrencyExchangeRatePctg. OfCommonPreviouslyHeld by Acq.Pctg. OfCommonHeld by Acq.After Trans.Gennum Corp. 01/23/12 03/20/12 485.1 1.01 0.0 100.0Grande Cache Coal Corp. 10/31/11 03/01/12 997.0 1.01 0.0 100.0Guld Invest Norden AB 10/27/11 03/06/12 5.1 0.15 0.0 90.0Hang Ten Group Holdings Ltd. 12/19/11 02/16/12 342.0 0.13 0.0 100.0Hirotako Holdings Bhd. 10/27/11 01/03/12 124.1 0.32 0.0 96.0HoriPro, Inc. 12/16/11 02/06/12 85.9 0.01 45.3 89.5Inmeta Crayon ASA 12/08/11 01/13/12 136.9 0.16 0.0 100.0Jacques Vert PLC 12/19/11 02/27/12 64.0 1.58 0.0 100.0JAFCO Co., Ltd. (Radishbo-ya Co., Ltd.) 01/30/12 03/12/12 63.8 0.01 0.0 78.3Japan Care Service Group Corp. 01/19/12 03/01/12 33.1 0.01 0.0 94.2JBIS Holdings, Inc. 01/31/12 03/16/12 86.7 0.01 1.3 72.8Jerneh Asia Bhd. 10/31/11 01/17/12 67.9 0.32 37.7 97.6Kaigen Co., Ltd. 11/21/11 03/01/12 24.2 0.01 49.5 100.0Khazanah Nasional Bhd. (Proton HoldingsBhd.)01/16/12 03/16/12 422.3 0.33 7.3 50.0Kverneland ASA 12/16/11 01/20/12 215.4 0.17 0.0 78.9Lakeside Steel, Inc. 01/25/12 03/30/12 57.8 1.00 0.0 100.0MARUSEI Co., Ltd. 02/13/12 03/12/12 24.0 0.01 5.1 66.0Merchant Securities Group PLC 08/31/11 03/09/12 16.2 1.57 9.7 100.0Met's Corp. 01/26/12 02/23/12 2.1 0.01 0.0 55.6Mobile Doctors Group PLC 11/04/11 02/23/12 8.3 1.57 21.1 100.0Montecarlo Co., Ltd. 12/02/11 03/01/12 4.4 0.01 0.0 100.0MSF Sugar Ltd. 11/09/11 03/16/12 254.4 1.06 22.0 100.0Mulpha International Bhd. (Manta HoldingsCo. Ltd.)02/14/12 02/23/12 36.7 0.13 0.0 75.0Network Group Holdings PLC 02/03/12 03/09/12 30.7 1.57 0.0 100.0Newave Energy Holding SA 12/12/11 02/28/12 107.2 1.11 45.0 100.0Novitus SA 12/21/10 01/17/12 128.0 0.29 46.0 100.0Omega Pharma NV 09/02/11 02/10/12 764.3 1.32 31.1 100.0Optimum Coal Holdings Ltd. 09/01/11 03/27/12 763.9 0.13 14.1 81.9ORC Group AB 12/19/11 01/31/12 296.9 0.15 0.0 100.0Patsystems PLC 11/28/11 02/28/12 32.7 1.58 27.9 100.0Peasedow Enterprises Ltd. (ChinlinkInternational Holdings Ltd.)10/06/11 01/20/12 30.0 0.13 0.0 70.5Prime Restaurants, Inc. 11/21/11 01/10/12 54.9 0.98 0.0 100.0Razor Risk Technologies Ltd. 11/29/11 02/29/12 10.8 1.08 0.0 100.0Ripplewood Investments LLC (Asahi Tec 12/28/11 02/03/12 155.4 0.01 0.0 67.2* Values are in U.S. Dollars, see page 59-62 for currency denomination of exchange rates.Copyright © <strong>2012</strong>, FactSet Mergerstat, LLC. All rights reserved. 35
Mergerstat Control Premium Study1st Quarter <strong>2012</strong>Target NameCorp.)AnnounceDateClose DateTargetMarket Valueof Equity($Mil)CurrencyExchangeRatePctg. OfCommonPreviouslyHeld by Acq.Pctg. OfCommonHeld by Acq.After Trans.Robert Wiseman Dairies PLC 01/16/12 02/15/12 433.2 1.57 0.0 100.0RuggedCom, Inc. 01/30/12 03/16/12 412.2 1.01 0.0 100.0Sanjo Machine Works Ltd. 12/02/11 01/23/12 86.1 0.01 0.007 94.9Sankei Building Co., Ltd. 01/19/12 03/01/12 186.4 0.01 36.3 68.0Signature Metals Ltd. 10/14/11 03/28/12 51.7 1.04 0.0 76.2Skylark Co., Ltd. (Kozosushi So-Honbu Co.,Ltd.)02/14/12 03/13/12 11.7 0.01 0.0 52.6SMB United Ltd. 12/28/11 03/30/12 163.2 0.80 0.0 100.0Société Vermandoise de Sucreries SA 10/04/11 02/01/12 650.7 1.32 0.0 94.5Solarparc AG 11/15/10 02/06/12 22.4 1.31 29.0 100.0Solbar Industries Ltd. 11/23/11 02/09/12 129.7 0.27 0.0 100.0SSCP Co., Ltd. (Schramm Holding AG) 06/30/11 03/28/12 185.8 1.33 0.0 100.0Starcat Cable Network Co., Ltd. 02/20/12 03/22/12 60.6 0.01 0.0 94.0Superclick, Inc. 09/23/11 01/18/12 12.5 0.99 0.0 100.0TPC Plus Bhd. 10/03/11 03/29/12 5.2 0.33 33.7 53.0TR Shoji YK (Yasuragi Co., Ltd.) 01/26/12 03/12/12 156.0 0.01 0.0 98.7Tricolor SA 12/30/11 01/26/12 102.7 0.002 0.0 100.0Unidux Electronics Ltd. 10/28/11 02/20/12 9.0 0.80 33.9 100.0Up Garage Co., Ltd. 12/05/11 01/24/12 3.8 0.01 38.4 87.4UP, Inc. 01/31/12 03/13/12 95.7 0.01 15.1 88.2Whiterock Real Estate Investment Trust 01/17/12 03/02/12 600.3 1.01 0.0 100.0Wild Stream Exploration, Inc. 01/25/12 03/15/12 545.7 1.01 0.0 100.0Workplace Systems International PLC 12/09/11 03/02/12 58.8 1.59 0.0 100.0YTL Cement Bhd. 12/19/11 03/09/12 496.9 0.33 44.1 91.1* Values are in U.S. Dollars, see page 59-62 for currency denomination of exchange rates.Copyright © <strong>2012</strong>, FactSet Mergerstat, LLC. All rights reserved. 36
Mergerstat Control Premium Study1st Quarter <strong>2012</strong>Purchase Price/Share – Mergerstat Unaffected Price (Domestic) *Target NamePurchasePrice PerShareMergerstatUnaffectedPricePrice1 DayPrice1 WeekPrice1 MonthPrice2 Months99¢ Only Stores 22.00 16.68 20.49 18.54 18.60 17.56Advanced Analogic Technologies, Inc. 5.80 3.84 3.84 3.81 4.34 3.76American Dental Partners, Inc. 19.00 10.38 10.38 10.56 9.16 10.37ATS Corp. 3.20 3.25 3.25 3.15 3.05 3.16Baldwin Technology Co., Inc. 0.96 0.47 0.47 0.44 0.50 0.98Bancorp Rhode Island, Inc. 48.25 30.71 30.71 30.00 30.37 31.89Blue Coat Systems, Inc. 25.81 17.48 17.48 17.81 14.74 15.39Brooklyn Federal Bancorp, Inc. 0.80 0.85 0.85 0.85 1.14 0.49Complete Production Services, Inc. 36.27 20.53 20.38 16.97 25.79 27.83Constellation Energy Group, Inc. 36.19 32.93 34.30 33.10 30.74 31.07DemandTec, Inc. 13.20 8.43 8.43 7.65 8.36 6.78GreenHouse Holdings, Inc. 0.13 0.55 0.55 0.70 0.81 0.93HealthSpring, Inc. 55.00 40.16 40.16 39.17 34.96 36.15Herald National Bank 3.66 4.13 4.13 2.90 2.20 2.26Inhibitex, Inc. 26.00 9.87 9.63 10.94 14.30 9.72Magma Design Automation, Inc. 7.35 5.55 5.55 5.32 5.58 4.55Mainline Bancorp, Inc. 69.00 23.50 23.50 22.50 22.50 22.50McCormick & Schmick's Seafood Restaurants, Inc. 8.75 6.77 6.77 6.41 6.78 6.89Micromet, Inc. 11.00 8.28 8.28 8.65 7.24 5.09Minera Andes, Inc. 2.31 2.10 2.10 2.30 2.56 3.28Morton's Restaurant Group, Inc. 6.90 5.16 5.16 5.00 5.42 5.30Netlogic Microsystems, Inc. 50.00 31.91 31.91 29.89 31.57 38.79Parkvale Financial Corp. 24.79 10.88 10.88 11.03 10.30 9.41Pennichuck Corp. 29.00 24.40 24.40 24.07 23.85 22.90Pharmasset, Inc. 137.00 72.67 72.67 68.93 72.54 77.29Pinnacle Data Systems, Inc. 2.40 1.14 1.14 1.15 1.17 1.30RightNow Technologies, Inc. 43.00 35.96 35.96 38.92 31.27 29.61S1 Corp. 10.39 7.13 7.13 7.17 7.54 7.16Sonesta International Hotels Corp. 31.00 22.85 22.85 17.30 18.90 19.07SonoSite, Inc. 54.00 30.78 42.24 42.55 41.80 32.96Southern Union Co. 43.45 28.26 28.26 29.30 27.59 27.91State Bancorp, Inc. (Jericho, New York) 12.42 10.47 10.75 10.60 10.00 10.52Stellar Business Bank 7.62 4.58 4.58 4.55 4.40 4.50SuccessFactors, Inc. 40.00 26.25 26.50 23.63 27.26 21.23* All stock prices are in U.S. Dollars..www.mergerstat.com 37
Mergerstat Control Premium Study1st Quarter <strong>2012</strong>Target NamePurchasePrice PerShareMergerstatUnaffectedPricePrice1 DayPrice1 WeekPrice1 MonthPrice2 MonthsSynovis Life Technologies, Inc. 28.00 18.44 18.44 18.64 18.68 17.99Tekelec 11.00 9.90 9.90 9.82 6.65 6.70Temple-Inland, Inc. 32.00 23.25 21.69 23.24 23.27 23.74Tower Bancorp, Inc. 33.00 20.27 20.27 19.45 20.59 21.83Transatlantic Holdings, Inc. 61.38 44.01 54.43 54.57 52.59 46.60Valpey Fisher Corp. 4.15 2.55 2.55 2.62 2.28 2.32Vertro, Inc. 1.39 1.61 1.61 1.49 1.75 1.80Winn-Dixie Stores, Inc. 9.50 5.43 5.43 5.21 6.30 5.84* All stock prices are in U.S. Dollars..www.mergerstat.com 38
Mergerstat Control Premium Study1st Quarter <strong>2012</strong>Purchase Price/Share – Mergerstat Unaffected Price (International) *Target NamePurchasePrice PerShareMergerstatUnaffectedPricePrice1 DayPrice1 WeekPrice1 MonthPrice2 MonthsAarhus Lokalbank A/S 1.06 5.00 5.80 5.00 5.25 5.00Ace & Partners Corp. 1.12 1,110.00 1,110.00 1,025.00 1,170.00 1,215.00ADTEC Engineering Co., Ltd. 4.87 310.00 310.00 303.00 295.00 308.00Affitech A/S 0.04 0.12 0.12 0.13 0.19 0.21Aichi Machine Industry Co., Ltd. 4.19 213.00 213.00 219.00 223.00 223.00Alaska Milk Corp. 0.56 16.00 16.00 15.60 15.32 13.36Alcide Ltd. (Uster Technologies AG) 41.73 33.00 36.00 35.00 35.90 30.00Aldata Solution Oyj 0.80 0.47 0.47 0.45 0.49 0.51Anvil Mining Ltd. 8.48 5.73 5.73 5.75 5.62 6.34Asia Square Holdings Ltd. (Newtree Group HoldingsLtd.)0.07 0.84 0.84 0.69 0.54 0.46Aspiro AB 0.24 1.24 1.24 1.25 1.23 1.47Atlantic Global PLC 0.35 0.16 0.15 0.14 0.14 0.14Bellamont Exploration Ltd. 0.46 0.42 0.42 0.42 0.40 0.36CANMARC Real Estate Investment Trust 16.73 13.28 13.28 13.50 12.95 12.29CIMB Securities International (Thailand) Public Co.Ltd.0.06 1.70 1.70 1.54 1.57 1.34Contango Capital Partners Ltd. 1.00 0.70 0.70 0.70 0.70 0.76Cosalt PLC 0.003 0.008 0.003 0.004 0.007 0.03Cosway Corp. Ltd. 0.14 0.77 0.82 0.75 0.80 0.83CPB Equity Co. Ltd. (Thai Plastic & Chemicals PublicCo. Ltd.)0.97 28.50 28.50 26.50 24.50 21.80Crocodile Gold Corp. 0.62 0.34 0.34 0.37 0.41 0.59CSI Properties Ltd. 0.03 0.19 0.19 0.19 0.20 0.18Dan Ejendomme Holding A/S 102.03 400.00 400.00 400.00 380.00 350.00Dhir India Investments PLC 0.66 0.15 0.15 0.16 0.16 0.27Distinction Group, Inc. 4.38 3.62 3.62 3.72 3.65 3.51Elematec Corp. 19.14 1,097.00 1,097.00 1,133.00 1,191.00 1,042.00Emerge Oil & Gas, Inc. 1.39 0.99 0.93 0.96 0.92 1.35Energy Support Corp. 4.69 167.00 167.00 167.00 171.00 175.00European Goldfields Ltd. 12.63 11.84 12.15 12.86 9.14 10.38Exxon Mobil Corp. (Esso Malaysia Bhd.) 1.14 4.34 4.34 4.28 4.87 5.20Foncière Paris France 147.15 92.72 92.72 95.50 90.61 102.00Futuremed Healthcare Products Corp. 8.24 6.20 6.20 5.72 6.77 7.00Gennum Corp. 13.64 6.15 6.15 6.08 6.15 5.81Grande Cache Coal Corp. 10.14 5.87 5.87 5.58 4.16 7.70Guld Invest Norden AB 0.04 0.10 0.10 0.10 0.09 0.10* All stock prices are in home currency, See page 59-62 for currency denomination of stock prices.Copyright © <strong>2012</strong>, FactSet Mergerstat, LLC. All rights reserved. 39
Mergerstat Control Premium Study1st Quarter <strong>2012</strong>Target NamePurchasePrice PerShareMergerstatUnaffectedPricePrice1 DayPrice1 WeekPrice1 MonthPrice2 MonthsHang Ten Group Holdings Ltd. 0.35 1.70 1.70 1.64 1.90 1.46Hirotako Holdings Bhd. 0.31 0.88 0.88 0.81 0.59 0.73HoriPro, Inc. 13.71 627.00 627.00 625.00 623.00 671.00Inmeta Crayon ASA 0.99 4.10 4.10 3.91 4.13 4.10Jacques Vert PLC 0.33 0.13 0.13 0.13 0.14 0.16JAFCO Co., Ltd. (Radishbo-ya Co., Ltd.) 12.04 714.00 714.00 712.00 720.00 729.00Japan Care Service Group Corp. 4.26 230.00 230.00 230.00 232.00 222.00JBIS Holdings, Inc. 3.72 242.00 242.00 240.00 235.00 230.00Jerneh Asia Bhd. 0.46 1.36 1.36 1.34 1.28 1.31Kaigen Co., Ltd. 5.44 339.00 339.00 331.00 328.00 335.00Khazanah Nasional Bhd. (Proton Holdings Bhd.) 1.80 4.50 5.46 5.25 4.55 3.53Kverneland ASA 1.77 5.85 6.25 5.90 6.50 4.75Lakeside Steel, Inc. 0.30 0.07 0.21 0.17 0.25 0.17MARUSEI Co., Ltd. 7.30 435.00 435.00 435.00 424.00 428.00Merchant Securities Group PLC 0.35 0.12 0.12 0.11 0.13 0.14Met's Corp. 7.67 388.00 388.00 367.00 377.00 363.00Mobile Doctors Group PLC 0.63 0.17 0.17 0.19 0.14 0.15Montecarlo Co., Ltd. 0.76 21.26 34.13 21.16 20.37 25.51MSF Sugar Ltd. 4.45 3.40 3.40 3.24 3.29 3.33Mulpha International Bhd. (Manta Holdings Co. Ltd.) 0.25 1.68 1.68 1.74 1.36 1.50Network Group Holdings PLC 0.41 0.19 0.19 0.19 0.19 0.19Newave Energy Holding SA 62.38 45.75 45.75 45.00 40.00 38.70Novitus SA 42.18 31.20 31.20 30.50 29.90 26.30Omega Pharma NV 47.48 31.97 34.12 33.14 32.00 35.60Optimum Coal Holdings Ltd. 4.48 30.00 33.10 30.00 25.49 27.00ORC Group AB 12.63 64.75 64.75 64.00 58.25 59.75Patsystems PLC 0.22 0.10 0.10 0.11 0.12 0.19Peasedow Enterprises Ltd. (Chinlink InternationalHoldings Ltd.)0.21 0.08 0.08 0.08 0.13 0.12Prime Restaurants, Inc. 7.36 4.85 6.93 6.90 6.78 4.87Razor Risk Technologies Ltd. 0.04 0.02 0.02 0.02 0.02 0.02Ripplewood Investments LLC (Asahi Tec Corp.) 0.35 27.00 27.00 30.00 22.00 23.00Robert Wiseman Dairies PLC 6.12 2.44 2.44 2.49 2.41 2.72RuggedCom, Inc. 33.29 13.61 26.25 25.90 24.10 14.79Sanjo Machine Works Ltd. 6.08 203.00 203.00 200.00 220.00 215.00Sankei Building Co., Ltd. 9.14 292.00 292.00 294.00 300.00 299.00Signature Metals Ltd. 0.03 0.01 0.01 0.01 0.02 0.02Skylark Co., Ltd. (Kozosushi So-Honbu Co., Ltd.) 1.69 167.00 167.00 182.00 163.00 156.00* All stock prices are in U.S. Dollars..www.mergerstat.com 40
Mergerstat Control Premium Study1st Quarter <strong>2012</strong>Target NamePurchasePrice PerShareMergerstatUnaffectedPricePrice1 DayPrice1 WeekPrice1 MonthPrice2 MonthsSMB United Ltd. 0.32 0.28 0.37 0.35 0.32 0.28Société Vermandoise de Sucreries SA 4,602.54 1,755.00 1,755.00 1,755.00 1,752.60 1,771.00Solarparc AG 5.27 6.55 6.70 6.75 6.90 6.95Solbar Industries Ltd. 4.05 7.00 7.00 7.34 7.65 7.02SSCP Co., Ltd. (Schramm Holding AG) 9.33 2.67 2.67 2.71 2.66 2.34Starcat Cable Network Co., Ltd. 961.27 47,500.00 47,900.00 47,200.00 46,950.00 44,000.00Superclick, Inc. 0.27 0.23 0.23 0.25 0.23 0.23TPC Plus Bhd. 0.10 0.25 0.25 0.19 0.22 0.24TR Shoji YK (Yasuragi Co., Ltd.) 7.63 366.00 366.00 350.00 335.00 301.00Tricolor SA 0.52 58.05 58.05 58.05 58.05 58.05Unidux Electronics Ltd. 0.11 0.07 0.07 0.08 0.08 0.08Up Garage Co., Ltd. 643.42 40,500.00 40,500.00 40,000.00 41,000.00 34,700.00UP, Inc. 12.70 546.00 546.00 555.00 550.00 585.00Whiterock Real Estate Investment Trust 16.48 14.21 14.21 13.90 13.16 13.09Wild Stream Exploration, Inc. 7.82 9.80 9.80 8.90 8.90 9.31Workplace Systems International PLC 0.40 0.14 0.14 0.13 0.15 0.14YTL Cement Bhd. 0.57 4.54 4.54 4.49 4.43 4.50* All stock prices are in U.S. Dollars..www.mergerstat.com 41
Mergerstat Control Premium Study1st Quarter <strong>2012</strong>Mergerstat Unaffected Control Premium (Domestic)Target NameMergerstatUnaffectedControlPremiumPremium1 DayPremium1 WeekPremium1 MonthPremium2 Months99¢ Only Stores 31.9% 7.4% 18.7% 18.3% 25.3%Advanced Analogic Technologies, Inc. 51.0% 51.0% 52.4% 33.6% 54.3%American Dental Partners, Inc. 83.0% 83.0% 79.9% 107.4% 83.2%ATS Corp. -1.5% * -1.5% 1.6% 4.9% 1.3%Baldwin Technology Co., Inc. 104.3% 104.3% 118.2% 92.0% -2.0%Bancorp Rhode Island, Inc. 57.1% 57.1% 60.8% 58.9% 51.3%Blue Coat Systems, Inc. 47.7% 47.7% 44.9% 75.1% 67.7%Brooklyn Federal Bancorp, Inc. -5.9% * -5.9% -5.9% -29.8% 63.3%Complete Production Services, Inc. 76.7% 78.0% 113.7% 40.6% 30.3%Constellation Energy Group, Inc. 9.9% 5.5% 9.3% 17.7% 16.5%DemandTec, Inc. 56.6% 56.6% 72.5% 57.9% 94.7%GreenHouse Holdings, Inc. -77.1% * -77.1% -82.0% -84.4% -86.5%HealthSpring, Inc. 37.0% 37.0% 40.4% 57.3% 52.1%Herald National Bank -11.4% * -11.4% 26.2% 66.3% 61.9%Inhibitex, Inc. 163.4% 170.0% 137.7% 81.8% 167.5%Magma Design Automation, Inc. 32.4% 32.4% 38.2% 31.7% 61.5%Mainline Bancorp, Inc. 193.6% 193.6% 206.7% 206.7% 206.7%McCormick & Schmick's Seafood Restaurants, Inc. 29.2% 29.2% 36.5% 29.1% 27.0%Micromet, Inc. 32.9% 32.9% 27.2% 51.9% 116.1%Minera Andes, Inc. 10.0% 10.0% 0.4% -9.8% -29.6%Morton's Restaurant Group, Inc. 33.7% 33.7% 38.0% 27.3% 30.2%Netlogic Microsystems, Inc. 56.7% 56.7% 67.3% 58.4% 28.9%Parkvale Financial Corp. 127.8% 127.8% 124.7% 140.7% 163.4%Pennichuck Corp. 18.9% 18.9% 20.5% 21.6% 26.6%Pharmasset, Inc. 88.5% 88.5% 98.8% 88.9% 77.3%Pinnacle Data Systems, Inc. 111.5% 111.5% 108.7% 105.1% 84.6%RightNow Technologies, Inc. 19.6% 19.6% 10.5% 37.5% 45.2%S1 Corp. 45.8% 45.8% 45.0% 37.9% 45.2%Sonesta International Hotels Corp. 35.7% 35.7% 79.2% 64.0% 62.6%SonoSite, Inc. 75.4% 27.8% 26.9% 29.2% 63.8%Southern Union Co. 53.8% 53.8% 48.3% 57.5% 55.7%State Bancorp, Inc. (Jericho, New York) 18.6% 15.5% 17.2% 24.2% 18.1%Stellar Business Bank 66.5% 66.5% 67.4% 73.1% 69.2%SuccessFactors, Inc. 52.4% 50.9% 69.3% 46.7% 88.4%Synovis Life Technologies, Inc. 51.8% 51.8% 50.2% 49.9% 55.6%Tekelec 11.1% 11.1% 12.0% 65.4% 64.2%Temple-Inland, Inc. 37.6% 47.5% 37.7% 37.5% 34.8%Tower Bancorp, Inc. 62.8% 62.8% 69.6% 60.3% 51.1%Transatlantic Holdings, Inc. 39.5% 12.8% 12.5% 16.7% 31.7%* Not used in average or median calculations.Copyright © <strong>2012</strong>, FactSet Mergerstat, LLC. All rights reserved. 42
Mergerstat Control Premium Study1st Quarter <strong>2012</strong>Target NameMergerstatUnaffectedControlPremiumPremium1 DayPremium1 WeekPremium1 MonthPremium2 MonthsValpey Fisher Corp. 62.7% 62.7% 58.4% 82.0% 78.9%Vertro, Inc. -13.6% * -13.6% -6.6% -20.5% -22.7%Winn-Dixie Stores, Inc. 57.7% 46.3% 50.4% 49.4% 54.7%Range: High 193.6% 193.6% 206.7% 206.7% 206.7%Low -77.1% -77.1% -82.0% -84.4% -86.5%Median: 51.4% 49.3% 46.6% 57.3% 55.6%Average: 57.7% 46.3% 50.4% 49.4% 54.7%* Not used in average or median calculations.www.mergerstat.com 43
Mergerstat Control Premium Study1st Quarter <strong>2012</strong>Mergerstat Unaffected Control Premium (International)Target NameMergerstatUnaffectedControlPremiumPremium1 DayPremium1 WeekPremium1 MonthPremium2 MonthsAarhus Lokalbank A/S -78.9% * -81.8% -78.9% -79.9% -78.9%Ace & Partners Corp. -99.9% * -99.9% -99.9% -99.9% -99.9%ADTEC Engineering Co., Ltd. -98.4% * -98.4% -98.4% -98.4% -98.4%Affitech A/S -70.0% * -70.0% -72.3% -81.1% -82.9%Aichi Machine Industry Co., Ltd. -98.0% * -98.0% -98.1% -98.1% -98.1%Alaska Milk Corp. -96.5% * -96.5% -96.4% -96.4% -95.8%Alcide Ltd. (Uster Technologies AG) 26.4% 15.9% 19.2% 16.2% 39.1%Aldata Solution Oyj 69.6% 69.6% 77.1% 62.7% 56.3%Anvil Mining Ltd. 47.9% 47.9% 47.4% 50.8% 33.7%Asia Square Holdings Ltd. (Newtree Group HoldingsLtd.)-91.9% * -91.9% -90.1% -87.4% -85.2%Aspiro AB -80.4% * -80.4% -80.6% -80.2% -83.5%Atlantic Global PLC 124.5% 140.0% 148.6% 148.6% 148.6%Bellamont Exploration Ltd. 8.6% 8.6% 8.6% 15.4% 26.7%CANMARC Real Estate Investment Trust 26.0% 26.0% 23.9% 29.2% 36.1%CIMB Securities International (Thailand) Public Co.Ltd.-96.7% * -96.7% -96.4% -96.4% -95.8%Contango Capital Partners Ltd. 42.1% 42.1% 42.1% 42.1% 30.9%Cosalt PLC -61.3% * 20.0% -25.0% -57.1% -88.0%Cosway Corp. Ltd. -81.6% * -82.7% -81.1% -82.3% -82.9%CPB Equity Co. Ltd. (Thai Plastic & ChemicalsPublic Co. Ltd.)-96.6% * -96.6% -96.3% -96.0% -95.6%Crocodile Gold Corp. 83.5% 83.5% 68.6% 54.1% 5.8%CSI Properties Ltd. -83.0% * -83.0% -82.8% -83.8% -81.5%Dan Ejendomme Holding A/S -74.5% * -74.5% -74.5% -73.1% -70.8%Dhir India Investments PLC 332.1% 332.1% 325.2% 311.9% 148.7%Distinction Group, Inc. 21.1% 21.1% 17.8% 20.1% 24.9%Elematec Corp. -98.3% * -98.3% -98.3% -98.4% -98.2%Emerge Oil & Gas, Inc. 39.9% 48.9% 44.3% 50.5% 2.6%Energy Support Corp. -97.2% * -97.2% -97.2% -97.3% -97.3%European Goldfields Ltd. 6.7% 4.0% -1.8% 38.2% 21.7%Exxon Mobil Corp. (Esso Malaysia Bhd.) -73.7% * -73.7% -73.3% -76.6% -78.0%Foncière Paris France 58.7% 58.7% 54.1% 62.4% 44.3%Futuremed Healthcare Products Corp. 32.9% 32.9% 44.1% 21.7% 17.7%Gennum Corp. 121.8% 121.8% 124.4% 121.8% 134.8%Grande Cache Coal Corp. 72.7% 72.7% 81.7% 143.8% 31.7%Guld Invest Norden AB -56.0% * -56.0% -56.0% -51.1% -56.0%Hang Ten Group Holdings Ltd. -79.5% * -79.5% -78.8% -81.7% -76.2%Hirotako Holdings Bhd. -65.0% * -65.0% -62.0% -47.8% -57.8%HoriPro, Inc. -97.8% * -97.8% -97.8% -97.8% -98.0%* Not used in average or median calculations.Copyright © <strong>2012</strong>, FactSet Mergerstat, LLC. All rights reserved. 44
Mergerstat Control Premium Study1st Quarter <strong>2012</strong>Target NameMergerstatUnaffectedControlPremiumPremium1 DayPremium1 WeekPremium1 MonthPremium2 MonthsInmeta Crayon ASA -75.9% * -75.9% -74.7% -76.1% -75.9%Jacques Vert PLC 166.4% 166.4% 156.2% 142.2% 114.8%JAFCO Co., Ltd. (Radishbo-ya Co., Ltd.) -98.3% * -98.3% -98.3% -98.3% -98.3%Japan Care Service Group Corp. -98.1% * -98.1% -98.1% -98.2% -98.1%JBIS Holdings, Inc. -98.5% * -98.5% -98.5% -98.4% -98.4%Jerneh Asia Bhd. -65.9% * -65.9% -65.4% -63.8% -64.6%Kaigen Co., Ltd. -98.4% * -98.4% -98.4% -98.3% -98.4%Khazanah Nasional Bhd. (Proton Holdings Bhd.) -60.0% * -67.1% -65.7% -60.5% -49.0%Kverneland ASA -69.7% * -71.7% -70.0% -72.8% -62.7%Lakeside Steel, Inc. 308.2% 45.4% 75.3% 19.2% 75.3%MARUSEI Co., Ltd. -98.3% * -98.3% -98.3% -98.3% -98.3%Merchant Securities Group PLC 200.0% 200.0% 228.6% 165.4% 155.6%Met's Corp. -98.0% * -98.0% -97.9% -98.0% -97.9%Mobile Doctors Group PLC 271.8% 271.8% 241.6% 351.4% 335.9%Montecarlo Co., Ltd. -96.4% * -97.8% -96.4% -96.2% -97.0%MSF Sugar Ltd. 30.9% 30.9% 37.3% 35.3% 33.6%Mulpha International Bhd. (Manta Holdings Co. Ltd.) -85.4% * -85.4% -85.9% -82.0% -83.7%Network Group Holdings PLC 120.5% 120.5% 120.5% 120.5% 120.5%Newave Energy Holding SA 36.4% 36.4% 38.6% 56.0% 61.2%Novitus SA 35.2% 35.2% 38.3% 41.1% 60.4%Omega Pharma NV 48.5% 39.2% 43.3% 48.4% 33.4%Optimum Coal Holdings Ltd. -85.1% * -86.5% -85.1% -82.4% -83.4%ORC Group AB -80.5% * -80.5% -80.3% -78.3% -78.9%Patsystems PLC 130.6% 130.6% 108.9% 88.9% 20.0%Peasedow Enterprises Ltd. (Chinlink InternationalHoldings Ltd.)151.1% 151.1% 151.1% 65.2% 71.9%Prime Restaurants, Inc. 51.8% 6.2% 6.7% 8.6% 51.2%Razor Risk Technologies Ltd. 111.1% 111.1% 137.5% 153.3% 111.1%Ripplewood Investments LLC (Asahi Tec Corp.) -98.7% * -98.7% -98.8% -98.4% -98.5%Robert Wiseman Dairies PLC 150.8% 150.8% 146.3% 153.9% 125.4%RuggedCom, Inc. 144.6% 26.8% 28.5% 38.1% 125.1%Sanjo Machine Works Ltd. -97.0% * -97.0% -97.0% -97.2% -97.2%Sankei Building Co., Ltd. -96.9% * -96.9% -96.9% -97.0% -96.9%Signature Metals Ltd. 92.3% 92.3% 92.3% 66.7% 38.9%Skylark Co., Ltd. (Kozosushi So-Honbu Co., Ltd.) -99.0% * -99.0% -99.1% -99.0% -98.9%SMB United Ltd. 15.6% -12.9% -9.1% 1.0% 15.6%Société Vermandoise de Sucreries SA 162.3% 162.3% 162.3% 162.6% 159.9%Solarparc AG -19.6% * -21.4% -22.0% -23.7% -24.2%Solbar Industries Ltd. -42.2% * -42.2% -44.9% -47.1% -42.4%SSCP Co., Ltd. (Schramm Holding AG) 249.6% 249.6% 244.4% 250.9% 298.9%Starcat Cable Network Co., Ltd. -98.0% * -98.0% -98.0% -98.0% -97.8%* Not used in average or median calculations.www.mergerstat.com 45
Mergerstat Control Premium Study1st Quarter <strong>2012</strong>Target NameMergerstatUnaffectedControlPremiumPremium1 DayPremium1 WeekPremium1 MonthPremium2 MonthsSuperclick, Inc. 18.3% 18.3% 10.1% 15.8% 18.3%TPC Plus Bhd. -60.0% * -60.0% -48.4% -55.5% -59.2%TR Shoji YK (Yasuragi Co., Ltd.) -97.9% * -97.9% -97.8% -97.7% -97.5%Tricolor SA -99.1% * -99.1% -99.1% -99.1% -99.1%Unidux Electronics Ltd. 62.9% 62.9% 42.5% 42.5% 42.5%Up Garage Co., Ltd. -98.4% * -98.4% -98.4% -98.4% -98.1%UP, Inc. -97.7% * -97.7% -97.7% -97.7% -97.8%Whiterock Real Estate Investment Trust 16.0% 16.0% 18.5% 25.2% 25.9%Wild Stream Exploration, Inc. -20.3% * -20.3% -12.2% -12.2% -16.1%Workplace Systems International PLC 188.0% 188.0% 196.1% 164.0% 182.9%YTL Cement Bhd. 98.4% * -6.2% -6.1% -6.8% -10.6%Range: High 332.1% 332.1% 325.2% 351.4% 335.9%Low -99.9% -99.9% -99.9% -99.9% -99.9%Median: 66.2% -56.0% -48.4% -51.1% -56.0%Average: 98.4% -6.2% -6.1% -6.8% -10.6%* Not used in average or median calculations.www.mergerstat.com 46
Mergerstat Control Premium Study1st Quarter <strong>2012</strong>Target Financials (Domestic)($ in Millions)Target NameTargetTICTargetSalesTargetIncomeTargetBook ValueTargetEBITTargetEBITDA99¢ Only Stores 1,553.0 1,475.2 77.4 717.8 123.6 151.4Advanced Analogic Technologies, Inc. 248.4 92.6 -13.6 101.2 -15.8 -12.5American Dental Partners, Inc. 379.1 290.2 11.4 -70.2 27.9 51.6ATS Corp. 77.6 97.2 5.0 4.0 8.3 10.9Baldwin Technology Co., Inc. 43.1 156.8 -10.9 8.8 -4.3 -1.3Bancorp Rhode Island, Inc. 567.9 81.6 9.9 117.9 33.2 33.3Blue Coat Systems, Inc. 1,180.7 467.2 28.3 190.7 41.4 48.8Brooklyn Federal Bancorp, Inc. 19.3 22.0 -23.6 40.7 -7.1 -6.6Complete Production Services, Inc. 3,479.0 2,096.5 188.7 718.6 357.1 550.2Constellation Energy Group, Inc. 11,773.4 14,323.6 1,171.9 7,877.4 1,085.0 1,624.8DemandTec, Inc. 442.0 89.1 -19.3 24.3 -18.8 -11.7GreenHouse Holdings, Inc. 5.7 6.4 -4.8 -2.7 -4.4 -4.0HealthSpring, Inc. 4,079.4 4,390.0 232.8 413.8 395.1 443.7Herald National Bank 44.7 23.1 -3.3 51.1 0.6 0.6Inhibitex, Inc. 2,035.8 2.1 -25.1 49.4 -25.0 -24.4Magma Design Automation, Inc. 527.9 146.4 5.6 21.4 9.0 16.4Mainline Bancorp, Inc. 33.5 11.2 11.1 20.2 3.9 3.9McCormick & Schmick's Seafood Restaurants, Inc. 140.5 345.7 -31.2 64.3 -28.5 -14.3Micromet, Inc. 1,009.5 21.9 -74.2 105.1 -74.1 -71.6Minera Andes, Inc. 652.0 37.7 39.4 176.5 39.3 39.3Morton's Restaurant Group, Inc. 185.9 316.0 5.7 -64.9 12.5 21.3Netlogic Microsystems, Inc. 3,450.3 402.8 -35.6 242.7 -38.1 22.5Parkvale Financial Corp. 387.6 81.4 21.4 96.0 42.5 44.3Pennichuck Corp. 194.8 36.1 4.1 56.1 9.9 14.3Pharmasset, Inc. 10,353.8 0.9 -91.2 154.3 -91.1 -90.5Pinnacle Data Systems, Inc. 18.9 26.3 1.7 8.9 1.3 1.6RightNow Technologies, Inc. 1,594.0 216.2 26.6 33.1 13.2 24.1S1 Corp. 560.5 227.3 -1.3 85.0 -1.1 10.4Sonesta International Hotels Corp. 152.2 81.7 -1.1 21.9 1.2 7.0SonoSite, Inc. 851.7 308.8 6.4 82.9 19.6 29.7Southern Union Co. 9,189.9 2,477.7 246.9 2,481.7 563.1 795.8State Bancorp, Inc. (Jericho, New York) 350.5 82.6 11.5 120.6 19.8 19.6Stellar Business Bank 17.5 4.9 -0.1 17.4 0.5 0.5SuccessFactors, Inc. 3,338.3 291.8 -34.8 43.0 -49.6 -42.2Synovis Life Technologies, Inc. 318.7 82.4 8.5 86.5 12.7 14.6Tekelec 761.8 400.9 1.4 393.5 -11.6 42.1Temple-Inland, Inc. 4,716.4 3,889.0 188.0 644.0 228.0 421.0Tower Bancorp, Inc. 488.4 104.5 7.4 229.7 30.4 35.1Copyright © <strong>2012</strong>, FactSet Mergerstat, LLC. All rights reserved. 47
Mergerstat Control Premium Study1st Quarter <strong>2012</strong>($ in Millions)Target NameTargetTICTargetSalesTargetIncomeTargetBook ValueTargetEBITTargetEBITDATransatlantic Holdings, Inc. 4,789.7 3,873.8 -231.6 4,294.9 103.9 103.9Valpey Fisher Corp. 18.1 15.0 0.6 8.7 0.9 1.0Vertro, Inc. 10.0 31.7 -1.1 1.5 -1.5 -1.0Winn-Dixie Stores, Inc. 595.0 6,929.0 -17.9 638.6 -12.1 104.9www.mergerstat.com 48
Mergerstat Control Premium Study1st Quarter <strong>2012</strong>Target Financials (International)($ in Millions)Target NameTargetTICTargetSalesTargetIncomeTargetBook ValueTargetEBITTargetEBITDAAarhus Lokalbank A/S 308.8 48.0 -27.9 39.1 -11.8 -11.1Ace & Partners Corp. 9.9 164.2 0.8 65.1 4.8 12.7ADTEC Engineering Co., Ltd. 33.9 127.1 8.1 56.0 8.6 11.4Affitech A/S 3.3 9.6 -8.9 6.1 -8.8 -8.3Aichi Machine Industry Co., Ltd. 4.6 1,332.4 26.9 744.2 43.7 148.8Alaska Milk Corp. 12.1 274.0 25.6 116.0 30.3 39.5Alcide Ltd. (Uster Technologies AG) 491.5 194.5 45.9 -79.7 48.4 66.8Aldata Solution Oyj 126.2 94.3 0.4 -2.1 2.0 4.4Anvil Mining Ltd. 1,470.9 58.1 19.4 607.1 28.4 45.2Asia Square Holdings Ltd. (Newtree Group HoldingsLtd.)5.8 43.4 2.5 54.9 2.6 3.8Aspiro AB 6.9 33.9 -6.0 10.5 -5.9 -2.6Atlantic Global PLC 12.3 1.8 -0.3 3.1 -0.3 -0.3Bellamont Exploration Ltd. 95.8 38.9 -3.8 86.6 -2.3 17.9CANMARC Real Estate Investment Trust 1,579.2 180.6 -101.3 697.8 -65.5 -56.7CIMB Securities International (Thailand) Public Co.Ltd.1.2 15.0 2.4 20.2 59.9 60.4Contango Capital Partners Ltd. 21.1 1.1 0.0 22.8 0.0 0.0Cosalt PLC 55.0 178.9 -7.3 -8.2 0.8 36.8Cosway Corp. Ltd. 119.8 434.1 34.9 96.9 51.2 58.9CPB Equity Co. Ltd. (Thai Plastic & Chemicals PublicCo. Ltd.)127.1 1,019.1 81.2 429.6 104.3 139.5Crocodile Gold Corp. 194.7 118.4 -5.5 244.1 -5.5 5.8CSI Properties Ltd. 278.1 626.8 265.9 711.0 302.6 304.0Dan Ejendomme Holding A/S 33.0 73.3 7.1 46.3 10.4 11.2Dhir India Investments PLC 17.2 0.4 -1.6 19.3 -1.6 -1.6Distinction Group, Inc. 147.6 266.3 8.3 8.0 12.8 16.5Elematec Corp. 21.5 1,377.0 29.0 359.3 45.0 48.4Emerge Oil & Gas, Inc. 171.9 133.3 -29.2 124.2 -26.9 29.7Energy Support Corp. 8.4 187.4 4.2 156.0 6.2 11.3European Goldfields Ltd. 2,325.7 59.1 -54.0 391.5 -52.0 -46.4Exxon Mobil Corp. (Esso Malaysia Bhd.) 316.1 3,212.1 95.8 289.1 136.6 136.6Foncière Paris France 903.7 55.8 108.9 385.1 128.2 128.1Futuremed Healthcare Products Corp. 168.7 216.4 12.2 -22.4 9.3 15.7Gennum Corp. 471.9 136.5 14.1 108.1 19.5 29.9Grande Cache Coal Corp. 1,089.5 304.4 36.2 314.4 54.6 78.6Guld Invest Norden AB 2.0 31.0 -1.4 1.8 -1.3 -1.2Hang Ten Group Holdings Ltd. 93.2 322.5 34.5 99.5 41.8 47.0Copyright © <strong>2012</strong>, FactSet Mergerstat, LLC. All rights reserved. 49
Mergerstat Control Premium Study1st Quarter <strong>2012</strong>($ in Millions)Target NameTargetTICTargetSalesTargetIncomeTargetBook ValueTargetEBITTargetEBITDAHirotako Holdings Bhd. 41.3 86.0 18.4 60.3 21.1 24.1HoriPro, Inc. 20.2 256.7 12.0 260.4 24.7 27.9Inmeta Crayon ASA 29.5 103.5 6.6 -2.3 10.2 12.6Jacques Vert PLC 101.5 187.4 6.6 39.4 7.1 9.4JAFCO Co., Ltd. (Radishbo-ya Co., Ltd.) 18.0 266.9 0.3 8.2 1.6 6.6Japan Care Service Group Corp. 99.8 265.6 3.1 -5.7 5.2 10.9JBIS Holdings, Inc. 37.6 427.7 -3.5 156.7 7.8 35.6Jerneh Asia Bhd. 49.3 38.2 -1.1 120.3 4.7 4.7Kaigen Co., Ltd. 0.6 109.0 2.1 102.8 4.0 5.5Khazanah Nasional Bhd. (Proton Holdings Bhd.) 697.7 2,791.6 -1.0 1,251.6 18.3 18.3Kverneland ASA 124.8 681.2 7.8 113.6 20.9 36.4Lakeside Steel, Inc. 97.7 216.8 -16.6 13.7 -15.6 -12.9MARUSEI Co., Ltd. 1.2 144.9 2.3 59.4 4.7 5.5Merchant Securities Group PLC 27.8 13.2 0.2 4.0 0.4 1.0Met's Corp. 0.0 0.0 -1.8 38.9 -0.5 -0.5Mobile Doctors Group PLC 42.2 44.4 1.4 -7.1 3.2 3.4Montecarlo Co., Ltd. 59.8 101.7 -1.2 4.1 0.7 1.7MSF Sugar Ltd. 125.1 102.2 4.7 169.9 2.5 5.0Mulpha International Bhd. (Manta Holdings Co. Ltd.) 24.7 19.9 -0.2 24.8 0.3 4.6Network Group Holdings PLC 49.4 85.7 2.6 -1.6 4.2 4.7Newave Energy Holding SA 224.0 45.1 3.7 62.0 5.7 7.3Novitus SA 72.0 26.0 3.0 18.4 4.0 4.7Omega Pharma NV 1,947.7 1,199.7 82.9 -407.7 134.0 160.5Optimum Coal Holdings Ltd. 258.3 696.5 60.5 791.6 97.1 185.1ORC Group AB 43.6 142.9 11.6 -3.8 15.5 27.4Patsystems PLC 65.6 34.4 3.5 28.9 4.4 6.8Peasedow Enterprises Ltd. (Chinlink InternationalHoldings Ltd.)18.0 91.2 2.7 66.5 5.1 10.1Prime Restaurants, Inc. 54.5 264.5 10.2 9.8 6.2 6.5Razor Risk Technologies Ltd. 11.8 10.6 -0.2 2.3 0.4 0.6Ripplewood Investments LLC (Asahi Tec Corp.) 159.9 960.1 3.0 193.2 15.2 62.8Robert Wiseman Dairies PLC 720.9 1,447.5 38.4 251.2 42.1 103.5RuggedCom, Inc. 417.0 115.4 7.8 81.6 12.2 18.0Sanjo Machine Works Ltd. 1.2 139.7 3.1 136.9 5.8 12.2Sankei Building Co., Ltd. 1,246.5 311.2 12.0 629.8 46.7 95.3Signature Metals Ltd. 1.4 0.1 -2.8 31.2 -2.8 -2.8Skylark Co., Ltd. (Kozosushi So-Honbu Co., Ltd.) 3.8 247.3 -11.1 28.1 -9.6 -6.2SMB United Ltd. 167.4 208.8 13.9 110.6 21.6 25.0www.mergerstat.com 50
Mergerstat Control Premium Study1st Quarter <strong>2012</strong>($ in Millions)Target NameTargetTICTargetSalesTargetIncomeTargetBook ValueTargetEBITTargetEBITDASociété Vermandoise de Sucreries SA 909.2 437.9 33.9 86.5 95.2 108.8Solarparc AG 41.3 19.5 -1.4 32.8 3.3 8.7Solbar Industries Ltd. 91.1 186.0 5.6 70.8 8.4 13.2SSCP Co., Ltd. (Schramm Holding AG) 274.8 153.2 6.4 66.8 12.0 16.5Starcat Cable Network Co., Ltd. 89.2 103.2 -4.9 106.5 3.0 24.3Superclick, Inc. 12.3 10.6 1.3 3.7 1.9 1.9TPC Plus Bhd. 10.3 15.3 -0.1 10.3 0.1 1.0TR Shoji YK (Yasuragi Co., Ltd.) 96.5 340.5 2.1 181.9 8.4 9.0Tricolor SA 30,231.8 40,567.6 2,795.3 50,143.7 5,833.2 8,447.6Unidux Electronics Ltd. 13.8 148.9 2.6 13.8 2.8 2.9Up Garage Co., Ltd. 10.7 67.9 1.6 9.4 3.1 4.1UP, Inc. 25.8 102.8 6.0 122.9 10.9 11.3Whiterock Real Estate Investment Trust 651.8 91.0 4.7 424.7 28.7 44.7Wild Stream Exploration, Inc. 610.1 91.5 17.0 431.8 24.8 63.3Workplace Systems International PLC 93.1 15.4 0.6 2.3 0.7 1.4YTL Cement Bhd. 379.5 755.8 112.9 701.0 174.4 217.9www.mergerstat.com 51
Mergerstat Control Premium Study1st Quarter <strong>2012</strong>Target Multiples (Domestic)Target NameTargetP/SalesTargetP/IncomeTargetP/Book ValueTargetTIC/EBIT (1)TargetTIC/EBITDA (1)99¢ Only Stores 1.1 20.1 2.2 12.6 10.3Advanced Analogic Technologies, Inc. 2.7 -18.2 * 2.5 -15.8 * -19.9 *American Dental Partners, Inc. 1.0 25.6 -4.2 * 13.6 7.3ATS Corp. 0.8 14.6 18.2 * 9.3 7.1Baldwin Technology Co., Inc. 0.10 -1.4 * 1.7 -10.1 * -32.3 *Bancorp Rhode Island, Inc. 3.0 24.7 2.1 NMF * NMF *Blue Coat Systems, Inc. 2.4 38.9 5.8 28.5 24.2Brooklyn Federal Bancorp, Inc. 0.5 -0.4 * 0.3 NMF * NMF *Complete Production Services, Inc. 1.3 15.0 3.9 9.7 6.3Constellation Energy Group, Inc. 0.5 6.2 0.9 10.9 7.2DemandTec, Inc. 5.0 -22.9 * 18.2 * -23.5 * -37.6 *GreenHouse Holdings, Inc. 0.5 -0.7 * -1.2 * -1.3 * -1.4 *HealthSpring, Inc. 0.9 16.0 9.0 NMF * NMF *Herald National Bank 1.9 -13.7 * 0.9 NMF * NMF *Inhibitex, Inc. 957.9 * -81.3 * 41.2 * -81.3 * -83.4 *Magma Design Automation, Inc. 3.4 89.9 * 23.5 * 58.8 * 32.1 *Mainline Bancorp, Inc. 1.9 1.9 1.1 NMF * NMF *McCormick & Schmick's Seafood Restaurants, Inc. 0.4 -4.2 * 2.0 -4.9 * -9.9 *Micromet, Inc. 46.0 * -13.6 * 9.6 -13.6 * -14.1 *Minera Andes, Inc. 17.3 * 16.5 3.7 16.6 16.6Morton's Restaurant Group, Inc. 0.4 20.6 -1.8 * 14.9 8.7Netlogic Microsystems, Inc. 8.6 -96.9 * 14.2 * -90.5 * 153.5 *Parkvale Financial Corp. 1.7 6.5 1.4 NMF * NMF *Pennichuck Corp. 3.7 32.6 2.4 NMF * NMF *Pharmasset, Inc. 11,539.8 * -113.5 * 67.1 * -113.7 * -114.4 *Pinnacle Data Systems, Inc. 0.7 10.9 2.1 15.1 11.7RightNow Technologies, Inc. 6.6 53.3 * 42.9 * 121.0 * 66.2 *S1 Corp. 2.5 -443.4 * 6.6 -532.3 * 54.1 *Sonesta International Hotels Corp. 1.4 -102.7 * 5.2 122.6 * 21.7SonoSite, Inc. 2.4 117.2 * 9.1 43.4 * 28.7 *Southern Union Co. 2.2 22.2 2.2 16.3 11.5State Bancorp, Inc. (Jericho, New York) 2.5 17.8 1.7 NMF * NMF *Stellar Business Bank 3.6 -138.7 * 1.0 NMF * NMF *SuccessFactors, Inc. 11.4 * -95.9 * 77.6 * -67.3 * -79.2 *Synovis Life Technologies, Inc. 3.9 37.7 3.7 25.1 21.9(1) EBIT and EBITDA multiples are not meaningful for financial institutions.* Not used in range, average or median calculations.NA = Not availableNMF = Not meaningfulCopyright © <strong>2012</strong>, FactSet Mergerstat, LLC. All rights reserved. 52
Mergerstat Control Premium Study1st Quarter <strong>2012</strong>Target NameTargetP/SalesTargetP/IncomeTargetP/Book ValueTargetTIC/EBIT (1)TargetTIC/EBITDA (1)Tekelec 1.9 542.2 * 1.9 -65.8 * 18.1Temple-Inland, Inc. 1.0 21.0 6.1 20.7 11.2Tower Bancorp, Inc. 3.8 53.7 * 1.7 NMF * NMF *Transatlantic Holdings, Inc. 1.0 -16.3 * 0.9 NMF * NMF *Valpey Fisher Corp. 1.2 27.9 2.1 20.7 17.8Vertro, Inc. 0.3 -8.7 * 6.5 -6.6 * -9.5 *Winn-Dixie Stores, Inc. 2.0 20.7 * 3.2 17.1 * 12.9Range: High 8.6 38.9 9.6 28.5 24.2Low 0.1 1.9 0.3 9.3 5.7Median: 1.6 20.3 2.1 15.7 11.2Average: 2.0 20.7 3.2 17.1 12.9(1) EBIT and EBITDA multiples are not meaningful for financial institutions.* Not used in range, average or median calculations.NA = Not availableNMF = Not meaningfulwww.mergerstat.com 53
Mergerstat Control Premium Study1st Quarter <strong>2012</strong>Target Multiples (International)Target NameTargetP/SalesTargetP/IncomeTargetP/Book ValueTargetTIC/EBIT (1)TargetTIC/EBITDA (1)Aarhus Lokalbank A/S 0.03 -0.05 * 0.04 NMF * NMF *Ace & Partners Corp. 0.00009 0.02 0.0002 2.0 0.8ADTEC Engineering Co., Ltd. 0.003 0.05 0.008 4.0 3.0Affitech A/S 0.3 -0.4 * 0.5 -0.4 * -0.4 *Aichi Machine Industry Co., Ltd. 0.003 0.2 0.006 0.1 0.03Alaska Milk Corp. 0.04 0.4 0.10 0.4 0.3Alcide Ltd. (Uster Technologies AG) 2.0 8.4 -4.9 * 10.1 7.4Aldata Solution Oyj 0.8 164.4 * -34.2 * 64.2 * 28.6 *Anvil Mining Ltd. 24.4 * 73.0 * 2.3 51.8 * 32.6 *Asia Square Holdings Ltd. (Newtree Group HoldingsLtd.)0.1 2.3 0.1 2.3 1.6Aspiro AB 0.2 -1.2 * 0.7 -1.2 * -2.6 *Atlantic Global PLC 6.8 -43.5 * 4.0 -37.5 * -38.6 *Bellamont Exploration Ltd. 1.7 -17.0 * 0.8 -41.0 * 5.3CANMARC Real Estate Investment Trust 5.2 * -9.2 * 1.3 * NMF * NMF *CIMB Securities International (Thailand) Public Co.Ltd.0.08 0.5 0.06 NMF * NMF *Contango Capital Partners Ltd. 20.1 * -895.6 * 0.9 NMF * NMF *Cosalt PLC 0.01 -0.3 * -0.2 * 71.5 * 1.5Cosway Corp. Ltd. 0.2 2.5 0.9 NMF * NMF *CPB Equity Co. Ltd. (Thai Plastic & Chemicals PublicCo. Ltd.)0.03 0.3 0.06 1.2 0.9Crocodile Gold Corp. 1.6 -35.6 * 0.8 -35.6 * 33.5 *CSI Properties Ltd. 0.06 0.1 0.05 NMF * NMF *Dan Ejendomme Holding A/S 0.2 2.3 0.4 NMF * NMF *Dhir India Investments PLC 43.8 * -11.0 * 0.9 NMF * NMF *Distinction Group, Inc. 0.5 15.6 16.3 * 11.5 9.0Elematec Corp. 0.004 0.2 0.01 0.5 0.4Emerge Oil & Gas, Inc. 0.9 -4.3 * 1.0 -6.4 * 5.8Energy Support Corp. 0.007 0.3 0.009 1.3 0.7European Goldfields Ltd. 39.3 * -43.1 * 5.9 -44.7 * -50.2 *Exxon Mobil Corp. (Esso Malaysia Bhd.) 0.03 1.1 0.3 2.3 NMF *Foncière Paris France 6.2 3.2 0.9 NMF * NMF *Futuremed Healthcare Products Corp. 0.6 10.4 -5.7 * 18.1 10.7Gennum Corp. 3.5 33.4 4.4 24.2 15.8Grande Cache Coal Corp. 3.3 27.9 3.2 19.9 13.9(1) EBIT and EBITDA multiples are not meaningful for financial institutions.* Not used in range, average or median calculations.NA = Not availableNMF = Not meaningfulCopyright © <strong>2012</strong>, FactSet Mergerstat, LLC. All rights reserved. 54
Mergerstat Control Premium Study1st Quarter <strong>2012</strong>Target NameTargetP/SalesTargetP/IncomeTargetP/Book ValueTargetTIC/EBIT (1)TargetTIC/EBITDA (1)Guld Invest Norden AB 0.02 -0.5 * 0.4 NMF * NMF *Hang Ten Group Holdings Ltd. 0.1 1.3 0.4 2.2 2.0Hirotako Holdings Bhd. 0.5 2.2 0.7 2.0 1.7HoriPro, Inc. 0.010 0.2 0.010 0.8 0.7Inmeta Crayon ASA 0.2 3.4 -9.6 * 2.9 2.3Jacques Vert PLC 0.5 15.3 2.6 14.3 10.8JAFCO Co., Ltd. (Radishbo-ya Co., Ltd.) 0.004 3.4 0.1 11.2 2.7Japan Care Service Group Corp. 0.002 0.1 -0.08 * 19.0 9.2JBIS Holdings, Inc. 0.003 -0.4 * 0.009 4.8 1.1Jerneh Asia Bhd. 0.9 -33.6 * 0.3 NMF * NMF *Kaigen Co., Ltd. 0.005 0.3 0.006 0.1 0.1Khazanah Nasional Bhd. (Proton Holdings Bhd.) 0.1 -331.0 * 0.3 38.2 * NMF *Kverneland ASA 0.07 5.9 0.4 6.0 3.4Lakeside Steel, Inc. 0.3 -3.5 * 4.2 -6.3 * -7.6 *MARUSEI Co., Ltd. 0.003 0.2 0.008 0.3 0.2Merchant Securities Group PLC 2.1 140.6 * 7.0 NMF * NMF *Met's Corp. 13.9 * -0.03 * 0.001 -0.09 * -0.09 *Mobile Doctors Group PLC 0.4 11.8 -2.3 * 13.4 12.2Montecarlo Co., Ltd. 0.0005 -0.04 * 0.01 90.2 * 35.7 *MSF Sugar Ltd. 0.4 7.6 0.2 50.2 * 24.9Mulpha International Bhd. (Manta Holdings Co. Ltd.) 0.3 -41.7 * 0.3 76.9 * 5.4Network Group Holdings PLC 0.5 16.0 -25.9 * 11.8 10.5Newave Energy Holding SA 4.8 58.0 * 3.5 39.2 * 30.8 *Novitus SA 2.7 22.9 3.8 17.9 15.2Omega Pharma NV 1.2 17.6 -3.6 * 14.5 12.1Optimum Coal Holdings Ltd. 0.2 2.5 0.2 2.7 1.4ORC Group AB 0.3 3.8 -11.5 * 2.8 1.6Patsystems PLC 1.9 18.8 2.3 15.0 9.7Peasedow Enterprises Ltd. (Chinlink InternationalHoldings Ltd.)0.06 2.0 0.08 3.5 1.8Prime Restaurants, Inc. 0.2 5.2 5.5 8.8 8.4Razor Risk Technologies Ltd. 1.1 -53.6 * 5.1 28.7 21.0Ripplewood Investments LLC (Asahi Tec Corp.) 0.003 1.0 0.02 10.5 2.5Robert Wiseman Dairies PLC 0.5 17.5 2.7 17.1 7.0RuggedCom, Inc. 3.6 53.5 * 5.1 34.1 23.1Sanjo Machine Works Ltd. 0.008 0.4 0.009 0.2 0.10Sankei Building Co., Ltd. 0.02 0.6 0.01 NMF * NMF *(1) EBIT and EBITDA multiples are not meaningful for financial institutions.* Not used in range, average or median calculations.NA = Not availableNMF = Not meaningfulwww.mergerstat.com 55
Mergerstat Control Premium Study1st Quarter <strong>2012</strong>Target NameTargetP/SalesTargetP/IncomeTargetP/Book ValueTargetTIC/EBIT (1)TargetTIC/EBITDA (1)Signature Metals Ltd. 11.7 * -0.5 * 0.05 -0.5 * -0.5 *Skylark Co., Ltd. (Kozosushi So-Honbu Co., Ltd.) 0.001 -0.02 * 0.009 -0.4 * -0.6 *SMB United Ltd. 0.6 8.8 1.1 7.8 6.7Société Vermandoise de Sucreries SA 2.1 26.9 10.5 * 9.6 8.4Solarparc AG 2.1 -29.0 * 1.3 12.6 4.7Solbar Industries Ltd. 0.2 6.3 0.5 10.8 6.9SSCP Co., Ltd. (Schramm Holding AG) 1.6 38.8 3.7 22.9 16.7Starcat Cable Network Co., Ltd. 0.008 -0.2 * 0.007 29.7 3.7Superclick, Inc. 1.2 9.4 3.4 6.6 6.4TPC Plus Bhd. 0.2 -37.3 * 0.2 74.8 * 10.2TR Shoji YK (Yasuragi Co., Ltd.) 0.006 0.9 0.01 11.4 10.7Tricolor SA 0.000005 0.00008 0.000004 5.2 3.6Unidux Electronics Ltd. 0.07 4.2 0.8 5.0 4.7Up Garage Co., Ltd. 0.001 0.06 0.01 3.4 2.6UP, Inc. 0.02 0.3 0.01 2.4 2.3Whiterock Real Estate Investment Trust 6.2 119.9 * 1.3 NMF * NMF *Wild Stream Exploration, Inc. 5.9 31.6 1.2 24.6 9.6Workplace Systems International PLC 6.0 143.8 * 40.2 * 139.7 * 65.0 *YTL Cement Bhd. 1.0 7.5 1.2 9.6 6.4Range: High 6.8 38.8 7.0 34.1 24.9Low 0.01 0.02 0.0002 0.1 0.03Median: 0.3 2.5 0.4 7.2 4.7Average: 1.3 7.7 1.2 9.6 6.4(1) EBIT and EBITDA multiples are not meaningful for financial institutions.* Not used in range, average or median calculations.NA = Not availableNMF = Not meaningfulwww.mergerstat.com 56
Mergerstat Control Premium Study1st Quarter <strong>2012</strong>Target Demographics (Domestic)Target NameTargetTickerTargetExchangeTargetCountryAcquirerCountryConsiderationNature Currency99¢ Only Stores NDN NYSE United States United States C U.S. DollarAdvanced Analogic Technologies, Inc. AATI NASDAQ United States United States C F U.S. DollarAmerican Dental Partners, Inc. ADPI NASDAQ United States United States C U.S. DollarATS Corp. ATSC NYSE AMEX United States United States C F U.S. DollarBaldwin Technology Co., Inc. BLD NYSE AMEX United States United States C U.S. DollarBancorp Rhode Island, Inc. BARI NASDAQ United States United States C,S U.S. DollarBlue Coat Systems, Inc. BCSI NASDAQ United States United States C U.S. DollarBrooklyn Federal Bancorp, Inc. BFSB NASDAQ United States United States C,S U.S. DollarComplete Production Services, Inc. CPX NYSE United States United States C,S U.S. DollarConstellation Energy Group, Inc. CEG NYSE United States United States S U.S. DollarDemandTec, Inc. DMAN NASDAQ United States United States C U.S. DollarGreenHouse Holdings, Inc. GRHU OTC United States United States S U.S. DollarHealthSpring, Inc. HS NYSE United States United States C U.S. DollarHerald National Bank HNB NYSE AMEX United States United States C U.S. DollarInhibitex, Inc. INHX NASDAQ United States United States C F U.S. DollarMagma Design Automation, Inc. LAVA NASDAQ United States United States C U.S. DollarMainline Bancorp, Inc. MNPA OTC United States United States C U.S. DollarMcCormick & Schmick's SeafoodRestaurants, Inc.MSSR NASDAQ United States United States C F U.S. DollarMicromet, Inc. MITI NASDAQ United States United States C F U.S. DollarMinera Andes, Inc. MAI NULL United States United States S U.S. DollarMorton's Restaurant Group, Inc. MRT NYSE United States United States C F U.S. DollarNetlogic Microsystems, Inc. NETL NASDAQ United States United States C U.S. DollarParkvale Financial Corp. PVSA NASDAQ United States United States S U.S. DollarPennichuck Corp. PNNW NASDAQ United States United States C U.S. DollarPharmasset, Inc. VRUS NASDAQ United States United States C F U.S. DollarPinnacle Data Systems, Inc. PNS NYSE AMEX United States United States C U.S. DollarRightNow Technologies, Inc. RNOW NASDAQ United States United States C U.S. DollarS1 Corp. SONE NASDAQ United States United States C,S H U.S. DollarSonesta International Hotels Corp. SNSTA NASDAQ United States United States C U.S. DollarSonoSite, Inc. SONO NASDAQ United States Japan C F U.S. DollarSouthern Union Co. SUG NYSE United States United States C,S U.S. DollarState Bancorp, Inc. (Jericho, New York) STBC NASDAQ United States United States S U.S. DollarStellar Business Bank SLRB OTC United States United States S U.S. DollarSuccessFactors, Inc. SFSF NYSE United States Germany C F U.S. DollarSynovis Life Technologies, Inc. SYNO NASDAQ United States United States C U.S. DollarTekelec TKLC NASDAQ United States United States C U.S. DollarTemple-Inland, Inc. TIN NYSE United States United States C U.S. DollarTower Bancorp, Inc. TOBC NASDAQ United States United States C,S U.S. DollarTransatlantic Holdings, Inc. TRH NYSE United States United States C,S U.S. DollarCopyright © <strong>2012</strong>, FactSet Mergerstat, LLC. All rights reserved. 57
Mergerstat Control Premium Study1st Quarter <strong>2012</strong>Target NameTargetTickerTargetExchangeTargetCountryAcquirerCountryConsiderationNature CurrencyValpey Fisher Corp. VPF NASDAQ United States United States C U.S. DollarVertro, Inc. VTRO NASDAQ United States United States S U.S. DollarWinn-Dixie Stores, Inc. WINN NASDAQ United States United States C U.S. Dollarwww.mergerstat.com 58
Mergerstat Control Premium Study1st Quarter <strong>2012</strong>Target Demographics (International)Target NameTargetTickerTargetExchangeTargetCountryAcquirerCountryConsiderationNature CurrencyAarhus Lokalbank A/S AARHUS Copenhagen Denmark Denmark S Danish KroneAce & Partners Corp. 32930 Korea StockExchangeSouth Korea South Korea S Korean WonADTEC Engineering Co., Ltd. 6260 JASDAQ Japan Japan C F Japanese YenAffitech A/S AFFI Copenhagen Denmark Cyprus C N Danish KroneAichi Machine Industry Co., Ltd. 7263 Tokyo Japan Japan S Japanese YenAlaska Milk Corp. AMC Manila Philippines Netherlands C N Philippine PesoAlcide Ltd. (Uster Technologies AG) USTN Swiss SIXExchangeSwitzerland Japan C Swiss FrancAldata Solution Oyj ALD1V Helsinki Finland United States C F EuroAnvil Mining Ltd. AVM Toronto Australia Hong Kong C F Australian DollarAsia Square Holdings Ltd. (NewtreeGroup Holdings Ltd.)1323 Hong Kong Hong Kong BritishVirginIslandsCHong KongDollarAspiro AB ASP Stockholm Sweden Norway C F Swedish KronaAtlantic Global PLC ATL London StockExchangeBellamont Exploration Ltd. BMX.A CanadianVentureCANMARC Real Estate InvestmentTrustCIMB Securities International(Thailand) Public Co. Ltd.Contango Capital Partners Ltd. CCQ AustralianSecuritiesExchangeCosalt PLC CSLT London StockExchangeUnitedKingdomUnitedKingdomC F British PoundCanada Canada C,S Canadian DollarCMQ.UT Toronto Canada Canada C Canadian DollarCIMBI Bangkok Thailand Malaysia C Thai BahtAustralia Australia C F Australian DollarUnitedKingdomUnitedKingdomC N British PoundCosway Corp. Ltd. 288 Hong Kong Hong Kong Malaysia C Hong KongDollarCPB Equity Co. Ltd. (Thai Plastic &Chemicals Public Co. Ltd.)TPC Bangkok Thailand Thailand C Thai BahtCrocodile Gold Corp. CRK Toronto Canada United States C N Canadian DollarCSI Properties Ltd. 497 Hong Kong Hong Kong BritishVirginIslandsC N Hong KongDollarDan Ejendomme Holding A/S DEH Copenhagen Denmark Denmark C F Danish KroneDhir India Investments PLC DHIR London StockExchangeUnitedKingdomUnitedKingdomC F British PoundDistinction Group, Inc. GD Toronto Canada Canada C Canadian DollarCopyright © <strong>2012</strong>, FactSet Mergerstat, LLC. All rights reserved. 59
Mergerstat Control Premium Study1st Quarter <strong>2012</strong>Target NameTargetTickerTargetExchangeTargetCountryAcquirerCountryConsiderationNature CurrencyElematec Corp. 2715 Tokyo Japan Japan C F Japanese YenEmerge Oil & Gas, Inc. EME Toronto Canada Canada S Canadian DollarEnergy Support Corp. 6646 Osaka Japan Japan C F Japanese YenEuropean Goldfields Ltd. EGU Toronto Canada Canada C,S Canadian DollarExxon Mobil Corp. (Esso MalaysiaBhd.)3042 Kuala Lumpur Malaysia Philippines C MalaysianRinggitFoncière Paris France FPF Euronext Paris France France C H EuroFuturemed Healthcare Products Corp. FMD Toronto Canada Canada C F Canadian DollarGennum Corp. GND Toronto Canada United States C Canadian DollarGrande Cache Coal Corp. GCE Toronto Canada Japan C Canadian DollarGuld Invest Norden AB GULD Stockholm Sweden Sweden S N Swedish KronaHang Ten Group Holdings Ltd. 448 Hong Kong Hong Kong BritishVirginIslandsC F Hong KongDollarHirotako Holdings Bhd. 9644 Kuala Lumpur Malaysia Malaysia C N MalaysianRinggitHoriPro, Inc. 9667 Tokyo Japan Japan C F Japanese YenInmeta Crayon ASA INM Oslo Norway Norway C F Norwegian KroneJacques Vert PLC JQV London StockExchangeJAFCO Co., Ltd. (Radishbo-ya Co.,Ltd.)UnitedKingdomUnited States C F British Pound3146 JASDAQ Japan Japan C F Japanese YenJapan Care Service Group Corp. 7566 JASDAQ Japan Japan C F Japanese YenJBIS Holdings, Inc. 3820 Tokyo Japan Japan C F Japanese YenJerneh Asia Bhd. 6394 Kuala Lumpur Malaysia Malaysia C N MalaysianRinggitKaigen Co., Ltd. 8000 Osaka Japan Japan S Japanese YenKhazanah Nasional Bhd. (ProtonHoldings Bhd.)5304 Kuala Lumpur Malaysia Malaysia C MalaysianRinggitKverneland ASA KVE Oslo Norway Japan C F Norwegian KroneLakeside Steel, Inc. LS CanadianVentureCanada United States C Canadian DollarMARUSEI Co., Ltd. 2434 JASDAQ Japan Japan C F Japanese YenMerchant Securities Group PLC MERC London StockExchangeUnitedKingdomSouth Africa C F British PoundMet's Corp. 4744 Tokyo Japan Japan C Japanese YenMobile Doctors Group PLC MDG London StockExchangeUnitedKingdomUnitedKingdomSBritish PoundMontecarlo Co., Ltd. 7569 JASDAQ Japan Japan S Japanese Yenwww.mergerstat.com 60
Mergerstat Control Premium Study1st Quarter <strong>2012</strong>Target NameTargetTickerTargetExchangeMSF Sugar Ltd. MSF AustralianSecuritiesExchangeMulpha International Bhd. (MantaHoldings Co. Ltd.)Network Group Holdings PLC NGH London StockExchangeNewave Energy Holding SA NWEN Swiss SIXExchangeTargetCountryAcquirerCountry936 Hong Kong Hong Kong BritishVirginIslandsConsiderationNature CurrencyAustralia Thailand C F Australian DollarUnitedKingdomUnitedKingdomCHong KongDollarC N British PoundSwitzerland Switzerland C F Swiss FrancNovitus SA NVS Warsaw Poland Poland S Polish ZlotyOmega Pharma NV OME EuronextBrusselsBelgium Belgium C F EuroOptimum Coal Holdings Ltd. OPT Johannesburg South Africa Switzerland C F South AfricanRandORC Group AB ORC Stockholm Sweden Switzerland C F Swedish KronaPatsystems PLC PTS London StockExchangePeasedow Enterprises Ltd. (ChinlinkInternational Holdings Ltd.)UnitedKingdomUnitedKingdom997 Hong Kong Hong Kong BritishVirginIslandsC F British PoundCHong KongDollarPrime Restaurants, Inc. EAT Toronto Canada Canada C Canadian DollarRazor Risk Technologies Ltd. RZR AustralianSecuritiesExchangeRipplewood Investments LLC (AsahiTec Corp.)Robert Wiseman Dairies PLC RWD London StockExchangeAustralia Canada C F Australian Dollar5606 Tokyo Japan Japan C F Japanese YenUnitedKingdomGermany C F British PoundRuggedCom, Inc. RCM Toronto Canada Germany C F Canadian DollarSanjo Machine Works Ltd. 6437 Tokyo Japan Japan C Japanese YenSankei Building Co., Ltd. 8809 Tokyo Japan Japan C F Japanese YenSignature Metals Ltd. SBL AustralianSecuritiesExchangeSkylark Co., Ltd. (Kozosushi So-HonbuCo., Ltd.)Australia Bermuda S F Australian Dollar9973 JASDAQ Japan Japan C F Japanese YenSMB United Ltd. S16 Singapore Singapore Singapore C N Singapore DollarSociété Vermandoise de Sucreries SA VERM Euronext Paris France France C EuroSolarparc AG SLX Frankfurt Germany Germany S N EuroSolbar Industries Ltd. SLBR Tel Aviv Israel United States C Israeli NewShekelSSCP Co., Ltd. (Schramm Holding AG) 955 Hong Kong Germany Netherlands C F Eurowww.mergerstat.com 61
Mergerstat Control Premium Study1st Quarter <strong>2012</strong>Target NameTargetTickerTargetExchangeTargetCountryAcquirerCountryConsiderationNature CurrencyStarcat Cable Network Co., Ltd. 4339 JASDAQ Japan Japan C F Japanese YenSuperclick, Inc. SPCK OTC Canada United States C Canadian DollarTPC Plus Bhd. 7176 Kuala Lumpur Malaysia Malaysia C N MalaysianRinggitTR Shoji YK (Yasuragi Co., Ltd.) 8919 Nagoya Japan Japan C F Japanese YenTricolor SA TRICOLORSA Santiago Chile Peru C N Chilean PesoUnidux Electronics Ltd. 5AN Singapore Singapore United States C N Singapore DollarUp Garage Co., Ltd. 3311 Tokyo Japan Japan C F Japanese YenUP, Inc. 9630 Tokyo Japan Japan C F Japanese YenWhiterock Real Estate Investment Trust WRK.UT Toronto Canada Canada C,S Canadian DollarWild Stream Exploration, Inc. WSX CanadianVentureWorkplace Systems International PLC WSI London StockExchangeCanada Canada S,X Canadian DollarUnitedKingdomUnitedKingdomC N British PoundYTL Cement Bhd. 8737 Kuala Lumpur Malaysia Malaysia S N MalaysianRinggitwww.mergerstat.com 62
Mergerstat Control Premium Study1st Quarter <strong>2012</strong>Company Descriptions (Domestic)Target Name Target Business Description Acquirer Business Description99¢ Only Stores Operates discount retail stores Provides investment management servicesAdvanced Analogic Technologies,Inc.American Dental Partners, Inc.ATS Corp.Baldwin Technology Co., Inc.Bancorp Rhode Island, Inc.Blue Coat Systems, Inc.Provides specialized power managementsemiconductors for use in a variety ofcomputing, communications, and consumerelectronics applicationsProvides business services to multidisciplinarydental group practicesProvides systems integration and informationtechnology servicesDevelops, manufactures and sells automationequipment and accessories for the printingindustryProvides banking services through its whollyowned subsidiaryProvides secure proxy appliances that controluser communications over the InternetDesigns, develops, manufactures and marketsproprietary semiconductor productsAlternative investment managerProvides information technology andengineering servicesAlternative investment managerProvides banking servicesPrivate group led by Thoma Bravo LLC andOntario Teachers' Pension PlanBrooklyn Federal Bancorp, Inc. Operates as a bank holding company State-chartered savings bankComplete Production Services, Inc. Provides oil and gas field exploration services Manufactures, rents, and sells oilfieldequipmentsConstellation Energy Group, Inc. Provides energy solutions and services Purchases, transmits and distributes electricityDemandTec, Inc.GreenHouse Holdings, Inc.HealthSpring, Inc.Provides collaborative optimization networkof software servicesConstructs houses and distributes ethanolproductsProvides healthcare and medicare serviceplansManufactures various computer productsthrough the use of advanced informationtechnologyProvides business and technology consultingservicesProvides life, accident and health insuranceproducts as well as financial servicesHerald National Bank Provides commerical banking services Provides commercial banking servicesInhibitex, Inc. Develops drugs Manufactures pharmaceuticals productsMagma Design Automation, Inc.Develops software for electronic designautomationDevelops and provides software baseddesigning solutions for the semiconductorindustryMainline Bancorp, Inc. Provides regional banking services Operates as a bank holding company withinterest in providing banking servicesMcCormick & Schmick's SeafoodRestaurants, Inc.Micromet, Inc.Owns and operates seafood restaurantsResearches, develops and commercializesantibody-based productsOwns and operates full-service and casualdining family restaurantsDevelops, manufactures and markets humantherapeutic products based on cellular biologyMinera Andes, Inc. Explores and mines for gold, silver and copper Explores and mines for goldMorton's Restaurant Group, Inc. Owns and operates restaurants Led by a private investor groupNetlogic Microsystems, Inc. Manufactures semiconductors Designs, develops and suppliessemiconductors for wired and wirelesscommunicationsParkvale Financial Corp.Operates as unitary savings and loan holdingcompanyNational commercial bankCopyright © <strong>2012</strong>, FactSet Mergerstat, LLC. All rights reserved. 63
Mergerstat Control Premium Study1st Quarter <strong>2012</strong>Target Name Target Business Description Acquirer Business DescriptionPennichuck Corp.Pharmasset, Inc.Pinnacle Data Systems, Inc.RightNow Technologies, Inc.S1 Corp.Operates as a holding company with interest inthe collection, storage, treatment anddistribution of potable waterDiscovers, develops and commercializes noveldrugs for viral infectionsProvides applications specific hardware andglobal support solutionsProvides customer relationship managementsoftware and servicesProvides customer interaction softwaresolutionsLocal level government authorityDiscovers, develops and commercializestherapeutic products and treatments for viraldiseasesDistributes electronic components, enterprisecomputing and storage products andembedded subsystemsDesigns, develops, markets, and supports adiversified line of business software productsInstalls software products and services forfinancial institutionsSonesta International Hotels Corp. Engages in the operation of hotels Real estate investment trustSonoSite, Inc. Develops portable ultrasound imaging systems Manufactures and markets photographic films,cameras, copiers, printers, fax machines andother imaging related equipmentSouthern Union Co.State Bancorp, Inc. (Jericho, NewYork)Gathers, processes, transports, stores anddistributes natural gasOperates as a bank holding companyProvides natural gas pipeline transportationand transmission servicesOperates as a bank holding companyStellar Business Bank A state commercial bank Provides banking servicesSuccessFactors, Inc.Provides workforce performance managementsoftware solutionsProvides e-business software solutionsSynovis Life Technologies, Inc. Manufactures medical devices Produces and supplies specialized medicalproducts including biopharmaceuticals andmedical equipmentTekelecTemple-Inland, Inc.Provides communication core networksolutionsManufactures corrugated packaging andbuilding productsLed by private groupManufactures paper, pulp, wood products andpaperboard packaging productsTower Bancorp, Inc. Operates as a bank holding company Provides financial and commercial bankingservicesTransatlantic Holdings, Inc. Provides property and casualty reinsurance Provides property and casualty reinsuranceand insurance and financial servicesValpey Fisher Corp.Vertro, Inc.Designs and manufactures precision crystaloscillatorsProvides online advertising and internetmarketing servicesManufactures electronic components andsensorsProvides online marketing servicesWinn-Dixie Stores, Inc. Operates retail self service food stores Alternative investment managerwww.mergerstat.com 64
Mergerstat Control Premium Study1st Quarter <strong>2012</strong>Company Descriptions (International)Target Name Target Business Description Acquirer Business DescriptionAarhus Lokalbank A/S Provides commercial banking services Engages in the sale, import, export ofelectronics, fuels, metals, constructionmaterials, and chemicals and providesinformation technology, financial and logisticservicesAce & Partners Corp.ADTEC Engineering Co., Ltd.Affitech A/SManufactures wireless communicationsequipmentDesigns, manufactures and distributeslithographic machines for printed circuitboards and assembling machinesResearches and develops human antibodytherapeuticsPrivate group led by Mr. Paresh VasaniProvides information technology, paytelevision,and multimediatelecommunications servicesAlternative investment managerAichi Machine Industry Co., Ltd. Manufactures automobile parts Acquisition vehicleAlaska Milk Corp.Alcide Ltd. (Uster TechnologiesAG)Manufactures and distributes liquid, powderedand ultra-heat treated milk productsManufactures and markets quality controlequipment for testing fiber, yarn and fabricDesigns, researches, develops, manufacturesand distributes optical storage IC chipsetsWholesales cotton-based knitted garments forwomen, children and infants; develops andmanages real estate propertiesAldata Solution Oyj Provides retail and logistics software solutions Manufactures farming fertilizers andpesticidesAnvil Mining Ltd.Asia Square Holdings Ltd. (NewtreeGroup Holdings Ltd.)Aspiro ABAtlantic Global PLCBellamont Exploration Ltd.CANMARC Real Estate InvestmentTrustCIMB Securities International(Thailand) Public Co. Ltd.Contango Capital Partners Ltd.Cosalt PLCProvides mining, exploration and copper andsilver mineral processing servicesOperates as an investment holding companywith interests in the manufacture and sale ofhygienic disposables for household andclinical uses, as well as the sale of chemicalsand household consumablesDevelops communication video and musicproducts and provides information technologyservicesEngages in the development and sale ofcomputer software, maintenance and relatedservicesEngages in the acquisition and exploration ofoil and gas propertiesOperates as a real estate investment trustProvides brokerage servicesProvides financial services specializing inlisted and unlisted securities in the financialservices sectorProvides safety and protection services to theoil and marine industriesProcesses and wholesales soybeans, corn,wheat and cocoaAcquisition vehicleManufactures automobiles and other motorvehiclesDevelops medical diagnostic productsManufactures bioactive ingredientsAlternative investment managerOperates a holding company with interests inadvertisement servicesClosed-End Investment Fund/InvestmentTrustAlternative investment managerCosway Corp. Ltd. Invests and develops property Provides offshore contract drilling servicesCPB Equity Co. Ltd. (Thai Plastic &Chemicals Public Co. Ltd.)Manufactures and distributes petrochemicalresin compoundsManufactures and wholesales pachinkomachinesCopyright © <strong>2012</strong>, FactSet Mergerstat, LLC. All rights reserved. 65
Mergerstat Control Premium Study1st Quarter <strong>2012</strong>Target Name Target Business Description Acquirer Business DescriptionCrocodile Gold Corp. Explores and mines for gold properties Manufactures household cooking appliancesand other equipmentCSI Properties Ltd.Invests in real estate and other miscellaneousinvestmentsExplores for and mines for coals and otherminerals and engages in engineering andlogistics servicesDan Ejendomme Holding A/S Manages properties and real estates Provides on-line travel servicesDhir India Investments PLC Operates as an investment company Manufactures and sells POLAIR refrigerationequipmentDistinction Group, Inc. Provides janitorial and maintenance services Operates as an investment holding companyElematec Corp. Trades and wholesales electronic components Provides investment servicesEmerge Oil & Gas, Inc.Energy Support Corp.European Goldfields Ltd.Exxon Mobil Corp. (Esso MalaysiaBhd.)Acquires, develops, explores and produces oiland natural gasManufactures and markets electricalequipmentEngages in acquisition, exploration anddevelopment of gold propertiesManufactures and markets petroleum productsManufactures automatic and manualtransmissions for commercial cars, aircraftsand marine vesselsOperates as an investment holding companyManufactures and distributes notebookcomputers, servers, and business softwareProvides call center servicesFoncière Paris France Owns and manages commercial real estate Provides power generation servicesFuturemed Healthcare ProductsCorp.Supplies healthcare productsProvides analytical tools and informationservicesGennum Corp. Develops and designs semiconductor solutions Distributes petroleum productsGrande Cache Coal Corp. Engages in coal mining Explores and mines gold, nickel and otherbase metalsGuld Invest Norden AB Develops, designs and sells jewelry Provides investment advisoryHang Ten Group Holdings Ltd.Designs, distributes and retails apparels andaccessoriesDevelops computer software; provides ITtraining servicesHirotako Holdings Bhd. Engages in making automotive components Acquires, develops and manages intellectualproperty assetsHoriPro, Inc. Operates a talent agency Acquisition vehicleInmeta Crayon ASAJacques Vert PLCJAFCO Co., Ltd. (Radishbo-ya Co.,Ltd.)Provides information technology consultingservicesManufactures, designs, wholesales and retailswomenswear garmentsProvides farm products and food homedelivery servicesOperates as a holding company with interestsin manufacturing beverages and other luxurygoodsManufactures chemicals and pharmaceuticalsAlternative investment managerJapan Care Service Group Corp. Operates nursing care facilities Alternative investment managerJBIS Holdings, Inc. Provides software and technology services Develops, implements and supportsmidstream solutions for the oil and gasindustryJerneh Asia Bhd. Provides insurance services Engages in the sale, import, export ofelectronics, fuels, metals, constructionmaterials, and chemicals and providesinformation technology, financial and logisticserviceswww.mergerstat.com 66
Mergerstat Control Premium Study1st Quarter <strong>2012</strong>Target Name Target Business Description Acquirer Business DescriptionKaigen Co., Ltd. Distributes pharmaceuticals Operates as an investment holding companyKhazanah Nasional Bhd. (ProtonHoldings Bhd.)Kverneland ASAManufactures, assembles, and trades motorvehicles and related productsDevelops, produces and distributesagricultural machinery and servicesA private group led y Mr Tianfu Yang,chairman and CEOProvides private health insurance servicesLakeside Steel, Inc. Manufactures steel pipe and tubes Alternative investment managerMARUSEI Co., Ltd.Provides construction, testing andmaintenance of various types of buildingsBrews and distributes beer and spiritsMerchant Securities Group PLC Provides financial and investment services Acquisition vehicle held by Mr. WangHongchunMet's Corp.Mobile Doctors Group PLCMontecarlo Co., Ltd.MSF Sugar Ltd.Mulpha International Bhd. (MantaHoldings Co. Ltd.)Network Group Holdings PLCNewave Energy Holding SANovitus SAOmega Pharma NVOptimum Coal Holdings Ltd.ORC Group ABPatsystems PLCPeasedow Enterprises Ltd. (ChinlinkInternational Holdings Ltd.)Prime Restaurants, Inc.Razor Risk Technologies Ltd.Ripplewood Investments LLC(Asahi Tec Corp.)Develops and provides digital securitysystems and graphic application softwareProvides medical evidence and suppliesmedico-legal reports for personal injuryclaimsRetails automotive parts and accessories andprovides inspection and repair servicesGrowing of sugar cane and manufacture ofraw sugarDistributes tower cranes; provides rental andmaintenance services for tower cranesProvides specialist recruitment solutions topublic, professional, and technical sectorsDevelops, manufactures and sellsuninterruptible power equipment and suppliesManufactures cash registers, weighing scales,bar code readers and labelersManufactures and distributes pharmaceuticalproductsExplores, produces and sales low sulphurthermal coalDevelops and markets software for trading inreal timeProvides high performance electronic tradingtoolsDesigns, manufactures and installs woodenfurnitureFranchises, owns and operates restaurants andpubsProvides risk management technology andconsulting solutionsManufactures transmission cases and alloywheelsOperates as a marketplace for derivatives andequity productsOperates retail businessProvides education and publishing servicesEngages in petroleum exploration andproduction, refining, chemicals and oilproduct marketingInternational commercial bankProvides investment solutionsProvides online hotel reservation servicesDevelops, manufactures and marketspharmaceutical productsOperates as an investment holding companyManufactures audio and video equipment;develops video game softwareManufactures and distributes sample andassay technology products for preanalyticalsample preparationsPrincipal activities are generation and sale ofelectricityOperates as an investment holding companyExplores, develops and mines iron oreProvides non-switched and local-accesstelecommunications servicesManufactures and distributes steel productswww.mergerstat.com 67
Mergerstat Control Premium Study1st Quarter <strong>2012</strong>Target Name Target Business Description Acquirer Business DescriptionRobert Wiseman Dairies PLCRuggedCom, Inc.Sanjo Machine Works Ltd.Sankei Building Co., Ltd.Processes and distributes milk and milkproductsDesigns and manufactures industrial strengthnetwork hardware and softwareManufactures and sells forged products,machinery and diesManages and leases properties, theaters andoffice buildings as well as provides housingand commercial and office buildingconstruction servicesManufactures and sells digital multifunctiondevices, plain paper copying machines, laserbeam printers, jet printers, cameras andsteppers and alignersEngages in ocean transportation businessesA private group led by Baiyin NonferrousMetal (Group) Co Ltd, China-AfricaDevelopment Fund Co Ltd, and Long MarchCapital LtdProvides private equity servicesSignature Metals Ltd. Explores and mines for gold and minerals Operates as an investment companySkylark Co., Ltd. (Kozosushi So-Honbu Co., Ltd.)SMB United Ltd.Société Vermandoise de SucreriesSASolarparc AGOperates a nation-wide chain of take-awaysushi storesOperates as an investment holding companywith interests in manufacturing anddistributing switchgears and monitoringproductsManufactures and refines sugar and all sugarproductsDevelops, constructs and operates windenergy and solar energy parksOperates as a bank holding companyDevelops and distributes pharmaceuticalsOperates an investment holding company withinterests in manufacturing and distribution ofapparel productsExplores and produces oil and gasSolbar Industries Ltd. Manufactures soybean products Operates as an investment holding companySSCP Co., Ltd. (Schramm HoldingAG)Manufactures and supplies a range of coatingsfor the automotive and electrical industriesPrivate group led by Sit Seng & Sons RealtySdn Bhd, Aikbee Timbers Sdn Bhd, Lim YenSiew @ Tan Sit Seng, Yap Kin Thai , YapKeat Choon, Tan Ai Hooi and Datuk Tan AikHongStarcat Cable Network Co., Ltd. Provides cable television and Internet services Produces industrial organic chemicalsSuperclick, Inc.TPC Plus Bhd.TR Shoji YK (Yasuragi Co., Ltd.)Provides Internet Protocol (IP) networkdesign, deployment and infrastructuremanagement services for the hospitality,healthcare and university sectorsManufactures and markets poultry farmingand poultry feedsEngages in renovation and sale of secondhandhousingPrivate group led by the management ofSerma Technologies SA and Chequers CapitalXV FCPRMines and markets low-sulfur coalManufactures pharmaceutical products andhospital equipmentTricolor SA Decorative and Industrial Paints Operates as a holding companyUnidux Electronics Ltd.Up Garage Co., Ltd.UP, Inc.Engages in trading and distribution ofelectronic components, catering mainly toJapanese manufacturersEngaged in the sale of secondhand automobileand motorcycle partsOperates a chain of cram schools and tutorialsessions for primary, junior high and highschool studentsManufactures household cooking appliancesand other equipmentOperates as a special purpose vehicleManufactures and distributes laboratoryapparatus, analytical instruments, opticalinstruments, and lenseswww.mergerstat.com 68
Mergerstat Control Premium Study1st Quarter <strong>2012</strong>Target Name Target Business Description Acquirer Business DescriptionWhiterock Real Estate InvestmentTrustReal Estate Investment Trust/REITAcquisition vehicle let by Mr. IkuoTakashimaWild Stream Exploration, Inc. Produces oil and gas Explores gold and silverWorkplace Systems InternationalPLCYTL Cement Bhd.Develops and supplies software products andprovides consulting servicesManufactures cement and ready mixedconcrete cementProduces house construction materialsincluding window sashes, tiles, sanitaryequipments and related partsAcquisition vehicle let by Ms. KumikoKarayama and Mr. Tatsuya Katayamawww.mergerstat.com 69
Mergerstat Control Premium Study1st Quarter <strong>2012</strong>Standard Industrial Classification (SIC) Summary01-09 Agriculture and Forestry10-14 Mining10 Metal mining12 Coal mining13 Oil and gas extraction14 Mining and quarrying of nonmetallic minerals, except fuels15-17 Construction15 Building construction16 Heavy construction17 Construction – special trade contractors20-39 Manufacturing20 Food and kindred products21 Tobacco products22 Textile mill products23 Apparel24-26 Lumber, furniture and paper27 Printing, publishing and allied industries28 Chemicals and allied products29 Petroleum refining30 Rubber and miscellaneous plastics products31 Leather and leather products32-33 Stone, concrete products and primary metals34-35 Fabricated metal products, industrial machinery and computers36 Electrical and electronic machinery and equipment37 Transportation equipment38 Controlling instruments; photographic, medical and optical goods; and clocks39 Miscellaneous manufacturing40-47 Transportation40 Railroad transportation41 Local and suburban transit42 Motor freight transportation43 U.S. Postal Service44 Water transportation45 Air transportation46 Pipelines47 Transportation services48 Communications49 Electric, Gas, and Sanitary Services50-51 Wholesale Trade50 Durable goods51 Nondurable goodsCopyright © <strong>2012</strong>, FactSet Mergerstat, LLC. All rights reserved. 70
Mergerstat Control Premium Study1st Quarter <strong>2012</strong>52-59 Retail Trade52 Building materials and mobile home dealers53 General merchandise stores54 Food stores55 Automotive dealers and gasoline service stations56 Apparel stores57 Furniture and equipment stores58 Eating and drinking places59 Miscellaneous retail60-67 Finance, Insurance, and Real Estate60-61 Banking and credit agencies62 Security and commodity brokers and related services63-64 Insurance companies and agents65 Real estate67 Holding companies and other investment offices70-99 Services and Other70 Hotels and lodging places72 Personal services73-78 Business services79 Amusement and recreation services80-82 Health services83-84 Social services, museums and zoos86 Membership organizations87 Engineering, accounting, research and management88-89 Private households and miscellaneous services91 Government agencies99 Nonclassifiable establishmentsCopyright © <strong>2012</strong>, FactSet Mergerstat, LLC. All rights reserved. 71
Mergerstat Control Premium Study1st Quarter <strong>2012</strong>Description of TermsConsideration CodesControl PremiumC = CashD = DebtL = LiabilitiesS = StockX = Other (warrants, contingent payments, etc.)Mergerstat’s control premium is computed by comparing the per share totalconsideration price for one share of the target company’s common stock to theMergerstat unaffected price. This pre-announcement price is selected byMergerstat and based on volume and price fluctuations during the period priorto the acquisition announcement.Guidelines for control premium calculation:• Determination of announcement data• Price and volume retrieval prior to announcement date• Analysis of data for significant fluctuations in price and volume• Selection of a price just prior to this point of change in representativenormal pricing activity• If no significant price and volume fluctuations occur, selection of the priceone day prior to the announcement date• Determination of the final price that the acquirer offers, per share, topurchase the target company's common stock, per terms of a tender offer• Computation of the control premium using the following equation:Purchase Price - Mergerstat Unaffected PriceMergerstat Unaffected PriceMergerstat Unaffected PricePercentage Common Held AfterMinority Discount FormulaPercentage Common Previously HeldPremium 1 DayPremium 1 WeekPremium 1 MonthPremium 2 MonthsTarget company’s common stock price per share unaffected by the acquisitionannouncement. Selected by Mergerstat after analyzing each transaction (seeTransaction Information).Percent of the target company’s common shares held by the acquiring companyfollowing the transaction.1-(1/(1+Control Premium))Percent of the target company’s common shares owned by the acquiringcompany prior to the transaction.Premium computed by comparing the price ultimately paid to the common stockprice one day prior to the announcement date.Premium computed by comparing the price ultimately paid to the common stockprice one week prior to the announcement date.Premium computed by comparing the price ultimately paid to the common stockprice one month prior to the announcement date.Premium computed by comparing the price ultimately paid to the common stockprice two months prior to the announcement date.Copyright © <strong>2012</strong>, FactSet Mergerstat, LLC. All rights reserved. 72
Mergerstat Control Premium Study1st Quarter <strong>2012</strong>Price 1 DayPrice 1 WeekPrice 1 MonthPrice 2 MonthsPurchase Price Per ShareTarget Book ValueTarget EBITTarget EBITDATarget IncomeTarget Market Value of EquityTarget Price/Book Value RatioTarget Price/Earnings RatioTarget Price/Sales RatioTarget company’s common stock price per share one day prior to the acquisitionannouncement date.Target company’s common stock price per share one week prior to theacquisition announcement date.Target company’s common stock price per share one month prior to theacquisition announcement date.Target company’s common stock price per share two months prior to theacquisition announcement date.The total consideration paid per share for the target company’s shares.Target company’s book value, sometimes referred to as shareholder’s equity ornet tangible assets, is based on the latest reported period prior to thetransaction’s announcement date. Book value is reported in millions androunded.Target company’s earnings before interest and taxes (“EBIT”) based on thelatest reported 12-month period prior to the transaction’s announcement date.EBIT is reported in millions of dollars and rounded.Target company’s earnings before interest, taxes, depreciation and amortization(“EBITDA”) based on the latest reported 12-month period prior to thetransaction’s announcement date. EBITDA is reported in millions of dollars androunded.Target company’s net income (loss), excluding extraordinary items, based onthe latest reported 12-month period prior to the transaction’s announcementdate. Income is reported in millions of dollars and rounded.Target market value of equity based on the purchase price per share times totalshares outstanding reported in the period prior to the transaction’sannouncement date. Market value of equity is reported in millions of dollars androunded.Purchase price-to-book value ratio for the target company based on the impliedmarket value of equity divided by book value of the target company.Purchase price-to-earnings ratio for the target company based on the impliedmarket value of equity divided by the latest reported 12-month net income priorto the announcement date.Purchase price-to-sales ratio for the target company based on the implied marketvalue equity divided by the latest reported 12-month sales prior to theannouncement date.Copyright © <strong>2012</strong>, FactSet Mergerstat, LLC. All rights reserved. 73
Mergerstat Control Premium Study1st Quarter <strong>2012</strong>Target SalesTarget TICTarget TIC/EBIT RatioTarget TIC/EBITDA RatioTotal Deal ValueTarget company’s sales based on the latest reported 12-month period prior tothe transaction’s announcement date. Sales are reported in millions of dollarsand rounded.Target company’s implied total invested capital (“TIC”) based on the sum ofimplied market value of equity plus the face value of total interest bearing debtand the book value of preferred stock outstanding prior to the announcementdate.Target TIC-to-EBIT ratio based on the target TIC divided by the latest reported12-month earnings before interest and taxes prior to the announcement date.Target TIC-to-EBITDA ratio based on the target TIC divided by the latestreported 12-month earnings before interest, taxes, depreciation and amortizationprior to the announcement date.The aggregate purchase price given to shareholders of the target company’scommon stock by the acquiring company. Shown in millions of dollars androunded.Copyright © <strong>2012</strong>, FactSet Mergerstat, LLC. All rights reserved. 74