Control Premium Study 2nd Quarter 2010 - BVMarketData
Control Premium Study 2nd Quarter 2010 - BVMarketData
Control Premium Study 2nd Quarter 2010 - BVMarketData
- No tags were found...

Create successful ePaper yourself
Turn your PDF publications into a flip-book with our unique Google optimized e-Paper software.
Mergerstat <strong>Control</strong> <strong>Premium</strong> <strong>Study</strong><strong>2nd</strong> <strong>Quarter</strong> <strong>2010</strong>Table of ContentsPageAbout the <strong>Control</strong> <strong>Premium</strong> <strong>Study</strong> .........................................................................................ii<strong>Control</strong> <strong>Premium</strong> Analytics...................................................................................................... 1<strong>Control</strong> <strong>Premium</strong> Comparative Results.................................................................................. 212-Month Median <strong>Premium</strong>s by Industry .............................................................................. 3<strong>Premium</strong>s vs. S&P 500 Index ................................................................................................... 4<strong>2nd</strong> <strong>Quarter</strong> <strong>2010</strong> Summary Statistics .................................................................................... 512-Month Summary Figures .................................................................................................... 5<strong>Control</strong> <strong>Premium</strong>s by Industry ................................................................................................ 6Transaction InformationTarget Name and SIC Number (Domestic)........................................................................... 22Target Name and SIC Number (International) .................................................................... 24Announce & Closing Dates, Total Deal Value (Domestic) ................................................. 27Announce & Closing Dates, Total Deal Value (International) ............................................ 29Purchase Price/Share – Mergerstat Unaffected Price (Domestic)......................................... 32Purchase Price/Share – Mergerstat Unaffected Price (International) ................................... 34Mergerstat Unaffected <strong>Control</strong> <strong>Premium</strong> (Domestic)........................................................... 37Mergerstat Unaffected <strong>Control</strong> <strong>Premium</strong> (International) ..................................................... 39Target Financials (Domestic)................................................................................................ 42Target Financials (International)........................................................................................... 44Target Multiples (Domestic)................................................................................................. 47Target Multiples (International)............................................................................................ 49Target Demographics (Domestic) ........................................................................................ 52Target Demographics (International) ................................................................................... 54Company DescriptionsDomestic .............................................................................................................................. 57International ......................................................................................................................... 59Standard Industry Classification (SIC) Summary ................................................................ 63Description of Terms ................................................................................................................ 65Copyright © <strong>2010</strong>, FactSet Mergerstat, LLC. All rights reserved.i
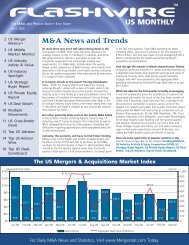
Mergerstat <strong>Control</strong> <strong>Premium</strong> <strong>Study</strong><strong>2nd</strong> <strong>Quarter</strong> <strong>2010</strong><strong>Control</strong> <strong>Premium</strong> <strong>Study</strong> Results *<strong>Control</strong><strong>Premium</strong>40%35%30%25%20%15%MERGERSTATCONTROL PREMIUM STUDYCOMPARATIVE RESULTS45% 12-Month Median 3-Month Median Transactions10%5%0%2Q07 3Q07 4Q07 1Q08 2Q08 3Q08 4Q08 1Q09 2Q09 3Q09 4Q09 1Q10 2Q1012-Month Median 21% 21% 20% 22% 25% 27% 31% 34% 38% 41% 44% 41% 38%3-Month Median 21% 22% 20% 29% 34% 30% 34% 45% 56% 41% 38% 40% 32%Transactions 190 203 212 184 160 181 155 100 95 124 128 93 106Percentages are rounded.* Median calculations excludes negative premiumsCopyright © <strong>2010</strong>, FactSet Mergerstat, LLC. All rights reserved. 2
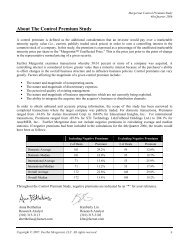
Mergerstat <strong>Control</strong> <strong>Premium</strong> <strong>Study</strong><strong>2nd</strong> <strong>Quarter</strong> <strong>2010</strong>12-Month Median <strong>Premium</strong>s by Industry*MERGERSTATCONTROL PREMIUM STUDY12-MONTH MEDIAN PREMIUMS BY INDUSTRY60%40%20%0%Agri Mining Const Mfg Trans Comm Elec &GasWhsle Retail Fin Svs ServicesMedian <strong>Premium</strong> 67% 33% 36% 44% 35% 38% 47% 48% 38% 36% 36%No. of Transactions 2 74 10 125 6 17 5 13 21 73 103For the 12 months ended June 30, <strong>2010</strong>.<strong>2010</strong> 2009 2008<strong>Quarter</strong>3-MonthMedian<strong>Premium</strong>No. ofTrans.12-MonthMedian<strong>Premium</strong>3-MonthMedian<strong>Premium</strong>No. ofTrans.12-MonthMedian<strong>Premium</strong>3-MonthMedian<strong>Premium</strong>No. ofTrans.12-MonthMedian<strong>Premium</strong>First 39.7% 93 40.8% 45.4% 100 33.9% 28.8% 184 21.7%Second 32.1% 106 38.1% 55.8% 95 37.9% 34.4% 160 24.9%Third 41.3% 124 41.5% 30.0% 181 27.4%Fourth 38.2% 128 43.7% 34.0% 155 31.4%The 12-month median premiums were gathered from transactions occurring within a trailing 12-month period, whereas the 3-month medianpremiums represent similar analyses for a 3-month period.* Median calculations excludes negative premiums.Copyright © <strong>2010</strong>, FactSet Mergerstat, LLC. All rights reserved. 3
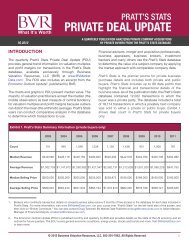
Mergerstat <strong>Control</strong> <strong>Premium</strong> <strong>Study</strong><strong>2nd</strong> <strong>Quarter</strong> <strong>2010</strong><strong>Premium</strong>s vs. S&P 500 Index *MERGERSTATCONTROL PREMIUM STUDYPREMIUMS VS. S&P 500 INDEX1,600S&P 500 Index12-Month Median45%1,50042%1,40039%S&P 500 Index1,3001,2001,1001,00036%33%30%27%<strong>Control</strong> <strong>Premium</strong>s90024%80021%7002Q07 3Q07 4Q07 1Q08 2Q08 3Q08 4Q08 1Q09 2Q09 3Q09 4Q09 1Q10 2Q1018%S&P 500 Index 1,503.4 1,526.8 1,468.4 1,322.7 1,280.0 1,166.4 903.3 1,115.1 1,115.1 1,057.1 1,115.1 1,169.4 1,030.712-Month Median 21% 21% 20% 22% 25% 27% 31% 34% 38% 41% 44% 41% 38%* Excludes negative premiums.Copyright © <strong>2010</strong>, FactSet Mergerstat, LLC. All rights reserved. 4
Mergerstat <strong>Control</strong> <strong>Premium</strong> <strong>Study</strong><strong>2nd</strong> <strong>Quarter</strong> <strong>2010</strong>Summary Statistics2ND QUARTER <strong>2010</strong>Domestic TransactionsNumber of Transactions 38Range -2.8% to 206.1%Median* 40.8%Average* 58.2%International TransactionsNumber of Transactions 68Range -89.5% to 471.4%Median* 24.3%Average* 47.7%Domestic and International TransactionsNumber of Transactions 106Range -89.5% to 471.4%Median* 32.4%Average* 51.8%12-MONTH SUMMARY FIGURES (07/01/09 TO 06/30/10)Number of Transactions 450Range -94.2% to 6500.0%Median* 37.9%Average* 73.0%* Excludes negative premiums.Copyright © <strong>2010</strong>, FactSet Mergerstat, LLC. All rights reserved. 5
Mergerstat <strong>Control</strong> <strong>Premium</strong> <strong>Study</strong><strong>2nd</strong> <strong>Quarter</strong> <strong>2010</strong><strong>Control</strong> <strong>Premium</strong>s by Industry – Trailing 12 MonthsSIC Target Closing Mergerstat UnaffectedCode Category Date Target Name <strong>Control</strong> <strong>Premium</strong>01-09 Agriculture and Forestry10-14 Mining0139 10/17/09 Hail Agricultural Development Co. 86.6%0782 12/16/09 Sunair Services Corp. 47.1%Range = 1.2% to 281.3% Median = 33.6% Average = 56.7%10 Metal MiningRange = 1.6% to 281.3% Median = 43.1% Average = 92.4%1011 12/18/09 Warwick Resources Ltd. 45.9%1021 10/30/09 Braemore Resources PLC -57.7%*1021 09/10/09 Compañia Minera Atacocha SAA -51.9%*1041 06/30/10 PacMag Metals Ltd. 34.6%1041 06/16/10 Rusina Mining NL -9.6%*1041 05/14/10 Morgan Stanley (Compagnie La Lucette) 281.3%1041 05/14/10 Morgan Stanley (Compagnie La Lucette) 281.3%1041 05/13/10 Meridian Resource Corp. 27.0%1041 02/24/10 Corvette Resources Ltd. -15.4%*1041 02/19/10 Vulcan Resources Ltd. 11.8%1041 03/02/10 Dioro Exploration NL 1.6%1041 01/29/10 Centaurus Resources Ltd. (Australia) 34.1%1041 01/25/10 Polaris Metal NL 166.7%1041 12/30/09 Castle Gold Corp. 66.7%1041 12/15/09 Sino Gold Mining Ltd. 38.4%1041 10/15/09 Moto Goldmines Ltd. 22.6%1041 08/14/09 Kazakhgold Group Ltd. 15.3%1041 08/14/09 Sub-Sahara Resources NL 119.3%1041 10/08/09 Goldmark Minerals Ltd. -16.0%*1041 08/06/09 North Australian Diamonds Ltd. 36.4%1041 08/05/09 Rimfire Minerals Corp. 20.0%1081 07/13/09 Cambrian Mining PLC 242.3%1094 06/14/10 AfNat Resources Ltd. 50.0%1094 12/26/09 Chengde Xinxin Vanadium & Titanium Co. Ltd. 40.4%1099 04/20/10 Vault Minerals, Inc. 35.0%1099 01/27/10 Freewest Resources Canada, Inc. 217.5%1099 01/13/10 Canadian Royalties, Inc. 66.7%1099 08/12/09 Minerva Resources PLC 132.0%* Not used in range, average and median calculations.Copyright © <strong>2010</strong>, FactSet Mergerstat, LLC. All rights reserved. 6
Mergerstat <strong>Control</strong> <strong>Premium</strong> <strong>Study</strong><strong>2nd</strong> <strong>Quarter</strong> <strong>2010</strong>1099 08/11/09 SA Metals Ltd 230.0%12 Coal MiningRange = 3.7% to 58.7% Median = 33.0% Average = 32.1%1222 12/23/09 Felix Resources Ltd. -0.9%*1222 09/01/09 Bowen Energy Ltd. 3.7%1241 12/21/09 Hillsborough Resources Ltd. 58.7%1241 12/21/09 Unique Mining Services Public Co. Ltd. 10.0%1241 07/31/09 Foundation Coal Holdings, Inc. 56.0%13 Oil and Gas ExtractionRange = 1.2% to 204.8% Median = 24.2% Average = 36.9%1311 05/12/10 West Energy Ltd. 29.4%1311 04/12/10 Canext Energy Ltd. 11.2%1311 02/11/10 Unbridled Energy Corp. 81.8%1311 03/10/10 Encore Acquisition Co. 34.9%1311 04/08/10 Madison Energy Corp. -7.0%*1311 06/29/10 Iteration Energy Ltd. 10.2%1311 04/14/10 Pan Andean Resources PLC 15.4%1311 02/25/10 Berens Energy Ltd. 33.0%1311 04/01/10 Result Energy, Inc. 1.2%1311 11/25/09 Parallel Petroleum Corp. 10.9%1311 09/29/09 Atlas Energy Resources LLC 106.5%1311 09/28/09 Venture Production PLC 4.8%1311 08/18/09 Addax Petroleum Corp. 12.8%1311 07/24/09 Grey Wolf Exploration, Inc. 15.6%1311 08/06/09 Petrosearch Energy Corp. 33.1%1311 09/04/09 Singapore Petroleum Co. Ltd. 24.2%1311 08/03/09 Petro-Canada 51.3%1311 07/02/09 Cobalt Energy Ltd. 40.8%1321 08/12/09 Pegasus Oil & Gas, Inc. -39.5%*1321 10/14/09 Sinoenergy Corp. 4.4%1381 06/29/10 Redcliffe Exploration, Inc. 31.3%1381 12/21/09 Verenex Energy, Inc. 8.4%1381 08/12/09 Challenger Energy Corp. 31.6%1381 12/11/09 Breaker Energy Ltd. 1.2%1381 10/15/09 Buffalo Resources Corp. 13.3%1381 08/13/09 Profound Energy, Inc. 106.2%1381 10/08/09 Highpine Oil & Gas Ltd. 23.9%1381 11/06/09 Petro Andina Resources, Inc. 10.1%1382 06/25/10 XTO Energy, Inc. 2.8%1382 05/13/10 Kelman Technologies, Inc. 10.8%1382 02/17/10 Nexstar Energy Ltd. 35.3%1382 10/12/09 Emerald Energy PLC 47.1%1382 09/25/09 VGS Seismic Canada, Inc. 100.0%1389 04/28/10 BJ Services Co. LLC 49.6%Copyright © <strong>2010</strong>, FactSet Mergerstat, LLC. All rights reserved. 7
Mergerstat <strong>Control</strong> <strong>Premium</strong> <strong>Study</strong><strong>2nd</strong> <strong>Quarter</strong> <strong>2010</strong>1389 01/21/10 Seajacks International Ltd. 6.1%13 Oil and Gas Extraction (continued)1389 02/01/10 Hallin Marine Subsea International PLC 87.1%1389 08/03/09 Eveready, Inc. 204.8%14 Mining and Quarrying of Nonmetallic Minerals, Except FuelsRange = 23.3% to 56.9% Median = 24.6% Average = 34.9%1474 03/23/10 Athabasca Potash, Inc. 24.6%1499 03/23/10 Vaaldiam Resources Ltd. -20.0%*1499 02/22/10 International Royalty Corp. 56.9%1499 07/24/09 Bonaparte Diamond Mines NL 23.3%15-17 ConstructionRange = 6.8% to 89.6% Median = 35.8% Average = 39.0%15 Building ConstructionRange = 23.3% to 57.6% Median = 35.8% Average = 38.9%1521 08/18/09 Centex Corp. 57.6%1521 09/01/09 Cavalier Homes, Inc. 23.3%1522 05/12/10 Forge Group Ltd. -29.1%*1531 11/17/09 GRD Ltd. 35.8%16 Heavy Construction1611 10/21/09 Pol-Aqua SA 8.0%1629 06/21/10 Ginger SA 67.4%17 Construction - Special Trade ContractorsRange = 6.8% to 89.6% Median = 31.4% Average = 39.8%1731 01/20/10 KLM Group Ltd. 6.8%1761 08/19/09 Solar Integrated Technologies, Inc. 16.8%1794 12/03/09 Brandrill Ltd. 89.6%1796 10/01/09 Furukawa Electric Co., Ltd. (FurukawaEngineering & Construction, Inc.)45.9%Copyright © <strong>2010</strong>, FactSet Mergerstat, LLC. All rights reserved. 8
Mergerstat <strong>Control</strong> <strong>Premium</strong> <strong>Study</strong><strong>2nd</strong> <strong>Quarter</strong> <strong>2010</strong>20-39 ManufacturingRange = 0.0% to 6,500.0% Median = 44.1% Average = 124.8%20 Food and Kindred ProductsRange = 22.8% to 80.6% Median = 52.0% Average = 48.6%2038 12/14/09 Monterey Gourmet Foods, Inc. 25.0%2047 06/17/10 Unicharm Petcare Corp. 22.8%2066 04/09/10 Glisten PLC 80.6%2066 04/19/10 Cadbury PLC 52.0%2082 10/21/09 Lion Nathan Ltd. 47.2%2084 01/14/10 Laroche SA -31.2%*2086 02/26/10 Pepsi Bottling Group, Inc. 57.2%2086 02/26/10 PepsiAmericas, Inc. 55.5%2086 11/19/09 Devin Beteiligungs GmbH -5.8%*22 Textile Mill Products2231 09/01/09 Miyuki Holdings Co., Ltd. 92.4%23 ApparelRange = 18.1% to 106.6% Median = 69.3% Average = 65.8%2326 10/28/09 High Fashion International Ltd. (Theme-43.5%*International Holdings Ltd)2335 11/25/09 Tween Brands, Inc. 94.8%2339 08/20/09 Tarrant Apparel Group 18.1%2341 08/17/09 Lecien Corp. 43.7%2392 07/16/09 Royale Furniture Holdings Ltd. -1.5%*2399 02/16/10 Kowa Spinning Co. Ltd. 106.6%24-26 Lumber, Furniture and PaperRange = 2.3% to 267.1% Median = 24.3% Average = 69.4%2522 05/28/10 Houtoku Co. Ltd. 44.6%2541 06/16/10 Royal Laser Corp. 24.3%2621 10/01/09 Kishu Paper Co., Ltd. 8.7%2653 06/18/10 Constantia Packaging AG 2.3%2671 06/17/10 Higashiyama Film Co. Ltd. -18.8%*2672 09/15/09 Nashua Corp. 267.1%2678 04/09/10 Advent International Corp. (Herlitz AG) -7.3%*27 Printing, Publishing and Allied Industries2731 12/31/09 Marvel Entertainment, Inc. 36.6%Copyright © <strong>2010</strong>, FactSet Mergerstat, LLC. All rights reserved. 9
Mergerstat <strong>Control</strong> <strong>Premium</strong> <strong>Study</strong><strong>2nd</strong> <strong>Quarter</strong> <strong>2010</strong>2759 07/21/09 Brilliant Eagle International Ltd. / GoldfishVentures Ltd. / New Court Management, Inc.(iOne Holdings Ltd.)28 Chemicals and Allied Products-67.0%*Range = 0.0% to 348.0% Median = 33.4% Average = 63.1%2819 05/12/10 Delta PLC 20.3%2819 07/06/09 NOVA Chemicals Corp. 348.0%2821 04/30/10 ICO, Inc. 101.3%2821 03/23/10 ARRK Corp. (Avaplas Ltd.) 122.2%2823 09/01/09 Toyo Cloth Co. Ltd. 64.8%2824 03/20/10 Mitsubishi Rayon Co., Ltd. 39.2%2834 03/11/10 Chattem, Inc. 33.6%2834 06/09/10 OSI Pharmaceuticals, Inc. 55.3%2834 04/21/10 Facet Biotech Corp. 206.1%2834 04/01/10 Ayrton Drug Manufacturing Ltd. 23.1%2834 02/01/10 Cytopia Ltd. 38.2%2834 12/23/09 Neurogen Corp. -28.1%*2834 10/20/09 Sepracor, Inc. 27.6%2834 10/20/09 Sihuan Pharmaceutical Holdings Group Ltd. 28.0%2834 10/15/09 Wyeth 29.0%2834 10/14/09 Cell Genesys, Inc. 7.4%2834 08/27/09 Noven Pharmaceuticals, Inc. 22.4%2834 07/21/09 Pfizer India Ltd. 33.2%2834 12/04/09 Bouty Healthcare SpA 20.1%2834 11/03/09 Schering-Plough Corp. 61.8%2835 08/11/09 Concateno PLC 12.3%2835 09/24/09 Celsis International PLC 15.1%2836 05/20/10 BioXell SpA 50.3%2844 06/16/10 Spectrum Brands, Inc. -2.8%*2851 12/17/09 Tohpe Corp. 0.0%2873 04/15/10 Terra Industries, Inc. 203.6%2899 06/29/10 Marktec Corp. 52.2%2899 05/27/10 International Absorbents, Inc. 25.4%2899 09/18/09 Akzo Nobel NV (Pakistan PTA Ltd.) -74.9%*2899 12/09/09 COL Capital Ltd. (Greenfield Chemical HoldingsLtd.)-25.0%*31 Leather and Leather Products3199 04/01/10 Sumitomo Corp. (Interhides Public Co. Ltd.) -45.7%*32-33 Stone, Concrete Products and Primary MetalsRange = 19.2% to 335.5% Median = 60.1% Average = 110.2%3261 07/07/09 A-S China Plumbing Products Ltd. 140.0%3291 02/03/10 Sankyo Rikagaku Co. 71.7%Copyright © <strong>2010</strong>, FactSet Mergerstat, LLC. All rights reserved. 10
Mergerstat <strong>Control</strong> <strong>Premium</strong> <strong>Study</strong><strong>2nd</strong> <strong>Quarter</strong> <strong>2010</strong>3312 12/26/09 Handan Iron & Steel Co. Ltd. 46.0%32-33 Stone, Concrete Products and Primary Metals (continued)3339 02/08/10 Ausmelt Ltd. 335.5%3353 07/14/09 Nippon Foil Manufacturing Co., Ltd 48.5%3357 04/27/10 RPG Cables Ltd. 19.2%34-35 Fabricated Metal Products, Industrial Machinery and ComputersRange = 0.6% to 471.4% Median = 39.4% Average = 63.9%3411 06/16/10 BWAY Holding Co. 15.3%3444 02/05/10 Quixote Corp. 123.9%3479 04/27/10 Intergold Ltd. 471.4%3491 11/13/09 Bjørge ASA 44.7%3491 10/29/09 GenTek, Inc. 40.7%3533 11/18/09 NATCO Group, Inc. 73.2%3535 04/01/10 K-Tron International, Inc. 32.1%3541 09/12/09 Water Jet Sweden AB 10.2%3546 03/12/10 The Black & Decker Corp. 58.8%3552 10/29/09 Hirsch International Corp. 47.2%3559 01/15/10 3S Industries AG -87.8%*3559 11/30/09 Christ Water Technology AG 0.6%3563 02/28/10 Enerflex Systems Income Fund 39.7%3565 12/22/09 MTS Medication Technologies, Inc. 4.5%3565 08/27/09 Komatsu NTC Ltd. (Fabrica Toyama Corp.) 11.8%3571 10/21/09 Metris NV 106.8%3577 04/22/10 TPV Technology Ltd. 8.3%3577 12/11/09 Avocent Corp. 21.8%3578 11/06/09 Stone Group Holdings Ltd. 39.1%36 Electrical and Electronic Machinery and EquipmentRange = 0.8% to 366.7% Median = 43.4% Average = 66.3%3612 04/01/10 Zareba Systems, Inc. 90.3%3631 04/01/10 Sun Wave Corp. 49.4%3661 04/09/10 Airvana, Inc. 22.6%3661 04/16/10 PECO II, Inc 51.0%3663 03/31/10 Haier Group Corp. (Haier Electronics Group Co. -32.7%*Ltd.)3663 12/18/09 Starent Networks Corp. 20.2%3669 08/21/09 GST Holdings Ltd. 77.9%3672 12/31/09 Coretec, Inc. 230.4%3674 04/08/10 Silicon Storage Technology, Inc. 12.1%3674 04/30/10 White Electronic Designs Corp. 28.2%3674 04/27/10 Techwell, Inc. 48.7%3674 02/18/10 ZiLOG, Inc. 21.1%3674 01/28/10 California Micro Devices Corp. 54.1%Copyright © <strong>2010</strong>, FactSet Mergerstat, LLC. All rights reserved. 11
Mergerstat <strong>Control</strong> <strong>Premium</strong> <strong>Study</strong><strong>2nd</strong> <strong>Quarter</strong> <strong>2010</strong>3674 01/27/10 Sun Microsystems, Inc. 42.0%36 Electrical and Electronic Machinery and Equipment (continued)3674 12/21/09 Semitool, Inc. 31.0%3674 12/18/09 Chartered Semiconductor Manufacturing Ltd. 0.8%3674 12/15/09 Intellon Corp. 46.0%3674 09/21/09 ARC International PLC 44.9%3679 03/18/10 Chi Mei Optoelectronics Corp. 39.8%3679 03/18/10 TPO Displays Corp. 7.5%3679 02/03/10 Merrimac Industries, Inc. 40.1%3679 12/23/09 Kangaroo Media, Inc. 366.7%3699 02/25/10 Franklin Electronic Publishers, Inc. 134.1%37 Transportation Equipment3751 06/18/10 Kawamura Cycle Co. Ltd. 27.6%38 <strong>Control</strong>ling Instruments; Photographic, Medical and Optical Goods; and ClocksRange = 7.6% to 258.6% Median = 60.9% Average = 64.4%3812 11/25/09 Hi-Shear Technology Corp. 61.4%3825 03/05/10 Sirit, Inc. 76.9%3825 11/26/09 Megacon AB 27.8%3826 05/14/10 Varian, Inc. 32.7%3827 09/02/09 Axsys Technologies, Inc. 8.0%3829 01/08/10 Medical House PLC 93.0%3841 03/15/10 Home Diagnostics, Inc. 90.1%3841 02/19/10 BioForm Medical, Inc. 60.3%3841 11/24/09 I-Flow Corp. 7.6%3841 08/17/09 CardioDynamics International Corp. 69.2%3841 09/08/09 Power Medical Interventions, Inc. 258.6%3841 07/27/09 Endocare, Inc. -49.1%*3841 11/06/09 Aspect Medical Systems, Inc. 56.5%3843 09/18/09 Zila, Inc. 39.7%3845 01/05/10 Candela Corp. 68.1%3851 03/15/10 FGX International Holdings Ltd. 10.3%3861 10/28/09 Alpha Innotech Corp. 70.5%39 Miscellaneous ManufacturingRange = 14.3% to 6,500.0% Median = 167.2% Average = 2,227.2%3911 10/19/09 Diamond Information Institute, Inc. 6,500.0%3944 06/21/10 EXX, Inc. 167.2%3944 08/26/09 Great Victory International, Inc. (SewcoInternational Holdings Ltd.)14.3%Copyright © <strong>2010</strong>, FactSet Mergerstat, LLC. All rights reserved. 12
Mergerstat <strong>Control</strong> <strong>Premium</strong> <strong>Study</strong><strong>2nd</strong> <strong>Quarter</strong> <strong>2010</strong>40-47 TransportationRange = 7.9% to 136.1% Median = 35.5% Average = 47.8%40 Railroad Transportation4011 02/12/10 Burlington Northern Santa Fe Corp. 31.5%42 Motor Freight Transportation4214 09/01/09 Chuounyu Co., Ltd. 136.1%44 Water Transportation4492 05/05/10 SMIT Internationale NV 7.9%45 Air Transportation4512 01/28/10 Shanghai Airlines Co., Ltd. 39.4%4512 09/03/09 Austrian Airlines AG 29.8%46 Pipelines4613 10/26/09 TEPPCO Partners LP 41.9%48 CommunicationsRange = 5.2% to 237.0% Median = 37.8% Average = 60.5%4812 05/12/10 GVT Holding SA -2.7%*4812 03/29/10 SkyTerra Communications, Inc. 47.1%4812 10/30/09 Hutchison Whampoa Ltd. (Partner-4.0%*Communications Co. Ltd.)4812 09/28/09 Datacom Wireless Corp. 237.0%4812 11/06/09 Centennial Communications Corp. 145.0%4812 12/04/09 iPCS, Inc. 34.2%4813 03/31/10 PIPE Networks Ltd. 5.2%4813 01/20/10 Quinenco SA (Compania Nacional de Telefonos 10.2%Telefónica del Sur SA)4813 06/01/10 Iowa Telecommunications Services, Inc. 29.9%4813 10/13/09 Sistema JSFC (Comstar United TeleSystems ZAO) 48.4%4813 11/10/09 D&E Communications, Inc. 70.9%4813 07/01/09 Embarq Corp. 41.4%4822 11/23/09 TDC A/S (Invitel Holdings A/S) -80.0%*4899 04/27/10 Trulscom AB (Tilgin AB) 17.8%4899 01/21/10 Cybit Holdings PLC 108.3%4899 11/24/09 Virgin Mobile USA, Inc. 26.6%Copyright © <strong>2010</strong>, FactSet Mergerstat, LLC. All rights reserved. 13
Mergerstat <strong>Control</strong> <strong>Premium</strong> <strong>Study</strong><strong>2nd</strong> <strong>Quarter</strong> <strong>2010</strong>4899 07/15/09 Hurray! Holding Co. Ltd. 25.0%49 Electric, Gas, and Sanitary ServicesRange = 18.5% to 85.6% Median = 47.3% Average = 49.6%4911 07/02/09 Universal Energy Group Ltd. -3.7%*4923 10/09/09 AltaGas Utility Group, Inc. 68.0%4931 04/19/10 Schneider Power, Inc. 85.6%4931 10/28/09 Florida Public Utilities Co. 18.5%4931 12/04/09 Hiland Partners LP 26.6%50-51 Wholesale TradeRange = 20.0% to 116.3% Median = 48.5% Average = 56.5%50 Durable goodsRange = 20.0% to 116.3% Median = 64.6% Average = 66.7%5012 11/30/09 Happy City Holdings Ltd. (Yardway Group Ltd.) -14.3%*5045 09/23/09 Computer Sciences Corp. (Automated Systems -39.4%*Holdings Ltd.)5045 07/23/09 Data Domain, Inc. 92.2%5049 05/07/10 SSH Corp. Ltd. 20.0%5051 03/25/10 Haywood Shares Holding Ltd. / Iwin Ltd. / Lynch -8.7%*Oasis, Inc. (Simsen International Corp. Ltd.)5065 01/22/10 Daidensha Co., Ltd. 40.4%5072 11/19/09 Danks Holdings Ltd. 64.6%5084 09/08/09 MonotaRO Co. Ltd. -2.0%*5084 07/01/09 Sanyo Kogyo Co. Ltd. 116.3%51 Nondurable GoodsRange = 21.3% to 53.0% Median = 43.9% Average = 39.4%5122 01/13/10 Allion Healthcare, Inc. 21.3%5149 05/12/10 Unimat Life Corp. 43.9%5153 09/23/09 ABB Grain Ltd. 53.0%5169 01/22/10 AarhusKarlshamn AB / Ceylon Trading Co. Ltd.(C. W. Mackie & Co. Ltd.)-0.7%*Copyright © <strong>2010</strong>, FactSet Mergerstat, LLC. All rights reserved. 14
Mergerstat <strong>Control</strong> <strong>Premium</strong> <strong>Study</strong><strong>2nd</strong> <strong>Quarter</strong> <strong>2010</strong>52-59 Retail TradeRange = 1.4% to 107.6% Median = 38.2% Average = 37.8%54 Food StoresRange = 10.4% to 38.1% Median = 21.8% Average = 23.4%5411 01/12/10 CS International Investment Ltd. (Times Ltd.) 10.4%5411 12/18/09 Casino Guichard-Perrachon SA (Super de Boer 38.1%NV)5411 10/02/09 Ozeki Co., Ltd. 21.8%55 Automotive Dealers and Gasoline Service Stations5521 06/03/10 Mitsui & Co. Ltd. / Aucnet, Inc. / J21 KK (Japan 53.0%Automobile Auction, Inc.)5521 08/25/09 Agasta Co. Ltd. 107.6%56 Apparel Stores5611 07/01/09 Artman SA 38.3%5621 10/14/09 Charlotte Russe Holding, Inc. 26.9%57 Furniture and Equipment Stores5719 09/09/09 Globex Utilidades SA 1.4%58 Eating and Drinking PlacesRange = 5.6% to 60.6% Median = 44.6% Average = 36.2%5812 05/11/10 Diedrich Coffee, Inc. 60.6%5812 03/30/10 Western Sizzlin Corp. -38.4%*5812 02/23/10 Ten Corp. 17.0%5812 01/14/10 Wondertable, Ltd. 53.4%5812 12/22/09 Yonekyu Corp.(Chimney Co., Ltd.) 44.6%5812 10/07/09 Well Positioned Corp. (Hong Kong CateringManagement Ltd.)5.6%59 Miscellaneous RetailRange = 4.6% to 92.5% Median = 39.9% Average = 40.3%5912 12/15/09 Midoriyakuhin Co., Ltd. -26.9%*5912 07/23/09 NationsHealth, Inc. 41.2%5941 07/30/09 RSH Ltd. 92.5%5961 07/02/09 Cécile Co., Ltd. -4.3%*Copyright © <strong>2010</strong>, FactSet Mergerstat, LLC. All rights reserved. 15
Mergerstat <strong>Control</strong> <strong>Premium</strong> <strong>Study</strong><strong>2nd</strong> <strong>Quarter</strong> <strong>2010</strong>5999 03/22/10 Dufry South America Ltd. 23.3%59 Miscellaneous Retail (continued)5999 03/14/10 Bare Escentuals, Inc. 39.9%5999 09/01/09 Pet Valu Canada, Inc. 4.6%60-67 Finance, Insurance, and Real EstateRange = 0.3% to 333.3% Median = 36.3% Average = 56.7%60-61 Banking and Credit AgenciesRange = 1.3% to 333.3% Median = 73.6% Average = 92.5%6021 04/09/10 Bank of Thailand (Siam City Bank Public Co. Ltd.) 333.3%6021 04/09/10 Harleysville National Corp. 73.6%6021 04/06/10 State of São Paulo (Banco Nossa Caixa SA) 37.7%6021 04/21/10 Bangkok Bank Public Co. Ltd. (ACL Bank Public 130.0%Co. Ltd.)6021 04/01/10 Banca Italease SpA 39.5%6021 07/24/09 Discovery Bancorp 113.3%6021 12/01/09 CNB Financial Corp. (Massachusetts) 37.3%6021 10/01/09 Abigail Adams National Bancorp, Inc. 32.4%6022 04/30/10 O.A.K. Financial Corp. 77.2%6022 12/31/09 Community National Corp. (Ohio) 170.9%6022 07/01/09 Service Bancorp, Inc. 169.5%6029 10/30/09 Beverly National Corp. 35.8%6081 07/22/09 Bahraini Saudi Bank BSC -35.6%*6153 04/09/10 DBS Bank Ltd. (Cholamandalam DBS Finance 1.3%Ltd.)6159 02/19/10 Financial Federal Corp. 30.6%6159 12/02/09 Patriot Capital Funding, Inc. 105.1%62 Security and Commodity Brokers and Related ServicesRange = 0.3% to 150.0% Median = 16.3% Average = 47.4%6211 12/21/09 NWS Holdings Ltd. (Taifook Securities Group 23.9%Ltd.)6211 11/30/09 NYFIX, Inc. 94.8%6211 08/14/09 Dowgate Capital PLC 150.0%6211 07/14/09 VEM Aktienbank AG 0.3%6282 09/16/09 Capcon Holdings PLC 6.7%6282 07/01/09 Mavrix Fund Management, Inc. 8.7%Copyright © <strong>2010</strong>, FactSet Mergerstat, LLC. All rights reserved. 16
Mergerstat <strong>Control</strong> <strong>Premium</strong> <strong>Study</strong><strong>2nd</strong> <strong>Quarter</strong> <strong>2010</strong>63-64 Insurance Companies and AgentsRange = 14.3% to 68.1% Median = 33.1% Average = 38.9%6311 11/05/09 Friends Provident Group PLC 34.7%6311 10/02/09 PARIS Ré Holdings Ltd. 60.6%6324 12/02/09 Medial Participaçoes SA (Medial Sáude SA) -39.9%*6331 05/20/10 Zenith National Insurance Corp. 31.4%6331 11/13/09 Specialty Underwriters' Alliance, Inc. 68.1%6361 09/04/09 IPC Holdings Ltd. 24.3%6371 11/26/09 Just Retirement (Holdings) PLC 14.3%65 Real EstateRange = 2.0% to 159.1% Median = 36.7% Average = 57.0%6512 09/11/09 Goh Ban Huat Bhd. 50.0%6513 09/30/09 Din Bostad Sverige AB 59.6%6531 03/10/10 Overland Realty Ltd. 36.7%6531 02/01/10 Realty Vailog SpA 7.3%6531 07/27/09 Spazio Investments NV 13.2%6531 08/07/09 Madison Property Fund Managers Holdings Ltd. 2.0%6531 08/01/09 Atrium Co., Ltd. 30.6%6552 08/24/09 Brixton PLC 159.1%6552 07/16/09 China Central Properties Ltd. 154.3%67 Holding Companies and Other Investment OfficesRange = 5.5% to 155.3% Median = 32.6% Average = 43.2%6712 04/07/10 First Litchfield Financial Corp. 155.3%6719 01/04/10 Eircom Holdings Ltd. 22.5%6722 06/22/10 Atlas Estates Ltd. 11.1%6722 08/11/09 Knight Frank LLP (Rutley European Property Ltd.) 143.3%6726 06/30/10 Mulvihill Capital Management, Inc. (First <strong>Premium</strong> 21.6%Income Trust PLUS)6726 01/20/10 Livingston International Income Fund 42.2%6726 12/22/09 Harvest Energy Trust 44.1%6726 09/16/09 Principle Capital Investment Trust PLC 10.6%6726 08/28/09 The Advantage Property Income Trust Ltd. -0.2%*6726 07/27/09 Resolve Business Outsourcing Income Fund 34.1%6726 11/06/09 MMC Contrarian Ltd. 18.5%6771 06/25/10 Rensburg Sheppards PLC 25.1%6771 01/04/10 Bluehill ID AG 59.3%6771 04/01/10 Allied Capital Corp. 76.4%6771 12/10/09 Lion Selection Ltd. 61.8%6771 07/22/09 Macquarie Communications Infrastructure Group 97.4%6798 06/08/10 Cagim Real Estate Corp. 40.0%Copyright © <strong>2010</strong>, FactSet Mergerstat, LLC. All rights reserved. 17
Mergerstat <strong>Control</strong> <strong>Premium</strong> <strong>Study</strong><strong>2nd</strong> <strong>Quarter</strong> <strong>2010</strong>6798 12/30/09 American Community Properties Trust -11.6%*67 Holding Companies and Other Investment Offices (continued)6798 09/25/09 Puma Brandenburg Ltd. 41.2%6798 12/07/09 Mirvac Real Estate Investment Trust -14.8%*6799 05/11/10 Consolidated Mercantile, Inc. 36.0%6799 06/16/10 MW Trade SA -3.8%*6799 03/30/10 Uranium Ltd. 5.5%6799 01/14/10 Pearlstreet Ltd. 76.5%6799 12/20/09 Deficom Group SA/NV 31.0%6799 08/11/09 Renewagy AS -20.4%*6799 09/10/09 <strong>Premium</strong> Nutrients Bhd. 6.4%6799 12/09/09 GVI Security Solutions, Inc. 25.2%6799 08/28/09 Zhejiang Xinhu Venture Investment Co. Ltd. -70.8%*6799 09/08/09 The Indian Film Co. Ltd. 8.1%6799 07/28/09 Capregen PLC 13.9%6799 07/28/09 MacarthurCook Ltd. 16.7%6799 07/06/09 Ulyss AB 69.2%6799 11/05/09 Deutsche Land PLC 15.6%6799 12/04/09 Clean Energy Brazil PLC -4.2%*70-99 Services and OtherRange = 2.8% to 403.2% Median = 35.6% Average = 54.1%70 Hotels and Lodging Places7011 04/19/10 Lodgian, Inc. 40.8%7011 03/17/10 Interstate Hotels & Resorts, Inc. 77.2%73-78 Business ServicesRange = 2.8% to 220.5% Median = 33.4% Average = 47.1%7349 06/04/10 SECOM Co., Ltd. (Tokyo Biso Kogyo Corp.) 33.1%7359 12/09/09 Procon Multimedia AG 25.0%7361 02/10/10 Supporta PLC 18.4%7361 04/05/10 COMSYS IT Partners, Inc. 33.4%7361 01/20/10 MPS Group, Inc. 23.9%7361 10/20/09 Spring Group PLC 68.7%7361 07/27/09 OPD Group PLC 40.7%7361 09/02/09 StepStone ASA 22.9%7371 04/12/10 3Com Corp. 46.0%7371 03/18/10 QuadraMed Corp. 32.6%7371 02/19/10 On2 Technologies, Inc. 81.1%7371 08/17/09 Fractalist, Inc. 5.5%7371 11/03/09 Perot Systems Corp. 67.5%7371 10/01/09 Metavante Technologies, Inc. 72.5%7372 04/12/10 Global Med Technologies, Inc. 64.9%Copyright © <strong>2010</strong>, FactSet Mergerstat, LLC. All rights reserved. 18
Mergerstat <strong>Control</strong> <strong>Premium</strong> <strong>Study</strong><strong>2nd</strong> <strong>Quarter</strong> <strong>2010</strong>7372 02/10/10 Kingspecial Investments Ltd. (ArmitageTechnologies Holding Ltd.)73-78 Business Services (continued)-40.9%*7372 02/10/10 OneClickHR PLC 9.1%7372 06/30/10 Inspired Gaming Group PLC 21.2%7372 05/26/10 SkillSoft PLC 15.9%7372 05/25/10 PLATO Learning, Inc. 14.1%7372 04/28/10 AMICAS, Inc. 36.9%7372 04/22/10 Chordiant Software, Inc. 65.0%7372 04/16/10 Porthus NV 20.2%7372 03/22/10 STARLIMS Technologies Ltd. 87.6%7372 03/18/10 Valor Computerized Systems Ltd. -11.5%*7372 04/03/10 Intelligent Wave, Inc. 80.0%7372 02/23/10 Kaga Ltd. (NJK Corp.) 86.9%7372 01/28/10 i2 Technologies, Inc. 19.9%7372 02/01/10 Xenos Group, Inc. 65.5%7372 12/16/09 Sorun Corp. 73.6%7372 11/27/09 OpenTV Corp. 16.5%7372 10/26/09 Grey Island Systems International, Inc. 37.5%7372 10/23/09 Omniture, Inc. 26.5%7372 10/14/09 Elliott Management Corp. (MSC Software Corp.) 20.7%7372 08/18/09 LogicVision, Inc. 58.9%7372 08/13/09 SoftBrands, Inc. 95.7%7372 07/28/09 Entrust, Inc. 19.8%7372 07/27/09 Borland Software Corp. 87.5%7372 07/21/09 etrials Worldwide, Inc. 72.7%7372 07/21/09 SumTotal Systems, Inc. 141.3%7372 07/21/09 Vignette Corp. 47.8%7372 07/17/09 Wind River Systems, Inc. 43.8%7372 08/07/09 En Pointe Technologies, Inc. 220.5%7372 10/02/09 SPSS, Inc. 42.5%7372 10/01/09 Goldleaf Financial Solutions, Inc. 40.0%7373 06/21/10 Morse PLC 23.6%7373 04/23/10 Sodifrance 10.5%7373 04/19/10 Tandberg ASA 41.2%7373 01/13/10 ECtel Ltd. 20.9%7373 12/17/09 JAFCO Co., Ltd. (BancTec Japan, Inc.) 76.0%7373 11/12/09 Pomeroy IT Solutions, Inc. 10.2%7373 09/28/09 phion AG 86.0%7373 09/09/09 FiberNet Telecom Group, Inc. 15.2%7374 02/08/10 Affiliated Computer Services, Inc. 27.8%7374 10/09/09 The Offshore Group Holdings Ltd. / Marilyn -94.2%*Investments Ltd. (UURG Corp. Ltd.)7375 05/25/10 Bankier.pl SA 12.5%7375 12/21/09 Huon Capital Pty Ltd. (Dark Blue Sea Ltd.) 75.0%7375 10/23/09 HLTH Corp. 28.4%7375 09/25/09 Bankrate, Inc. 15.8%7375 09/07/09 COMPUTERLINKS AG 2.8%Copyright © <strong>2010</strong>, FactSet Mergerstat, LLC. All rights reserved. 19
Mergerstat <strong>Control</strong> <strong>Premium</strong> <strong>Study</strong><strong>2nd</strong> <strong>Quarter</strong> <strong>2010</strong>7376 05/03/10 Switch & Data Facilities Co., Inc. 36.6%73-78 Business Services (continued)7379 06/07/10 Votorantim Novos Negócios Ltda. / Pátria9.7%Investimentos (TIVIT Terceirizacao deProcessos Servicos e Technologia SA)7379 06/28/10 Matrikon, Inc. 13.9%7379 02/19/10 FDM Group PLC 47.8%7379 09/12/09 VarioSecure Networks, Inc. 30.7%7382 05/14/10 Brink's Home Security Holdings, Inc. 36.3%7382 06/04/10 Protection One, Inc. 12.6%7389 02/08/10 LitComp PLC 14.8%7389 11/10/09 Steel Vault Corp. 214.0%7389 07/27/09 UCMS Group Ltd. 133.3%7389 07/07/09 ASK Planning Center, Inc. 25.7%7812 06/07/10 HandMade PLC -89.5%*7822 09/29/09 Medialink Worldwide, Inc. -9.1%*7841 06/29/10 WAREHOUSE Co., Ltd. 23.9%79 Amusement and Recreation ServicesRange = 4.5% to 270.4% Median = 27.3% Average = 62.3%7929 04/16/10 MAMA Group PLC 23.4%7941 11/26/09 Essentially Group PLC 58.4%7941 10/30/09 Yoshimoto Kogyo Co. Ltd. 4.5%7941 10/06/09 Birmingham City PLC 270.4%7991 02/26/10 Health Fitness Corp. 21.9%7999 06/02/10 Youbet.com, Inc. 27.3%7999 09/21/09 International All Sports Ltd. 30.4%80-82 Health ServicesRange = 10.6% to 403.2% Median = 72.2% Average = 115.0%8011 04/27/10 Care UK PLC 10.6%8062 06/03/10 Dialysis Corp. of America 72.5%8082 10/27/09 Claimar Care Group PLC 403.2%8299 01/22/10 ThirdForce PLC 16.7%8299 07/29/09 BPP Holdings PLC 72.2%87 Engineering , Accounting, Research and ManagementRange = 6.7% to 170.8% Median = 43.9% Average = 61.3%8711 03/04/10 Halifax Corp. 81.8%8711 11/25/09 Grenland Group ASA 25.0%8713 10/02/09 Optimal Geomatics, Inc. 90.5%8731 04/09/10 Geneart AG 20.0%Copyright © <strong>2010</strong>, FactSet Mergerstat, LLC. All rights reserved. 20
Mergerstat <strong>Control</strong> <strong>Premium</strong> <strong>Study</strong><strong>2nd</strong> <strong>Quarter</strong> <strong>2010</strong>8731 08/04/09 Monogram Biosciences, Inc. 170.8%87 Engineering , Accounting, Research and Management (continued)8731 09/01/09 Medarex, Inc. 93.2%8732 02/26/10 IMS Health, Inc. 30.9%8732 06/01/10 RiskMetrics Group, Inc. 16.4%8732 12/15/09 Research Now PLC 13.2%8733 11/21/09 ARRK Corp. (Japan Tecseed Co., Ltd.) 92.3%8734 01/12/10 Genetix Group PLC 34.9%8742 01/06/10 Hikari Tsushin, Inc. (Venture Link Co., Ltd.) 6.7%8742 02/02/10 ICT Group, Inc. 51.0%8742 12/23/09 Cossette, Inc. 149.2%8744 09/02/09 Fountains PLC 43.9%88-89 Private Households and Miscellaneous Services8999 08/21/09 Rojam Entertainment Holdings Ltd. -60.6%*Copyright © <strong>2010</strong>, FactSet Mergerstat, LLC. All rights reserved. 21
Mergerstat <strong>Control</strong> <strong>Premium</strong> <strong>Study</strong><strong>2nd</strong> <strong>Quarter</strong> <strong>2010</strong>Target Name and SIC Number (Domestic)Target NameTargetSICAcquirer NameAcquirerSIC3Com Corp. 7371 Hewlett-Packard Co. 3571Airvana, Inc. 3661 72 Mobile Holdings LLC 6799Allied Capital Corp. 6771 Ares Capital Corp. 6726AMICAS, Inc. 7372 Merge Healthcare, Inc. 7372BJ Services Co. LLC 1389 Baker Hughes, Inc. 1389Brink's Home Security Holdings, Inc. 7382 Tyco International Ltd. 3679BWAY Holding Co. 3411 Madison Dearborn Partners LLC 6771Chordiant Software, Inc. 7372 Pegasystems, Inc. 7372COMSYS IT Partners, Inc. 7361 Manpower, Inc. 7361Dialysis Corp. of America 8062 US Renal Care, Inc. 8092Diedrich Coffee, Inc. 5812 Green Mountain Coffee Roasters, Inc. 2095EXX, Inc. 3944 EXX, Inc. (Segal) 6799Facet Biotech Corp. 2834 Abbott Laboratories 2834First Litchfield Financial Corp. 6712 Union Savings Bank 6021Global Med Technologies, Inc. 7372 Haemonetics Corp. 3841Harleysville National Corp. 6021 First Niagara Financial Group, Inc. 6022ICO, Inc. 2821 A. Schulman, Inc. 2821Iowa Telecommunications Services, Inc. 4813 Windstream Corp. 4813K-Tron International, Inc. 3535 Hillenbrand, Inc. 3995Lodgian, Inc. 7011 Lone Star Investment Advisors LLC 6771Meridian Resource Corp. 1041 Alta Mesa Holdings LP 1381O.A.K. Financial Corp. 6022 Chemical Financial Corp. 6022OSI Pharmaceuticals, Inc. 2834 Astellas Pharma, Inc. 2834PECO II, Inc 3661 The Gores Group LLC (Lineage Power Corp.) 6771PLATO Learning, Inc. 7372 Thoma Bravo LLC 6771Protection One, Inc. 7382 GTCR Golder Rauner LLC 6771RiskMetrics Group, Inc. 8732 MSCI, Inc. 7375Silicon Storage Technology, Inc. 3674 Microchip Technology, Inc. 3674Spectrum Brands, Inc. 2844 Harbinger Capital Partners 6282Switch & Data Facilities Co., Inc. 7376 Equinix, Inc. 7376Techwell, Inc. 3674 Intersil Corp. 3674Terra Industries, Inc. 2873 CF Industries Holdings, Inc. 2873Varian, Inc. 3826 Agilent Technologies, Inc. 3829White Electronic Designs Corp. 3674 Microsemi Corp. 3674Copyright © <strong>2010</strong>, FactSet Mergerstat, LLC. All rights reserved. 22
Mergerstat <strong>Control</strong> <strong>Premium</strong> <strong>Study</strong><strong>2nd</strong> <strong>Quarter</strong> <strong>2010</strong>Target NameTargetSICAcquirer NameAcquirerSICXTO Energy, Inc. 1382 Exxon Mobil Corp. 1382Youbet.com, Inc. 7999 Churchill Downs, Inc. 7948Zareba Systems, Inc. 3612 Code Hennessy & Simmons LLC (Woodstream 6771Corp.)Zenith National Insurance Corp. 6331 Fairfax Financial Holdings Ltd. 6361Copyright © <strong>2010</strong>, FactSet Mergerstat, LLC. All rights reserved. 23
Mergerstat <strong>Control</strong> <strong>Premium</strong> <strong>Study</strong><strong>2nd</strong> <strong>Quarter</strong> <strong>2010</strong>Target Name and SIC Number (International)Target NameTargetSICAcquirer NameAcquirerSICAdvent International Corp. (Herlitz AG) 2678 Pelikan International Corp. Bhd. 3951AfNat Resources Ltd. 1094 AXMIN, Inc. 1041Atlas Estates Ltd. 6722 Izaki Group (Fragiolig Holdings Ltd.) 6531Ayrton Drug Manufacturing Ltd. 2834 Adcock Ingram Holdings Ltd. 2834Banca Italease SpA 6021 Banco Popolare Società Cooperativa SCRL 6021Bangkok Bank Public Co. Ltd. (ACL Bank Public Co.Ltd.)6021 Industrial & Commercial Bank of China Ltd. 6081Bank of Thailand (Siam City Bank Public Co. Ltd.) 6021 Thanachart Capital Public Co., Ltd. (Thanachart BankPublic Co. Ltd.)6799Bankier.pl SA 7375 Naspers Ltd. (MIH Allegro BV) 7375BioXell SpA 2836 Cosmo Pharmaceuticals SpA 2834Cadbury PLC 2066 Kraft Foods, Inc. 2099Cagim Real Estate Corp. 6798 BTB Real Estate Investment Trust 6798Canext Energy Ltd. 1311 TriOil Resources Ltd. 1311Care UK PLC 8011 Bridgepoint Capital Ltd. (Warwick Bidco Ltd.) 6771Consolidated Mercantile, Inc. 6799 Genterra, Inc. 6531Constantia Packaging AG 2653 JPMorgan Chase & Co., Inc. (One Equity PartnersEurope GmbH)6211DBS Bank Ltd. (Cholamandalam DBS Finance Ltd.) 6153 Murugappa Group 3714Delta PLC 2819 Valmont Industries, Inc. (Valmont Group Pty Ltd.) 3441Forge Group Ltd. 1522 Murray & Roberts Holdings Ltd. (Clough Ltd.) 1541Geneart AG 8731 Life Technologies Corp. (Applied BiosystemsDeutschland GmbH)8731Ginger SA 1629 Grontmij NV 8711Glisten PLC 2066 Raisio Oyj (Raisio UK Ltd.) 2043GVT Holding SA 4812 Vivendi SA 2741HandMade PLC 7812 Almorah Services Ltd. 6799Higashiyama Film Co. Ltd. 2671 CITIC Capital Holdings Ltd. (HF Holdings KK) 6282Houtoku Co. Ltd. 2522 Oyama KK (Iris Ohyama, Inc.) 5021Inspired Gaming Group PLC 7372 Vitruvian Partners LLP 6771Intelligent Wave, Inc. 7372 Dai Nippon Printing Co., Ltd. 2731Intergold Ltd. 3479 Visant Holding Corp. (Visant Corp.) 2741International Absorbents, Inc. 2899 Kinderhook Industries LLC 6771Copyright © <strong>2010</strong>, FactSet Mergerstat, LLC. All rights reserved. 24
Mergerstat <strong>Control</strong> <strong>Premium</strong> <strong>Study</strong><strong>2nd</strong> <strong>Quarter</strong> <strong>2010</strong>Target NameTargetSICAcquirer NameAcquirerSICIteration Energy Ltd. 1311 Storm Ventures International, Inc. 1311Kawamura Cycle Co. Ltd. 3751 Max Co., Ltd. 5044Kelman Technologies, Inc. 1382 Seyco Operations Ltd. 1382Madison Energy Corp. 1311 Clampett Energy Ltd. 1311MAMA Group PLC 7929 HMV Group PLC 7822Marktec Corp. 2899 CAS Capital, Inc. (CCH5 KK) 6771Matrikon, Inc. 7379 Honeywell International, Inc. 3724Mitsui & Co. Ltd. / Aucnet, Inc. / J21 KK (JapanAutomobile Auction, Inc.)5521 Gallop KK 6799Morgan Stanley (Compagnie La Lucette) 1041 Icade SA 6798Morse PLC 7373 Duke Street General Partner Ltd. (2e2 Ltd.) 6771Mulvihill Capital Management, Inc. (First <strong>Premium</strong>Income Trust PLUS)6726 Premier Canadian Income Fund 6726MW Trade SA 6799 Getin Holding SA 6282PacMag Metals Ltd. 1041 Entree Gold, Inc. 1041Pan Andean Resources PLC 1311 Petrobank Energy & Resources Ltd. (PetromineralesLtd.)1311Porthus NV 7372 The Descartes Systems Group, Inc. 7372Redcliffe Exploration, Inc. 1381 Paramount Resources Ltd. 1311Rensburg Sheppards PLC 6771 Investec PLC 6211Result Energy, Inc. 1311 PetroBakken Energy Ltd. 1381Royal Laser Corp. 2541 Triple M Metal LP 3339RPG Cables Ltd. 3357 KEC Infrastructures Limited 3612Rusina Mining NL 1041 European Nickel PLC 1061Schneider Power, Inc. 4931 Quantum Fuel Systems Technologies Worldwide, Inc. 3674SECOM Co., Ltd. (Tokyo Biso Kogyo Corp.) 7349 TB Holdings KK 6799SkillSoft PLC 7372 Skillsoft PLC /Private Group/ 6799SMIT Internationale NV 4492 Koninklijke Boskalis Westminster NV 1629Sodifrance 7373 Groupe Mazin SARL (HP2M SARL) 7373SSH Corp. Ltd. 5049 KS Energy Services Ltd. (KS Distribution Pte Ltd.) 1389State of São Paulo (Banco Nossa Caixa SA) 6021 Banco do Brasil SA 6021Sumitomo Corp. (Interhides Public Co. Ltd.) 3199 Interhides Public Co. Ltd. /Thumrongsakulvong/ 6799Sun Wave Corp. 3631 JS Group Corp. 3442Tandberg ASA 7373 Cisco Systems, Inc. 3661Copyright © <strong>2010</strong>, FactSet Mergerstat, LLC. All rights reserved. 25
Mergerstat <strong>Control</strong> <strong>Premium</strong> <strong>Study</strong><strong>2nd</strong> <strong>Quarter</strong> <strong>2010</strong>Target NameTargetSICAcquirer NameAcquirerSICTPV Technology Ltd. 3577 TPV Technology Ltd. /Private Group/ 6799Trulscom AB (Tilgin AB) 4899 MGA Holding AB 6799Unicharm Petcare Corp. 2047 UniCharm Corp. 2676Unimat Life Corp. 5149 Unimat Holding Co., Ltd. (Unimat Rainbow KK) 6799Vault Minerals, Inc. 1099 Queenston Mining, Inc. 1041Votorantim Novos Negócios Ltda. / PátriaInvestimentos (TIVIT Terceirizacao de ProcessosServicos e Technologia SA)7379 Apax Partners LLP 6799WAREHOUSE Co., Ltd. 7841 GEO Corp. 7841West Energy Ltd. 1311 Daylight Resources Trust 6726Copyright © <strong>2010</strong>, FactSet Mergerstat, LLC. All rights reserved. 26
Mergerstat <strong>Control</strong> <strong>Premium</strong> <strong>Study</strong><strong>2nd</strong> <strong>Quarter</strong> <strong>2010</strong>Announce & Closing Dates, Total Deal Value (Domestic)Target NameAnnounceDateClose DateTargetMarket Valueof Equity($Mil)CurrencyExchangeRatePctg. ofCommonPreviouslyHeld by Acq.Pctg. OfCommonHeld by Acq.After Trans.3Com Corp. 11/11/09 04/12/10 3,145.5 1.00 0.0 100.0Airvana, Inc. 12/18/09 04/09/10 486.4 1.00 0.0 100.0Allied Capital Corp. 10/26/09 04/01/10 866.7 1.00 0.0 100.0AMICAS, Inc. 02/22/10 04/28/10 217.3 1.00 0.0 100.0BJ Services Co. LLC 08/31/09 04/28/10 6,779.3 1.00 0.0 100.0Brink's Home Security Holdings, Inc. 01/18/10 05/14/10 1,964.1 1.00 0.0 100.0BWAY Holding Co. 03/29/10 06/16/10 448.3 1.00 0.0 100.0Chordiant Software, Inc. 03/15/10 04/22/10 151.8 1.00 0.0 100.0COMSYS IT Partners, Inc. 02/02/10 04/05/10 372.8 1.00 0.0 100.0Dialysis Corp. of America 04/14/10 06/03/10 108.1 1.00 0.0 100.0Diedrich Coffee, Inc. 11/23/09 05/11/10 200.4 1.00 0.0 100.0EXX, Inc. 06/21/10 06/21/10 15.5 1.00 0.0 100.0Facet Biotech Corp. 03/09/10 04/21/10 677.5 1.00 0.0 100.0First Litchfield Financial Corp. 10/26/09 04/07/10 35.4 1.00 0.0 100.0Global Med Technologies, Inc. 02/01/10 04/12/10 46.9 1.00 0.0 100.0Harleysville National Corp. 07/27/09 04/09/10 299.6 1.00 0.0 100.0ICO, Inc. 12/02/09 04/30/10 234.4 1.00 0.0 100.0Iowa Telecommunications Services, Inc. 11/24/09 06/01/10 546.6 1.00 0.0 100.0K-Tron International, Inc. 01/11/10 04/01/10 426.3 1.00 0.0 100.0Lodgian, Inc. 01/22/10 04/19/10 54.1 1.00 0.0 100.0Meridian Resource Corp. 12/23/09 05/13/10 30.5 1.00 0.0 100.0O.A.K. Financial Corp. 01/08/10 04/30/10 86.2 1.00 0.0 100.0OSI Pharmaceuticals, Inc. 03/01/10 06/09/10 3,519.4 1.00 0.0 100.0PECO II, Inc 02/18/10 04/16/10 16.8 1.00 0.0 100.0PLATO Learning, Inc. 03/26/10 05/25/10 136.7 1.00 0.0 100.0Protection One, Inc. 04/26/10 06/04/10 394.2 1.00 0.0 100.0RiskMetrics Group, Inc. 03/01/10 06/01/10 1,500.4 1.00 0.0 100.0Silicon Storage Technology, Inc. 02/02/10 04/08/10 352.0 1.00 0.0 100.0Spectrum Brands, Inc. 02/09/10 06/16/10 526.9 1.00 39.0 100.0Switch & Data Facilities Co., Inc. 10/21/09 05/03/10 683.1 1.00 0.0 100.0Techwell, Inc. 03/22/10 04/27/10 400.7 1.00 0.0 100.0Terra Industries, Inc. 03/02/10 04/15/10 4,568.4 1.00 0.0 100.0Varian, Inc. 07/27/09 05/14/10 1,512.4 1.00 0.0 100.0Copyright © <strong>2010</strong>, FactSet Mergerstat, LLC. All rights reserved. 27
Mergerstat <strong>Control</strong> <strong>Premium</strong> <strong>Study</strong><strong>2nd</strong> <strong>Quarter</strong> <strong>2010</strong>Target NameAnnounceDateClose DateTargetMarket Valueof Equity($Mil)CurrencyExchangeRatePctg. ofCommonPreviouslyHeld by Acq.Pctg. OfCommonHeld by Acq.After Trans.White Electronic Designs Corp. 03/30/10 04/30/10 163.2 1.00 0.0 100.0XTO Energy, Inc. 12/14/09 06/25/10 24,915.7 1.00 0.0 100.0Youbet.com, Inc. 11/11/09 06/02/10 119.9 1.00 0.0 100.0Zareba Systems, Inc. 01/11/10 04/01/10 22.6 1.00 0.0 100.0Zenith National Insurance Corp. 02/18/10 05/20/10 1,321.0 1.00 8.2 100.0Copyright © <strong>2010</strong>, FactSet Mergerstat, LLC. All rights reserved. 28
Mergerstat <strong>Control</strong> <strong>Premium</strong> <strong>Study</strong><strong>2nd</strong> <strong>Quarter</strong> <strong>2010</strong>Announce & Closing Dates, Total Deal Value (International) *Target NameAnnounceDateClose DateTargetMarket Valueof Equity($Mil)CurrencyExchangeRatePctg. OfCommonPreviouslyHeld by Acq.Pctg. OfCommonHeld by Acq.After Trans.Advent International Corp. (Herlitz AG) 11/05/09 04/09/10 19.9 1.34 0.0 66.0AfNat Resources Ltd. 03/18/10 06/14/10 18.9 1.48 0.0 100.0Atlas Estates Ltd. 04/16/10 06/22/10 41.8 1.48 33.0 100.0Ayrton Drug Manufacturing Ltd. 11/23/09 04/01/10 15.9 0.71 0.0 65.6Banca Italease SpA 03/15/09 04/01/10 236.9 1.35 30.7 100.0Bangkok Bank Public Co. Ltd. (ACL Bank 09/30/09 04/21/10 552.7 0.03 0.0 97.2Public Co. Ltd.)Bank of Thailand (Siam City Bank Public Co. 03/11/10 04/09/10 1,013.8 0.03 5.0 52.6Ltd.)Bankier.pl SA 06/09/09 05/25/10 18.4 0.29 0.0 100.0BioXell SpA 11/18/09 05/20/10 31.3 1.23 0.0 100.0Cadbury PLC 09/07/09 04/19/10 18,561.1 1.53 0.0 100.0Cagim Real Estate Corp. 03/26/10 06/08/10 13.9 0.95 0.0 100.0Canext Energy Ltd. 02/10/10 04/12/10 47.9 1.00 0.0 100.0Care UK PLC 03/03/10 04/27/10 427.0 1.53 0.0 100.0Consolidated Mercantile, Inc. 03/09/09 05/11/10 9.5 0.98 0.0 100.0Constantia Packaging AG 10/12/09 06/18/10 736.0 1.24 0.0 91.5DBS Bank Ltd. (Cholamandalam DBS 03/30/10 04/09/10 51.1 0.02 37.5 75.0Finance Ltd.)Delta PLC 03/04/10 05/12/10 422.7 1.49 0.0 100.0Forge Group Ltd. 04/07/10 05/12/10 64.3 0.89 13.0 56.5Geneart AG 04/09/10 04/09/10 41.0 1.34 0.0 58.6Ginger SA 06/15/10 06/21/10 77.0 1.24 0.0 51.8Glisten PLC 02/10/10 04/09/10 30.4 1.54 0.0 100.0GVT Holding SA 03/26/10 05/12/10 562.3 0.56 87.0 100.0HandMade PLC 04/30/10 06/07/10 2.0 1.45 39.7 100.0Higashiyama Film Co. Ltd. 05/14/10 06/17/10 16.9 0.01 0.0 63.1Houtoku Co. Ltd. 04/09/10 05/28/10 9.7 0.01 31.5 96.0Inspired Gaming Group PLC 05/04/10 06/30/10 111.4 1.50 0.0 100.0Intelligent Wave, Inc. 02/10/10 04/03/10 37.0 0.01 0.0 54.0Intergold Ltd. 03/02/10 04/27/10 4.4 0.99 0.0 100.0* Values are in U.S. Dollars, see page 54-56 for currency denomination of exchange rates.Copyright © <strong>2010</strong>, FactSet Mergerstat, LLC. All rights reserved. 29
Mergerstat <strong>Control</strong> <strong>Premium</strong> <strong>Study</strong><strong>2nd</strong> <strong>Quarter</strong> <strong>2010</strong>Target NameAnnounceDateClose DateTargetMarket Valueof Equity($Mil)CurrencyExchangeRatePctg. OfCommonPreviouslyHeld by Acq.Pctg. OfCommonHeld by Acq.After Trans.International Absorbents, Inc. 12/15/09 05/27/10 30.6 0.95 0.0 100.0Iteration Energy Ltd. 05/03/10 06/29/10 367.5 0.95 0.0 100.0Kawamura Cycle Co. Ltd. 05/14/10 06/18/10 11.5 0.01 23.7 64.6Kelman Technologies, Inc. 03/09/10 05/13/10 1.2 0.98 0.0 100.0Madison Energy Corp. 01/12/10 04/08/10 5.0 0.99 0.0 100.0MAMA Group PLC 12/23/09 04/16/10 60.6 1.54 9.8 100.0Marktec Corp. 05/14/10 06/29/10 49.5 0.01 22.6 95.0Matrikon, Inc. 05/13/10 06/28/10 136.4 0.97 0.0 100.0Mitsui & Co. Ltd. / Aucnet, Inc. / J21 KK 04/15/10 06/03/10 132.9 0.01 0.0 95.2(Japan Automobile Auction, Inc.)Morgan Stanley (Compagnie La Lucette) 12/23/09 05/14/10 291.8 1.24 0.0 100.0Morse PLC 04/26/10 06/21/10 103.4 1.48 0.0 100.0Mulvihill Capital Management, Inc. (First 04/29/10 06/30/10 23.8 0.94 0.0 100.0<strong>Premium</strong> Income Trust PLUS)MW Trade SA 06/16/10 06/16/10 8.0 0.30 0.0 52.0PacMag Metals Ltd. 11/30/09 06/30/10 36.2 0.84 0.0 100.0Pan Andean Resources PLC 12/09/09 04/14/10 27.6 1.55 0.0 100.0Porthus NV 12/14/09 04/16/10 40.1 1.35 0.0 100.0Redcliffe Exploration, Inc. 05/10/10 06/29/10 38.8 0.95 18.0 100.0Rensburg Sheppards PLC 03/30/10 06/25/10 270.4 1.50 47.0 100.0Result Energy, Inc. 01/28/10 04/01/10 35.6 0.99 0.0 100.0Royal Laser Corp. 04/15/10 06/16/10 43.5 0.98 0.0 100.0RPG Cables Ltd. 10/30/09 04/27/10 26.8 0.02 0.0 100.0Rusina Mining NL 02/03/10 06/16/10 22.2 0.86 0.0 100.0Schneider Power, Inc. 11/25/09 04/19/10 11.6 0.98 0.0 100.0SECOM Co., Ltd. (Tokyo Biso Kogyo Corp.) 04/16/10 06/04/10 115.0 0.01 20.4 96.8SkillSoft PLC 02/12/10 05/26/10 1,004.3 1.22 0.0 100.0SMIT Internationale NV 11/12/09 05/05/10 1,375.0 1.29 0.0 100.0Sodifrance 01/20/09 04/23/10 9.6 1.34 36.0 92.0SSH Corp. Ltd. 12/08/09 05/07/10 80.0 0.72 28.2 100.0State of São Paulo (Banco Nossa Caixa SA) 11/20/08 04/06/10 3,059.8 0.57 0.0 71.3Sumitomo Corp. (Interhides Public Co. Ltd.) 04/01/10 04/01/10 7.0 0.03 45.0 65.0Sun Wave Corp. 12/14/09 04/01/10 168.4 0.01 30.0 100.0* Values are in U.S. Dollars, see page 54-56 for currency denomination of exchange rates.Copyright © <strong>2010</strong>, FactSet Mergerstat, LLC. All rights reserved. 30
Mergerstat <strong>Control</strong> <strong>Premium</strong> <strong>Study</strong><strong>2nd</strong> <strong>Quarter</strong> <strong>2010</strong>Target NameAnnounceDateClose DateTargetMarket Valueof Equity($Mil)CurrencyExchangeRatePctg. OfCommonPreviouslyHeld by Acq.Pctg. OfCommonHeld by Acq.After Trans.Tandberg ASA 10/01/09 04/19/10 3,214.9 0.17 0.0 100.0TPV Technology Ltd. 01/29/10 04/22/10 111.7 0.13 43.0 50.1Trulscom AB (Tilgin AB) 02/22/10 04/27/10 3.2 0.14 43.3 68.9Unicharm Petcare Corp. 04/30/10 06/17/10 691.8 0.01 38.7 97.3Unimat Life Corp. 03/19/10 05/12/10 224.0 0.01 33.7 95.6Vault Minerals, Inc. 03/05/10 04/20/10 15.3 1.00 0.0 100.0Votorantim Novos Negócios Ltda. / PátriaInvestimentos (TIVIT Terceirizacao deProcessos Servicos e Technologia SA)05/10/10 06/07/10 467.3 0.53 0.0 54.3WAREHOUSE Co., Ltd. 05/14/10 06/29/10 26.2 0.01 8.1 65.1West Energy Ltd. 03/05/10 05/12/10 445.3 0.98 0.0 100.0* Values are in U.S. Dollars, see page 54-56 for currency denomination of exchange rates.Copyright © <strong>2010</strong>, FactSet Mergerstat, LLC. All rights reserved. 31
Mergerstat <strong>Control</strong> <strong>Premium</strong> <strong>Study</strong><strong>2nd</strong> <strong>Quarter</strong> <strong>2010</strong>Purchase Price/Share – Mergerstat Unaffected Price (Domestic) *Target NamePurchasePrice PerShareMergerstatUnaffectedPricePrice1 DayPrice1 WeekPrice1 MonthPrice2 Months3Com Corp. 7.90 5.41 5.41 5.25 5.65 4.68Airvana, Inc. 7.65 6.24 6.24 6.26 6.40 6.88Allied Capital Corp. 4.82 2.73 2.73 2.97 3.16 3.21AMICAS, Inc. 6.05 4.42 5.37 5.35 5.35 4.30BJ Services Co. LLC 23.08 15.43 15.43 15.47 14.18 13.63Brink's Home Security Holdings, Inc. 42.82 31.42 31.36 32.27 31.85 33.30BWAY Holding Co. 20.00 17.35 17.35 17.37 15.07 17.06Chordiant Software, Inc. 5.00 3.03 3.81 3.63 3.46 3.57COMSYS IT Partners, Inc. 17.65 13.23 13.23 12.55 8.89 8.19Dialysis Corp. of America 11.25 6.52 6.52 6.23 6.63 6.56Diedrich Coffee, Inc. 35.00 21.80 25.99 26.16 29.62 20.05EXX, Inc. 1.55 0.58 0.58 0.51 0.51 0.45Facet Biotech Corp. 27.00 8.82 16.51 17.05 15.77 17.77First Litchfield Financial Corp. 15.00 5.88 5.88 6.03 6.50 6.25Global Med Technologies, Inc. 1.22 0.74 0.74 0.73 0.78 0.75Harleysville National Corp. 6.94 4.00 4.00 4.81 5.08 6.36ICO, Inc. 8.45 4.20 4.20 4.21 3.62 4.29Iowa Telecommunications Services, Inc. 16.48 12.69 12.69 12.51 12.11 13.22K-Tron International, Inc. 150.00 113.52 113.52 112.95 106.99 107.51Lodgian, Inc. 2.50 1.78 1.78 1.75 1.37 1.34Meridian Resource Corp. 0.33 0.26 0.26 0.25 0.30 0.36O.A.K. Financial Corp. 31.89 18.00 18.00 17.35 18.55 19.25OSI Pharmaceuticals, Inc. 57.50 37.02 37.02 37.05 34.68 31.06PECO II, Inc 5.86 3.88 3.88 3.50 5.33 5.15PLATO Learning, Inc. 5.60 4.91 4.91 4.80 4.00 3.99Protection One, Inc. 15.50 13.76 13.76 12.51 11.06 9.32RiskMetrics Group, Inc. 21.69 18.63 18.63 18.80 17.38 15.91Silicon Storage Technology, Inc. 3.05 2.72 2.72 2.69 2.56 2.32Spectrum Brands, Inc. 28.20 29.00 29.00 29.55 26.50 21.50Switch & Data Facilities Co., Inc. 19.43 14.23 14.23 14.96 14.64 13.85Techwell, Inc. 18.50 12.44 12.44 11.29 12.36 11.59* All stock prices are in U.S. Dollars..www.factset.com 32
Mergerstat <strong>Control</strong> <strong>Premium</strong> <strong>Study</strong><strong>2nd</strong> <strong>Quarter</strong> <strong>2010</strong>Target NamePurchasePrice PerShareMergerstatUnaffectedPricePrice1 DayPrice1 WeekPrice1 MonthPrice2 MonthsTerra Industries, Inc. 45.64 15.03 41.20 41.05 33.16 32.19Varian, Inc. 52.00 39.20 39.20 38.00 40.04 34.14White Electronic Designs Corp. 7.00 5.46 5.46 5.41 5.23 5.00XTO Energy, Inc. 42.64 41.49 41.49 41.15 43.05 44.32Youbet.com, Inc. 2.83 2.22 2.22 2.21 2.26 2.23Zareba Systems, Inc. 9.00 4.73 4.73 4.39 4.47 4.80Zenith National Insurance Corp. 38.00 28.91 28.91 28.05 30.01 29.47* All stock prices are in U.S. Dollars..www.factset.com 33
Mergerstat <strong>Control</strong> <strong>Premium</strong> <strong>Study</strong><strong>2nd</strong> <strong>Quarter</strong> <strong>2010</strong>Purchase Price/Share – Mergerstat Unaffected Price (International) *Target NamePurchasePrice PerShareMergerstatUnaffectedPricePrice1 DayPrice1 WeekPrice1 MonthPrice2 MonthsAdvent International Corp. (Herlitz AG) 1.90 2.05 2.05 2.02 1.90 1.70AfNat Resources Ltd. 0.03 0.02 0.02 0.02 0.02 0.02Atlas Estates Ltd. 0.90 0.81 0.95 0.81 0.76 0.60Ayrton Drug Manufacturing Ltd. 0.16 0.13 0.13 0.13 0.15 0.15Banca Italease SpA 1.50 1.08 1.32 1.08 1.78 2.22Bangkok Bank Public Co. Ltd. (ACL Bank Public Co. 11.50 5.00 10.00 8.95 8.90 7.65Ltd.)Bank of Thailand (Siam City Bank Public Co. Ltd.) 32.50 7.50 30.50 30.00 29.50 28.00Bankier.pl SA 8.70 7.73 8.07 7.73 8.01 7.70BioXell SpA 5.67 3.77 4.10 4.04 4.42 4.69Cadbury PLC 8.83 5.81 5.71 5.81 5.83 5.28Cagim Real Estate Corp. 1.05 0.75 0.75 0.90 0.80 0.83Canext Energy Ltd. 0.55 0.49 0.49 0.48 0.60 0.41Care UK PLC 4.50 4.07 4.12 4.19 4.08 4.20Consolidated Mercantile, Inc. 1.91 1.40 1.40 1.39 1.35 1.38Constantia Packaging AG 38.67 37.79 37.79 33.40 33.45 30.00DBS Bank Ltd. (Cholamandalam DBS Finance Ltd.) 91.00 89.80 89.80 85.45 71.05 62.55Delta PLC 1.85 1.54 1.54 1.53 1.50 1.42Forge Group Ltd. 2.10 2.96 2.96 2.93 2.38 2.26Geneart AG 11.59 9.66 11.45 10.21 9.35 7.60Ginger SA 28.20 16.85 16.85 16.66 16.06 17.80Glisten PLC 1.40 0.78 0.87 0.80 0.80 0.80GVT Holding SA 56.00 57.53 57.53 57.32 55.99 56.20HandMade PLC 0.01 0.10 0.09 0.09 0.09 0.09Higashiyama Film Co. Ltd. 650.00 800.00 800.00 800.00 781.00 575.00Houtoku Co. Ltd. 120.00 83.00 83.00 97.00 82.00 78.00Inspired Gaming Group PLC 0.60 0.50 0.50 0.48 0.52 0.44Intelligent Wave, Inc. 26,100.00 14,500.00 14,500.00 13,710.00 14,440.00 14,990.00Intergold Ltd. 0.16 0.03 0.03 0.03 0.02 0.02International Absorbents, Inc. 5.04 4.02 4.02 3.99 3.85 3.35Iteration Energy Ltd. 1.83 1.66 1.66 1.66 1.43 1.61Kawamura Cycle Co. Ltd. 100,000.00 78,400.00 78,400.00 85,200.00 81,000.00 80,400.00Kelman Technologies, Inc. 2.00 1.81 1.81 1.98 1.68 1.41* All stock prices are in home currency, See page 54-56 for currency denomination of stock prices.Copyright © <strong>2010</strong>, FactSet Mergerstat, LLC. All rights reserved. 34
Mergerstat <strong>Control</strong> <strong>Premium</strong> <strong>Study</strong><strong>2nd</strong> <strong>Quarter</strong> <strong>2010</strong>Target NamePurchasePrice PerShareMergerstatUnaffectedPricePrice1 DayPrice1 WeekPrice1 MonthPrice2 MonthsMadison Energy Corp. 0.20 0.22 0.22 0.16 0.15 0.16MAMA Group PLC 0.05 0.04 0.06 0.06 0.05 0.05Marktec Corp. 1,400.00 920.00 920.00 910.00 930.00 975.00Matrikon, Inc. 4.50 3.95 3.95 3.70 3.60 3.58Mitsui & Co. Ltd. / Aucnet, Inc. / J21 KK (Japan 140,000.00 91,500.00 91,500.00 88,100.00 96,100.00 92,800.00Automobile Auction, Inc.)Morgan Stanley (Compagnie La Lucette) 39.28 10.30 11.00 11.30 10.74 10.37Morse PLC 0.51 0.41 0.48 0.40 0.38 0.40Mulvihill Capital Management, Inc. (First <strong>Premium</strong> 13.68 11.25 11.25 11.10 10.93 10.95Income Trust PLUS)MW Trade SA 6.25 6.50 7.25 7.37 6.14 5.35PacMag Metals Ltd. 0.32 0.24 0.23 0.24 0.27 0.20Pan Andean Resources PLC 0.15 0.13 0.13 0.13 0.13 0.12Porthus NV 12.50 10.40 10.40 10.39 9.99 10.24Redcliffe Exploration, Inc. 0.42 0.32 0.32 0.30 0.29 0.36Rensburg Sheppards PLC 7.76 6.20 6.20 6.25 5.89 5.90Result Energy, Inc. 0.42 0.42 0.42 0.42 0.42 0.31Royal Laser Corp. 0.46 0.37 0.37 0.37 0.38 0.28RPG Cables Ltd. 28.72 24.10 24.10 24.05 21.00 18.55Rusina Mining NL 0.09 0.09 0.09 0.10 0.09 0.11Schneider Power, Inc. 0.17 0.09 0.09 0.09 0.09 0.12SECOM Co., Ltd. (Tokyo Biso Kogyo Corp.) 905.00 680.00 680.00 680.00 689.00 670.00SkillSoft PLC 8.31 7.17 7.17 7.01 7.20 6.85SMIT Internationale NV 60.00 55.60 55.60 54.39 54.50 51.72Sodifrance 4.00 3.62 3.62 3.61 3.59 2.54SSH Corp. Ltd. 0.29 0.24 0.24 0.24 0.21 0.21State of São Paulo (Banco Nossa Caixa SA) 70.63 51.30 51.30 51.95 30.11 38.66Sumitomo Corp. (Interhides Public Co. Ltd.) 3.80 7.00 7.00 7.05 6.15 6.05Sun Wave Corp. 361.57 242.00 242.00 243.00 245.00 233.00Tandberg ASA 170.00 120.39 138.30 131.60 124.40 129.99TPV Technology Ltd. 5.20 4.80 4.88 4.85 4.70 4.19Trulscom AB (Tilgin AB) 2.05 1.74 1.74 2.00 1.90 2.00Unicharm Petcare Corp. 3,825.00 3,115.00 3,115.00 3,150.00 2,965.00 2,860.00Unimat Life Corp. 1,350.00 938.00 938.00 916.00 903.00 924.00* All stock prices are in U.S. Dollars..www.factset.com 35
Mergerstat <strong>Control</strong> <strong>Premium</strong> <strong>Study</strong><strong>2nd</strong> <strong>Quarter</strong> <strong>2010</strong>Target NamePurchasePrice PerShareMergerstatUnaffectedPricePrice1 DayPrice1 WeekPrice1 MonthPrice2 MonthsVault Minerals, Inc. 0.46 0.34 0.34 0.32 0.29 0.33Votorantim Novos Negócios Ltda. / PátriaInvestimentos (TIVIT Terceirizacao de ProcessosServicos e Technologia SA)18.10 16.50 16.50 17.17 17.87 15.07WAREHOUSE Co., Ltd. 410.00 331.00 331.00 323.00 360.00 325.00West Energy Ltd. 5.50 4.25 4.25 4.31 4.02 4.16* All stock prices are in U.S. Dollars..www.factset.com 36
Mergerstat <strong>Control</strong> <strong>Premium</strong> <strong>Study</strong><strong>2nd</strong> <strong>Quarter</strong> <strong>2010</strong>Mergerstat Unaffected <strong>Control</strong> <strong>Premium</strong> (Domestic)Target NameMergerstatUnaffected<strong>Control</strong><strong>Premium</strong><strong>Premium</strong>1 Day<strong>Premium</strong>1 Week<strong>Premium</strong>1 Month<strong>Premium</strong>2 Months3Com Corp. 46.0% 46.0% 50.5% 39.8% 68.8%Airvana, Inc. 22.6% 22.6% 22.2% 19.5% 11.2%Allied Capital Corp. 76.4% 76.4% 62.2% 52.4% 50.1%AMICAS, Inc. 36.9% 12.7% 13.1% 13.1% 40.7%BJ Services Co. LLC 49.6% 49.6% 49.2% 62.8% 69.3%Brink's Home Security Holdings, Inc. 36.3% 36.5% 32.7% 34.4% 28.6%BWAY Holding Co. 15.3% 15.3% 15.1% 32.7% 17.2%Chordiant Software, Inc. 65.0% 31.2% 37.7% 44.5% 40.1%COMSYS IT Partners, Inc. 33.4% 33.4% 40.6% 98.5% 115.5%Dialysis Corp. of America 72.5% 72.5% 80.6% 69.7% 71.5%Diedrich Coffee, Inc. 60.6% 34.7% 33.8% 18.2% 74.6%EXX, Inc. 167.2% 167.2% 206.9% 206.9% 243.7%Facet Biotech Corp. 206.1% 63.5% 58.4% 71.2% 51.9%First Litchfield Financial Corp. 155.3% 155.3% 149.0% 130.8% 140.0%Global Med Technologies, Inc. 64.9% 64.9% 67.1% 56.4% 62.7%Harleysville National Corp. 73.6% 73.6% 44.4% 36.7% 9.2%ICO, Inc. 101.3% 101.3% 100.8% 133.5% 97.0%Iowa Telecommunications Services, Inc. 29.9% 29.9% 31.7% 36.1% 24.7%K-Tron International, Inc. 32.1% 32.1% 32.8% 40.2% 39.5%Lodgian, Inc. 40.8% 40.8% 42.9% 82.5% 86.6%Meridian Resource Corp. 27.0% 27.0% 29.5% 10.0% -8.3%O.A.K. Financial Corp. 77.2% 77.2% 83.8% 71.9% 65.7%OSI Pharmaceuticals, Inc. 55.3% 55.3% 55.2% 65.8% 85.1%PECO II, Inc 51.0% 51.0% 67.4% 9.9% 13.8%PLATO Learning, Inc. 14.1% 14.1% 16.7% 40.0% 40.4%Protection One, Inc. 12.6% 12.6% 23.9% 40.1% 66.3%RiskMetrics Group, Inc. 16.4% 16.4% 15.4% 24.8% 36.3%Silicon Storage Technology, Inc. 12.1% 12.1% 13.4% 19.1% 31.5%Spectrum Brands, Inc. -2.8% * -2.8% -4.6% 6.4% 31.2%Switch & Data Facilities Co., Inc. 36.6% 36.6% 29.9% 32.7% 40.3%Techwell, Inc. 48.7% 48.7% 63.9% 49.7% 59.6%Terra Industries, Inc. 203.6% 10.8% 11.2% 37.6% 41.8%* Not used in average or median calculations.Copyright © <strong>2010</strong>, FactSet Mergerstat, LLC. All rights reserved. 37
Mergerstat <strong>Control</strong> <strong>Premium</strong> <strong>Study</strong><strong>2nd</strong> <strong>Quarter</strong> <strong>2010</strong>Target NameMergerstatUnaffected<strong>Control</strong><strong>Premium</strong><strong>Premium</strong>1 Day<strong>Premium</strong>1 Week<strong>Premium</strong>1 Month<strong>Premium</strong>2 MonthsVarian, Inc. 32.7% 32.7% 36.8% 29.9% 52.3%White Electronic Designs Corp. 28.2% 28.2% 29.4% 33.8% 40.0%XTO Energy, Inc. 2.8% 2.8% 3.6% -1.0% -3.8%Youbet.com, Inc. 27.3% 27.3% 27.8% 25.0% 26.7%Zareba Systems, Inc. 90.3% 90.3% 105.0% 101.3% 87.5%Zenith National Insurance Corp. 31.4% 31.4% 35.5% 26.6% 28.9%Range: High 206.1% 167.2% 206.9% 206.9% 243.7%Low -2.8% -2.8% -4.6% -1.0% -8.3%Median: 40.8% 34.0% 36.2% 38.7% 41.2%Average: 58.2% 45.6% 47.8% 50.1% 54.7%* Not used in average or median calculations.www.factset.com 38
Mergerstat <strong>Control</strong> <strong>Premium</strong> <strong>Study</strong><strong>2nd</strong> <strong>Quarter</strong> <strong>2010</strong>Mergerstat Unaffected <strong>Control</strong> <strong>Premium</strong> (International)Target NameMergerstatUnaffected<strong>Control</strong><strong>Premium</strong><strong>Premium</strong>1 Day<strong>Premium</strong>1 Week<strong>Premium</strong>1 Month<strong>Premium</strong>2 MonthsAdvent International Corp. (Herlitz AG) -7.3% * -7.3% -5.9% 0.0% 41.2%AfNat Resources Ltd. 50.0% 60.0% 50.0% 84.6% 51.3%Atlas Estates Ltd. 11.1% -5.3% 11.1% 18.0% 51.3%Ayrton Drug Manufacturing Ltd. 23.1% 23.1% 23.1% 6.7% 6.7%Banca Italease SpA 39.5% 14.0% 39.5% -15.9% -32.4%Bangkok Bank Public Co. Ltd. (ACL Bank Public Co. 130.0% 15.0% 28.5% 29.2% 50.3%Ltd.)Bank of Thailand (Siam City Bank Public Co. Ltd.) 333.3% 6.6% 8.3% 10.2% 16.1%Bankier.pl SA 12.5% 7.8% 12.5% 8.6% 13.0%BioXell SpA 50.3% 38.2% 40.4% 28.4% 20.9%Cadbury PLC 52.0% 54.8% 52.0% 51.5% 67.4%Cagim Real Estate Corp. 40.0% 40.0% 16.7% 31.3% 27.3%Canext Energy Ltd. 11.2% 11.2% 13.5% -9.2% 32.9%Care UK PLC 10.6% 9.2% 7.4% 10.3% 7.1%Consolidated Mercantile, Inc. 36.0% 36.0% 37.3% 41.4% 38.5%Constantia Packaging AG 2.3% 2.3% 15.8% 15.6% 28.9%DBS Bank Ltd. (Cholamandalam DBS Finance Ltd.) 1.3% 1.3% 6.5% 28.1% 45.5%Delta PLC 20.3% 20.3% 20.7% 23.7% 30.3%Forge Group Ltd. -29.1% * -29.1% -28.3% -11.8% -7.1%Geneart AG 20.0% 1.2% 13.5% 24.0% 52.5%Ginger SA 67.4% 67.4% 69.3% 75.6% 58.4%Glisten PLC 80.6% 61.8% 76.1% 76.1% 75.0%GVT Holding SA -2.7% * -2.7% -2.3% 0.0% -0.4%HandMade PLC -89.5% * -88.9% -88.9% -88.9% -88.9%Higashiyama Film Co. Ltd. -18.8% * -18.8% -18.8% -16.8% 13.0%Houtoku Co. Ltd. 44.6% 44.6% 23.7% 46.3% 53.8%Inspired Gaming Group PLC 21.2% 21.2% 25.7% 16.5% 37.9%Intelligent Wave, Inc. 80.0% 80.0% 90.4% 80.7% 74.1%Intergold Ltd. 471.4% 471.4% 384.8% 700.0% 595.7%International Absorbents, Inc. 25.4% 25.4% 26.3% 30.9% 50.4%Iteration Energy Ltd. 10.2% 10.2% 10.2% 28.2% 13.6%Kawamura Cycle Co. Ltd. 27.6% 27.6% 17.4% 23.5% 24.4%Kelman Technologies, Inc. 10.8% 10.8% 1.3% 19.4% 42.3%* Not used in average or median calculations.Copyright © <strong>2010</strong>, FactSet Mergerstat, LLC. All rights reserved. 39
Mergerstat <strong>Control</strong> <strong>Premium</strong> <strong>Study</strong><strong>2nd</strong> <strong>Quarter</strong> <strong>2010</strong>Target NameMergerstatUnaffected<strong>Control</strong><strong>Premium</strong><strong>Premium</strong>1 Day<strong>Premium</strong>1 Week<strong>Premium</strong>1 Month<strong>Premium</strong>2 MonthsMadison Energy Corp. -7.0% * -7.0% 25.0% 33.3% 25.0%MAMA Group PLC 23.4% -1.8% -1.8% 20.0% 20.0%Marktec Corp. 52.2% 52.2% 53.8% 50.5% 43.6%Matrikon, Inc. 13.9% 13.9% 21.6% 25.0% 25.7%Mitsui & Co. Ltd. / Aucnet, Inc. / J21 KK (Japan 53.0% 53.0% 58.9% 45.7% 50.9%Automobile Auction, Inc.)Morgan Stanley (Compagnie La Lucette) 281.3% 257.1% 247.6% 265.8% 278.6%Morse PLC 23.6% 6.3% 29.1% 34.2% 26.7%Mulvihill Capital Management, Inc. (First <strong>Premium</strong> 21.6% 21.6% 23.3% 25.2% 24.9%Income Trust PLUS)MW Trade SA -3.8% * -13.8% -15.2% 1.8% 16.8%PacMag Metals Ltd. 34.6% 40.4% 34.6% 19.6% 61.5%Pan Andean Resources PLC 15.4% 15.4% 15.4% 15.4% 25.0%Porthus NV 20.2% 20.2% 20.3% 25.1% 22.1%Redcliffe Exploration, Inc. 31.3% 31.3% 42.4% 47.4% 18.3%Rensburg Sheppards PLC 25.1% 25.1% 24.1% 31.7% 31.6%Result Energy, Inc. 1.2% 1.2% 0.0% 1.2% 35.5%Royal Laser Corp. 24.3% 24.3% 24.3% 22.7% 64.3%RPG Cables Ltd. 19.2% 19.2% 19.4% 36.8% 54.8%Rusina Mining NL -9.6% * -7.6% -10.5% -7.6% -22.7%Schneider Power, Inc. 85.6% 85.6% 85.6% 85.6% 39.2%SECOM Co., Ltd. (Tokyo Biso Kogyo Corp.) 33.1% 33.1% 33.1% 31.3% 35.1%SkillSoft PLC 15.9% 15.9% 18.5% 15.4% 21.3%SMIT Internationale NV 7.9% 7.9% 10.3% 10.1% 16.0%Sodifrance 10.5% 10.5% 10.8% 11.4% 57.5%SSH Corp. Ltd. 20.0% 20.0% 20.0% 37.1% 37.1%State of São Paulo (Banco Nossa Caixa SA) 37.7% 37.7% 36.0% 134.6% 82.7%Sumitomo Corp. (Interhides Public Co. Ltd.) -45.7% * -45.7% -46.1% -38.2% -37.2%Sun Wave Corp. 49.4% 49.4% 48.8% 47.6% 55.2%Tandberg ASA 41.2% 22.9% 29.2% 36.7% 30.8%TPV Technology Ltd. 8.3% 6.6% 7.2% 10.6% 24.1%Trulscom AB (Tilgin AB) 17.8% 17.8% 2.5% 7.9% 2.5%Unicharm Petcare Corp. 22.8% 22.8% 21.4% 29.0% 33.7%Unimat Life Corp. 43.9% 43.9% 47.4% 49.5% 46.1%* Not used in average or median calculations.www.factset.com 40
Mergerstat <strong>Control</strong> <strong>Premium</strong> <strong>Study</strong><strong>2nd</strong> <strong>Quarter</strong> <strong>2010</strong>Target NameMergerstatUnaffected<strong>Control</strong><strong>Premium</strong><strong>Premium</strong>1 Day<strong>Premium</strong>1 Week<strong>Premium</strong>1 Month<strong>Premium</strong>2 MonthsVault Minerals, Inc. 35.0% 35.0% 43.4% 58.3% 39.1%Votorantim Novos Negócios Ltda. / PátriaInvestimentos (TIVIT Terceirizacao de ProcessosServicos e Technologia SA)9.7% 9.7% 5.4% 1.3% 20.1%WAREHOUSE Co., Ltd. 23.9% 23.9% 26.9% 13.9% 26.2%West Energy Ltd. 29.4% 29.4% 27.6% 36.8% 32.2%Range: High 471.4% 471.4% 384.8% 700.0% 595.7%Low -89.5% -88.9% -88.9% -88.9% -88.9%Median: 24.3% 20.1% 21.5% 25.1% 31.9%Average: 47.7% 29.2% 29.7% 38.8% 42.0%* Not used in average or median calculations.www.factset.com 41
Mergerstat <strong>Control</strong> <strong>Premium</strong> <strong>Study</strong><strong>2nd</strong> <strong>Quarter</strong> <strong>2010</strong>Target Financials (Domestic)($ in Millions)Target NameTargetTICTargetSalesTargetIncomeTargetBook ValueTargetEBITTargetEBITDA3Com Corp. 3,295.4 1,264.8 35.0 341.2 74.0 187.4Airvana, Inc. 478.5 80.1 -13.2 113.5 -27.3 -23.1Allied Capital Corp. 2,457.9 354.3 92.4 1,201.3 258.9 259.3AMICAS, Inc. 319.4 89.1 -0.2 48.5 -1.7 4.3BJ Services Co. LLC 7,262.9 4,802.9 353.8 2,554.4 512.7 808.4Brink's Home Security Holdings, Inc. 1,961.0 565.1 62.7 523.4 101.4 192.6BWAY Holding Co. 842.4 910.9 39.2 -203.1 88.0 134.9Chordiant Software, Inc. 151.8 76.3 -8.9 29.2 -5.1 -2.1COMSYS IT Partners, Inc. 409.8 649.3 13.3 -1.8 18.4 26.5Dialysis Corp. of America 116.4 99.4 7.0 21.9 9.3 12.5Diedrich Coffee, Inc. 203.8 67.7 2.2 14.4 3.8 6.7EXX, Inc. 16.2 104.2 0.7 23.7 2.7 7.0Facet Biotech Corp. 701.9 46.1 -112.3 300.8 -110.6 -96.4First Litchfield Financial Corp. 126.5 25.8 -1.5 31.2 5.3 6.0Global Med Technologies, Inc. 51.7 31.8 1.5 -1.8 2.7 4.2Harleysville National Corp. 1,171.8 289.9 2.1 197.2 101.9 107.5ICO, Inc. 270.2 300.0 2.0 100.6 4.8 12.1Iowa Telecommunications Services, Inc. 1,138.1 253.4 17.1 -365.4 61.8 121.3K-Tron International, Inc. 738.0 190.8 18.6 101.3 29.9 35.9Lodgian, Inc. 62.9 188.5 -19.6 133.3 -6.4 28.0Meridian Resource Corp. 145.9 93.8 4.9 52.0 -2.3 48.0O.A.K. Financial Corp. 86.2 50.6 0.5 69.7 14.0 15.4OSI Pharmaceuticals, Inc. 3,852.4 428.1 86.9 665.2 171.3 181.4PECO II, Inc 16.7 42.3 -0.7 15.9 -0.7 0.8PLATO Learning, Inc. 136.9 64.7 1.7 11.2 2.0 12.9Protection One, Inc. 835.3 363.4 15.5 -133.3 64.0 113.5RiskMetrics Group, Inc. 1,656.8 303.4 31.9 -200.0 68.2 76.6Silicon Storage Technology, Inc. 292.4 252.3 -10.3 247.2 -5.6 3.1Spectrum Brands, Inc. 2,448.0 2,274.0 -68.0 -1,328.0 199.6 285.8Switch & Data Facilities Co., Inc. 842.6 195.8 -4.6 66.3 17.9 58.3Techwell, Inc. 406.2 63.2 3.5 100.8 5.4 6.2Terra Industries, Inc. 5,158.7 1,581.4 199.1 490.7 305.3 390.1Varian, Inc. 1,517.6 892.8 60.1 377.1 90.8 119.2White Electronic Designs Corp. 180.8 64.8 3.0 101.6 4.1 7.0Copyright © <strong>2010</strong>, FactSet Mergerstat, LLC. All rights reserved. 42
Mergerstat <strong>Control</strong> <strong>Premium</strong> <strong>Study</strong><strong>2nd</strong> <strong>Quarter</strong> <strong>2010</strong>($ in Millions)Target NameTargetTICTargetSalesTargetIncomeTargetBook ValueTargetEBITTargetEBITDAXTO Energy, Inc. 35,376.3 8,683.0 1,762.0 15,901.0 3,336.0 6,360.0Youbet.com, Inc. 128.9 112.1 2.3 17.0 4.0 10.8Zareba Systems, Inc. 23.3 30.8 1.3 7.9 1.9 2.6Zenith National Insurance Corp. 1,424.3 463.1 123.5 1,037.9 146.4 156.2www.factset.com 43
Mergerstat <strong>Control</strong> <strong>Premium</strong> <strong>Study</strong><strong>2nd</strong> <strong>Quarter</strong> <strong>2010</strong>Target Financials (International)($ in Millions)Target NameTargetTICTargetSalesTargetIncomeTargetBook ValueTargetEBITTargetEBITDAAdvent International Corp. (Herlitz AG) 70.4 405.9 -1.5 52.4 6.6 -2.6AfNat Resources Ltd. 5.9 0.5 -2.7 9.3 -2.7 -64.8Atlas Estates Ltd. 428.9 69.9 -72.8 167.1 -68.7 -64.8Ayrton Drug Manufacturing Ltd. 24.3 8.4 1.3 7.6 32.7 33.0Banca Italease SpA 185.8 8,238.2 872.2 1,176.4 5,303.0 5,407.5Bangkok Bank Public Co. Ltd. (ACL Bank Public Co.Ltd.)4,054.3 20.0 12.6 390.5 18.4 22.2Bank of Thailand (Siam City Bank Public Co. Ltd.) 2,844.6 654.4 139.3 1,258.3 833.5 861.1Bankier.pl SA 18.4 6.1 0.9 3.8 1.1 1.1BioXell SpA 40.9 0.2 18.1 43.7 18.2 18.6Cadbury PLC 21,923.7 8,738.7 662.6 -858.4 1,170.6 1,426.1Cagim Real Estate Corp. 42.3 4.0 -0.1 5.1 0.8 1.5Canext Energy Ltd. 55.8 11.5 -5.2 51.6 -6.1 2.4Care UK PLC 736.5 629.0 21.0 53.9 49.6 92.4Consolidated Mercantile, Inc. 9.5 0.3 -0.9 15.8 -0.9 -0.9Constantia Packaging AG 1,469.6 2,281.0 95.8 727.5 178.3 318.7DBS Bank Ltd. (Cholamandalam DBS Finance Ltd.) 1,353.8 258.7 -4.2 84.9 88.7 94.6Delta PLC 422.8 504.0 41.3 306.2 72.2 83.2Forge Group Ltd. 128.5 164.7 22.7 40.6 25.9 28.5Geneart AG 70.8 22.0 -0.5 26.2 -0.6 1.7Ginger SA 189.9 333.6 12.6 30.7 19.3 0.0Glisten PLC 76.8 114.3 -1.0 -19.7 1.5 4.5GVT Holding SA 4,820.2 1,564.2 74.3 1,077.7 187.2 352.1HandMade PLC 26.7 3.9 -9.3 -36.3 -9.9 -6.7Higashiyama Film Co. Ltd. 59.2 71.4 -3.4 26.1 -0.8 6.5Houtoku Co. Ltd. 26.8 50.0 1.7 28.0 2.1 2.8Inspired Gaming Group PLC 254.7 130.7 -4.0 -57.8 20.7 58.0Intelligent Wave, Inc. 68.5 52.5 1.5 41.4 3.9 4.9Intergold Ltd. 5.2 7.5 -1.1 -0.1 -1.0 -0.2International Absorbents, Inc. 36.2 32.7 1.8 20.9 3.5 5.1Iteration Energy Ltd. 548.5 184.4 -24.1 518.5 -61.7 67.8Kawamura Cycle Co. Ltd. 39.2 38.2 0.8 39.3 2.1 3.1Kelman Technologies, Inc. 7.7 21.2 -7.3 3.0 -6.2 -3.0Copyright © <strong>2010</strong>, FactSet Mergerstat, LLC. All rights reserved. 44
Mergerstat <strong>Control</strong> <strong>Premium</strong> <strong>Study</strong><strong>2nd</strong> <strong>Quarter</strong> <strong>2010</strong>($ in Millions)Target NameTargetTICTargetSalesTargetIncomeTargetBook ValueTargetEBITTargetEBITDAMadison Energy Corp. 6.7 2.0 0.2 3.1 0.4 1.2MAMA Group PLC 71.1 58.8 7.1 18.8 10.2 12.4Marktec Corp. 71.2 49.2 2.1 70.7 4.8 6.6Matrikon, Inc. 137.4 79.5 3.0 27.6 3.7 5.2Mitsui & Co. Ltd. / Aucnet, Inc. / J21 KK (JapanAutomobile Auction, Inc.)138.0 88.8 13.6 81.1 16.3 24.0Morgan Stanley (Compagnie La Lucette) 2,707.1 126.7 -428.3 406.6 -346.8 -313.3Morse PLC 104.2 314.2 10.6 18.8 10.6 13.7Mulvihill Capital Management, Inc. (First <strong>Premium</strong>Income Trust PLUS)23.8 0.5 1.2 19.9 1.2 1.2MW Trade SA 15.4 3.4 1.1 9.1 1.4 1.5PacMag Metals Ltd. 39.5 0.2 -1.4 10.9 -1.6 -1.6Pan Andean Resources PLC 27.6 2.9 1.1 18.5 1.5 1.7Porthus NV 40.5 31.5 1.5 8.3 2.5 4.6Redcliffe Exploration, Inc. 53.4 10.2 -6.6 47.0 -6.3 3.0Rensburg Sheppards PLC 560.5 168.2 26.9 37.9 42.5 51.1Result Energy, Inc. 43.9 5.8 -7.3 12.9 -7.0 -0.3Royal Laser Corp. 90.4 181.4 -4.3 -65.8 -3.9 -1.7RPG Cables Ltd. 58.3 86.6 -1.6 42.0 4.7 5.5Rusina Mining NL 19.1 0.1 -2.5 12.7 -2.5 -2.4Schneider Power, Inc. 13.1 2.8 -0.6 6.3 -0.4 -0.1SECOM Co., Ltd. (Tokyo Biso Kogyo Corp.) 150.7 364.8 2.2 171.5 5.2 7.6SkillSoft PLC 1,076.5 261.9 61.6 -5.9 84.2 96.1SMIT Internationale NV 1,383.8 911.1 110.7 599.0 161.4 251.1Sodifrance 29.2 90.4 2.1 -5.7 3.4 5.0SSH Corp. Ltd. 111.5 157.4 11.2 0.3 15.3 16.9State of São Paulo (Banco Nossa Caixa SA) 4,538.5 4,596.7 173.3 1,808.4 2,083.5 2,145.5Sumitomo Corp. (Interhides Public Co. Ltd.) 21.4 40.6 4.4 22.9 6.6 9.1Sun Wave Corp. 391.2 951.5 -37.0 355.9 -28.2 -3.5Tandberg ASA 3,216.6 906.2 146.9 150.3 217.5 271.6TPV Technology Ltd. 1,768.8 7,415.4 56.2 1,012.5 93.5 165.2Trulscom AB (Tilgin AB) 13.7 19.5 -5.8 7.0 -5.2 -3.3Unicharm Petcare Corp. 1,180.6 492.6 27.2 175.8 28.1 67.1www.factset.com 45
Mergerstat <strong>Control</strong> <strong>Premium</strong> <strong>Study</strong><strong>2nd</strong> <strong>Quarter</strong> <strong>2010</strong>Target Multiples (Domestic)Target NameTargetP/SalesTargetP/IncomeTargetP/Book ValueTargetTIC/EBIT (1)TargetTIC/EBITDA (1)3Com Corp. 2.4 88.5 * 9.1 44.5 * 17.6Airvana, Inc. 6.0 -36.1 * 4.2 -17.5 * -20.7 *Allied Capital Corp. 2.4 9.4 0.7 NMF * NMF *AMICAS, Inc. 3.6 -1,804.5 * 6.6 -186.8 * 74.1 *BJ Services Co. LLC 1.4 19.1 2.6 14.2 9.0Brink's Home Security Holdings, Inc. 3.5 31.3 3.7 19.3 10.2BWAY Holding Co. 0.5 11.3 -2.2 * 9.6 6.2Chordiant Software, Inc. 2.0 -17.0 * 5.2 -29.7 * -73.8 *COMSYS IT Partners, Inc. 0.6 27.9 -205.0 * 22.3 15.5Dialysis Corp. of America 1.1 15.4 4.9 12.5 9.3Diedrich Coffee, Inc. 3.0 90.2 * 13.9 * 54.3 * 30.4 *EXX, Inc. 0.1 21.0 0.6 6.0 2.3Facet Biotech Corp. 14.7 * -6.0 * 2.3 -6.3 * -7.3 *First Litchfield Financial Corp. 1.4 -22.9 * 1.1 NMF * NMF *Global Med Technologies, Inc. 1.4 30.2 -24.6 * 18.9 12.4Harleysville National Corp. 1.0 144.8 * 1.5 NMF * NMF *ICO, Inc. 0.8 117.1 * 2.4 56.8 * 22.3Iowa Telecommunications Services, Inc. 2.1 30.9 -1.4 * 18.4 9.4K-Tron International, Inc. 3.8 39.3 7.2 24.7 20.6Lodgian, Inc. 0.3 -3.2 * 0.5 -9.8 * 2.2Meridian Resource Corp. 0.3 6.2 0.6 -64.5 * 3.0O.A.K. Financial Corp. 1.7 159.6 * 1.2 NMF * NMF *OSI Pharmaceuticals, Inc. 8.3 40.8 * 5.3 22.5 21.2PECO II, Inc 0.4 -25.6 * 1.0 -25.2 * 20.8PLATO Learning, Inc. 2.1 80.5 * 12.2 * 68.9 * 10.6Protection One, Inc. 1.1 25.4 -3.0 * 13.1 7.4RiskMetrics Group, Inc. 4.5 43.0 * -6.8 * 24.3 21.6Silicon Storage Technology, Inc. 1.2 -28.4 * 1.2 -52.5 * 95.0 *Spectrum Brands, Inc. 0.4 -12.7 * -0.7 * 12.3 8.6Switch & Data Facilities Co., Inc. 3.4 -145.9 * 10.1 * 47.1 * 14.4Techwell, Inc. 6.4 116.2 * 4.0 75.7 * 65.9 *Terra Industries, Inc. 2.9 22.9 9.3 16.9 13.2(1) EBIT and EBITDA multiples are not meaningful for financial institutions.* Not used in range, average or median calculations.NA = Not availableNMF = Not meaningfulCopyright © <strong>2010</strong>, FactSet Mergerstat, LLC. All rights reserved. 47
Mergerstat <strong>Control</strong> <strong>Premium</strong> <strong>Study</strong><strong>2nd</strong> <strong>Quarter</strong> <strong>2010</strong>Target NameTargetP/SalesTargetP/IncomeTargetP/Book ValueTargetTIC/EBIT (1)TargetTIC/EBITDA (1)Varian, Inc. 1.7 24.9 4.0 16.7 12.7White Electronic Designs Corp. 2.8 60.8 * 1.8 44.1 * 25.7 *XTO Energy, Inc. 2.9 14.2 1.6 10.6 5.6Youbet.com, Inc. 1.1 51.4 * 7.1 32.1 11.9Zareba Systems, Inc. 0.7 16.8 2.8 12.2 8.9Zenith National Insurance Corp. 3.1 11.5 1.4 NMF * NMF *Range High 8.3 39.3 9.3 32.1 22.3Low 0.1 6.2 0.5 6.0 2.2Median: 1.7 21.0 2.5 16.8 10.6Average: 2.2 21.0 3.4 17.0 11.9(1) EBIT and EBITDA multiples are not meaningful for financial institutions.* Not used in range, average or median calculations.NA = Not availableNMF = Not meaningfulwww.factset.com 48
Mergerstat <strong>Control</strong> <strong>Premium</strong> <strong>Study</strong><strong>2nd</strong> <strong>Quarter</strong> <strong>2010</strong>Target Multiples (International)Target NameTargetP/SalesTargetP/IncomeTargetP/Book ValueTargetTIC/EBIT (1)TargetTIC/EBITDA (1)Advent International Corp. (Herlitz AG) 0.07 -18.9 * 0.5 10.7 NMF *AfNat Resources Ltd. 12.2 * -2.1 * 0.6 -2.2 * -2.2 *Atlas Estates Ltd. 0.9 -0.9 * 0.4 NMF * NMF *Ayrton Drug Manufacturing Ltd. 2.9 19.4 3.2 0.7 0.7Banca Italease SpA 0.02 0.2 0.2 NMF * NMF *Bangkok Bank Public Co. Ltd. (ACL Bank Public Co. 194.6 * 308.8 * 9.9 NMF * NMF *Ltd.)Bank of Thailand (Siam City Bank Public Co. Ltd.) 3.3 15.3 1.7 NMF * NMF *Bankier.pl SA 3.0 20.5 4.9 16.6 NMF *BioXell SpA 151.8 * 2.1 0.9 2.3 2.2Cadbury PLC 2.1 28.0 -21.6 * 18.7 15.4Cagim Real Estate Corp. 3.8 -150.6 * 3.0 NMF * NMF *Canext Energy Ltd. 4.2 -9.2 * 0.9 -9.1 * 23.3Care UK PLC 0.7 20.3 7.9 14.9 8.0Consolidated Mercantile, Inc. 29.5 * -10.1 * 0.6 NMF * NMF *Constantia Packaging AG 0.4 8.4 1.1 8.2 4.6DBS Bank Ltd. (Cholamandalam DBS Finance Ltd.) 0.5 -32.1 * 1.6 NMF * NMF *Delta PLC 0.8 10.2 1.4 5.9 5.1Forge Group Ltd. 0.8 5.7 3.2 5.0 4.5Geneart AG 3.2 -133.4 * 2.7 -126.9 * 40.5 *Ginger SA 0.4 11.8 4.8 9.8 NMF *Glisten PLC 0.3 -28.9 * -1.5 * 49.7 * 16.9GVT Holding SA 2.8 58.4 * 4.0 25.7 13.7HandMade PLC 0.9 -0.4 * -0.09 * -2.7 * -4.0 *Higashiyama Film Co. Ltd. 0.4 -7.9 * 1.0 -73.8 * 9.1Houtoku Co. Ltd. 0.3 8.7 0.5 12.5 9.4Inspired Gaming Group PLC 0.5 -16.5 * -1.1 * 12.3 4.4Intelligent Wave, Inc. 1.3 47.2 * 1.7 17.5 13.9Intergold Ltd. 0.6 -4.2 * -58.6 * -5.1 * -30.4 *International Absorbents, Inc. 0.9 17.3 1.5 10.5 7.1Iteration Energy Ltd. 2.0 -15.3 * 0.7 -8.9 * 8.1Kawamura Cycle Co. Ltd. 0.7 35.4 0.7 18.5 12.6(1) EBIT and EBITDA multiples are not meaningful for financial institutions.* Not used in range, average or median calculations.NA = Not availableNMF = Not meaningfulCopyright © <strong>2010</strong>, FactSet Mergerstat, LLC. All rights reserved. 49
Mergerstat <strong>Control</strong> <strong>Premium</strong> <strong>Study</strong><strong>2nd</strong> <strong>Quarter</strong> <strong>2010</strong>Target NameTargetP/SalesTargetP/IncomeTargetP/Book ValueTargetTIC/EBIT (1)TargetTIC/EBITDA (1)Kelman Technologies, Inc. 0.05 -0.1 * 0.3 -1.2 * -2.6 *Madison Energy Corp. 2.4 20.0 1.6 17.9 5.6MAMA Group PLC 1.1 9.4 3.6 7.0 5.8Marktec Corp. 1.4 33.0 1.0 14.8 10.8Matrikon, Inc. 1.7 45.2 * 5.0 37.2 * 26.5 *Mitsui & Co. Ltd. / Aucnet, Inc. / J21 KK (Japan1.5 9.9 1.7 8.5 5.8Automobile Auction, Inc.)Morgan Stanley (Compagnie La Lucette) 10.0 * -3.0 * 3.1 -7.8 * -8.6 *Morse PLC 0.3 9.8 5.5 9.9 7.6Mulvihill Capital Management, Inc. (First <strong>Premium</strong> 46.8 * 20.6 1.2 NMF * NMF *Income Trust PLUS)MW Trade SA 4.5 14.0 1.7 NMF * NMF *PacMag Metals Ltd. 186.9 * -28.8 * 3.6 -25.3 * -25.3 *Pan Andean Resources PLC 9.7 26.1 1.5 18.2 16.4Porthus NV 1.3 26.1 4.8 15.9 8.7Redcliffe Exploration, Inc. 4.7 -7.2 * 1.0 -8.4 * 18.1Rensburg Sheppards PLC 3.0 18.9 13.5 * NMF * NMF *Result Energy, Inc. 6.1 -4.9 * 2.8 -6.2 * -148.5 *Royal Laser Corp. 0.2 -10.1 * -0.7 * -23.0 * -52.0 *RPG Cables Ltd. 0.3 -16.9 * 0.6 12.5 10.6Rusina Mining NL 293.6 * -7.1 * 1.4 -7.6 * -8.1 *Schneider Power, Inc. 4.1 -18.7 * 1.8 -31.3 * -129.0 *SECOM Co., Ltd. (Tokyo Biso Kogyo Corp.) 0.4 69.7 * 0.9 29.0 19.8SkillSoft PLC 3.8 16.3 -170.4 * 12.8 11.2SMIT Internationale NV 1.5 12.4 2.3 8.6 5.5Sodifrance 0.2 8.0 -3.0 * 8.6 5.9SSH Corp. Ltd. 0.7 10.0 361.2 * 7.3 6.6State of São Paulo (Banco Nossa Caixa SA) 0.9 24.8 2.4 NMF * NMF *Sumitomo Corp. (Interhides Public Co. Ltd.) 0.09 0.8 0.2 3.2 2.3Sun Wave Corp. 0.3 -6.5 * 0.7 -13.9 * -111.4 *Tandberg ASA 3.5 21.9 21.4 * 14.8 11.8TPV Technology Ltd. 0.2 25.2 1.4 18.9 10.7Trulscom AB (Tilgin AB) 0.6 -2.2 * 1.8 -2.6 * -4.1 *(1) EBIT and EBITDA multiples are not meaningful for financial institutions.* Not used in range, average or median calculations.NA = Not availableNMF = Not meaningfulwww.factset.com 50
Mergerstat <strong>Control</strong> <strong>Premium</strong> <strong>Study</strong><strong>2nd</strong> <strong>Quarter</strong> <strong>2010</strong>Target NameTargetP/SalesTargetP/IncomeTargetP/Book ValueTargetTIC/EBIT (1)TargetTIC/EBITDA (1)Unicharm Petcare Corp. 2.4 43.3 * 6.7 42.0 * 17.6Unimat Life Corp. 0.6 18.0 1.2 10.6 6.5Vault Minerals, Inc. 259.2 * -21.9 * 6.7 -22.5 * -22.9 *Votorantim Novos Negócios Ltda. / PátriaInvestimentos (TIVIT Terceirizacao de ProcessosServicos e Technologia SA)1.6 23.6 12.1 * 17.3 9.4WAREHOUSE Co., Ltd. 0.4 8.4 0.4 9.5 2.8West Energy Ltd. 5,656.1 * - * 2,020.1 * 226,284.7 * 8,539.0 *64,641.6Range: High 9.7 35.4 9.9 29.0 23.3Low 0.02 0.2 0.2 0.7 0.7Median: 0.9 16.3 1.6 12.3 8.4Average: 1.7 16.0 2.3 12.4 9.4(1) EBIT and EBITDA multiples are not meaningful for financial institutions.* Not used in range, average or median calculations.NA = Not availableNMF = Not meaningfulwww.factset.com 51
Mergerstat <strong>Control</strong> <strong>Premium</strong> <strong>Study</strong><strong>2nd</strong> <strong>Quarter</strong> <strong>2010</strong>Target Demographics (Domestic)Target NameTargetTickerTargetExchangeTargetCountryAcquirerCountryConsiderationNature Currency3Com Corp. COMS Nasdaq United States United States C U.S. DollarAirvana, Inc. AIRV Nasdaq United States United States C U.S. DollarAllied Capital Corp. ALD NYSE United States United States S U.S. DollarAMICAS, Inc. AMCS Nasdaq United States United States C F U.S. DollarBJ Services Co. LLC BJS NYSE United States United States C,S U.S. DollarBrink's Home Security Holdings, Inc. CFL NYSE United States United States C,S U.S. DollarBWAY Holding Co. BWY NYSE United States United States C U.S. DollarChordiant Software, Inc. CHRD Nasdaq United States United States C F U.S. DollarCOMSYS IT Partners, Inc. CITP Nasdaq United States United States C,S F U.S. DollarDialysis Corp. of America DCAI Nasdaq United States United States C F U.S. DollarDiedrich Coffee, Inc. DDRX Nasdaq United States United States C F U.S. DollarEXX, Inc. EXEXA OTC United States United States C U.S. DollarFacet Biotech Corp. FACT Nasdaq United States United States C F U.S. DollarFirst Litchfield Financial Corp. FLFL Nasdaq United States United States C U.S. DollarGlobal Med Technologies, Inc. GLOB OTC United States United States C F U.S. DollarHarleysville National Corp. HNBC Nasdaq United States United States S U.S. DollarICO, Inc. ICOC Nasdaq United States United States C,S U.S. DollarIowa Telecommunications Services, Inc. IWA NYSE United States United States C,S U.S. DollarK-Tron International, Inc. KTII Nasdaq United States United States C U.S. DollarLodgian, Inc. LGN NYSE AMEX United States United States C,L U.S. DollarMeridian Resource Corp. TMR NYSE United States United States C,L U.S. DollarO.A.K. Financial Corp. OKFC OTC United States United States S U.S. DollarOSI Pharmaceuticals, Inc. OSIP Nasdaq United States Japan C N U.S. DollarPECO II, Inc PIII Nasdaq United States United States C U.S. DollarPLATO Learning, Inc. TUTR Nasdaq United States United States C U.S. DollarProtection One, Inc. PONE Nasdaq United States United States C,L F U.S. DollarRiskMetrics Group, Inc. RISK NYSE United States United States C,S U.S. DollarSilicon Storage Technology, Inc. SSTI Nasdaq United States United States C U.S. DollarSpectrum Brands, Inc. SPB NYSE United States United States S,L U.S. DollarSwitch & Data Facilities Co., Inc. SDXC Nasdaq United States United States C,S U.S. DollarTechwell, Inc. TWLL Nasdaq United States United States C F U.S. DollarTerra Industries, Inc. TRA NYSE United States United States C,S H U.S. DollarVarian, Inc. VARI Nasdaq United States United States C U.S. DollarWhite Electronic Designs Corp. WEDC Nasdaq United States United States C F U.S. DollarXTO Energy, Inc. XTO NYSE United States United States S,L U.S. DollarYoubet.com, Inc. UBET Nasdaq United States United States C,S U.S. DollarZareba Systems, Inc. ZRBA Nasdaq United States United States C U.S. DollarCopyright © <strong>2010</strong>, FactSet Mergerstat, LLC. All rights reserved. 52
Mergerstat <strong>Control</strong> <strong>Premium</strong> <strong>Study</strong><strong>2nd</strong> <strong>Quarter</strong> <strong>2010</strong>Target NameTargetTickerTargetExchangeTargetCountryAcquirerCountryConsiderationNature CurrencyZenith National Insurance Corp. ZNT NYSE United States Canada C U.S. Dollarwww.factset.com 53
Mergerstat <strong>Control</strong> <strong>Premium</strong> <strong>Study</strong><strong>2nd</strong> <strong>Quarter</strong> <strong>2010</strong>Target Demographics (International)Target NameTargetTickerTargetExchangeTargetCountryAcquirerCountryConsiderationNature CurrencyAdvent International Corp. (Herlitz AG) HEZ Frankfurt Germany Malaysia C,X EuroAfNat Resources Ltd. AFNR London StockExchangeAtlas Estates Ltd. ATLS London StockExchangeUnited Kingdom Canada S,X British PoundUnited Kingdom Israel C N British PoundAyrton Drug Manufacturing Ltd. AYRTN Accra Ghana South Africa C N Ghanaian CediBanca Italease SpA BIL Milan Italy Italy C N EuroBangkok Bank Public Co. Ltd. (ACL BankPublic Co. Ltd.)Bank of Thailand (Siam City Bank Public Co.Ltd.)ACL Bangkok Thailand China C F Thai BahtSCIB Bangkok Thailand Thailand C Thai BahtBankier.pl SA BPL Warsaw Poland South Africa C N Polish ZlotyBioXell SpA BXLN Swiss SIXExchangeCadbury PLC 0MDJ London StockExchangeItaly Italy C,S,X F EuroUnited Kingdom United States C,S H British PoundCagim Real Estate Corp. CIM Canadian Venture Canada Canada C Canadian DollarCanext Energy Ltd. CXZ Canadian Venture Canada Canada S,X Canadian DollarCare UK PLC 0MND London StockExchangeUnited Kingdom United Kingdom C British PoundConsolidated Mercantile, Inc. CSLMF OTC Canada Canada S Canadian DollarConstantia Packaging AG COV Vienna StockExchangeAustria United States C EuroDBS Bank Ltd. (Cholamandalam DBS FinanceLtd.)511243 Bombay India India C Indian RupeeDelta PLC 0MQM London StockExchangeForge Group Ltd. FGE AustralianSecuritiesExchangeUnited Kingdom United States C British PoundAustralia South Africa C H Australian DollarGeneart AG G6A Frankfurt Germany United States C EuroGinger SA GNG Euronext Paris France Netherlands C EuroGlisten PLC GLI London StockExchangeUnited Kingdom Finland C British PoundGVT Holding SA GVTT3 Sao Paolo Brazil France C F Brazilian RealHandMade PLC HMF London StockExchangeUnited Kingdom United Kingdom C British PoundHigashiyama Film Co. Ltd. 4244 JASDAQ Japan Hong Kong C F Japanese YenHoutoku Co. Ltd. 7973 Nagoya Japan Japan C F Japanese YenInspired Gaming Group PLC INGG London StockExchangeUnited Kingdom United Kingdom C British PoundCopyright © <strong>2010</strong>, FactSet Mergerstat, LLC. All rights reserved. 54
Mergerstat <strong>Control</strong> <strong>Premium</strong> <strong>Study</strong><strong>2nd</strong> <strong>Quarter</strong> <strong>2010</strong>Target NameTargetTickerTargetExchangeTargetCountryAcquirerCountryConsiderationNature CurrencyIntelligent Wave, Inc. 4847 JASDAQ Japan Japan C F Japanese YenIntergold Ltd. IGO.A Canadian Venture Canada United States C Canadian DollarInternational Absorbents, Inc. IAX NYSE AMEX Canada United States C Canadian DollarIteration Energy Ltd. ITXFF OTC Canada Canada C,S Canadian DollarKawamura Cycle Co. Ltd. 7311 Tokyo Japan Japan C F Japanese YenKelman Technologies, Inc. KTI Canadian Venture Canada Canada C Canadian DollarMadison Energy Corp. MDC Canadian Venture Canada Canada C Canadian DollarMAMA Group PLC MAMA London StockExchangeUnited Kingdom United Kingdom C F British PoundMarktec Corp. 4954 JASDAQ Japan Japan C F Japanese YenMatrikon, Inc. MTK Toronto Canada United States C Canadian DollarMitsui & Co. Ltd. / Aucnet, Inc. / J21 KK (JapanAutomobile Auction, Inc.)2394 Tokyo Japan Japan C F Japanese YenMorgan Stanley (Compagnie La Lucette) MILU Euronext Paris France France C,X,S EuroMorse PLC MOR London StockExchangeUnited Kingdom United Kingdom C British PoundMulvihill Capital Management, Inc. (First<strong>Premium</strong> Income Trust PLUS)FPI.UT Toronto Canada Canada S Canadian DollarMW Trade SA MWT Warsaw Poland Poland C Polish ZlotyPacMag Metals Ltd. PMH AustralianSecuritiesExchangePan Andean Resources PLC PRE London StockExchangeAustralia Canada C,S Australian DollarUnited Kingdom Canada C,S British PoundPorthus NV ALPTH Euronext Brussels Belgium Canada C F EuroRedcliffe Exploration, Inc. RXP.A Canadian Venture Canada Canada C Canadian DollarRensburg Sheppards PLC RBG London StockExchangeUnited Kingdom United Kingdom S British PoundResult Energy, Inc. RTE Canadian Venture Canada Canada C,S Canadian DollarRoyal Laser Corp. RLC Toronto Canada Canada C Canadian DollarRPG Cables Ltd. 517056 Bombay India India S Indian RupeeRusina Mining NL RML AustralianSecuritiesExchangeAustralia United Kingdom S Australian DollarSchneider Power, Inc. SNE Canadian Venture Canada United States S Canadian DollarSECOM Co., Ltd. (Tokyo Biso Kogyo Corp.) 9615 Tokyo Japan Japan C F Japanese YenSkillSoft PLC SKIL OTC Ireland United States C EuroSMIT Internationale NV SMIT EuronextAmsterdamNetherlands Netherlands C F EuroSodifrance SOA Euronext Paris France France C N Eurowww.factset.com 55
Mergerstat <strong>Control</strong> <strong>Premium</strong> <strong>Study</strong><strong>2nd</strong> <strong>Quarter</strong> <strong>2010</strong>Target NameTargetTickerTargetExchangeTargetCountryAcquirerCountryConsiderationNature CurrencySSH Corp. Ltd. S11 Singapore Singapore Singapore C,S Singapore DollarState of São Paulo (Banco Nossa Caixa SA) BNCA3 Sao Paolo Brazil Brazil C Brazilian RealSumitomo Corp. (Interhides Public Co. Ltd.) IHL Bangkok Thailand Thailand C Thai BahtSun Wave Corp. 7993 Tokyo Japan Japan S Japanese YenTandberg ASA TAA Oslo Norway United States C F Norwegian KroneTPV Technology Ltd. 903 Hong Kong Hong Kong Hong Kong C N Hong Kong DollarTrulscom AB (Tilgin AB) TILG Stockholm Sweden United Kingdom C Swedish KronaUnicharm Petcare Corp. 2059 Tokyo Japan Japan C F Japanese YenUnimat Life Corp. 7560 Tokyo Japan Japan C F Japanese YenVault Minerals, Inc. VMI Canadian Venture Canada Canada S Canadian DollarVotorantim Novos Negócios Ltda. / PátriaInvestimentos (TIVIT Terceirizacao deProcessos Servicos e Technologia SA)TVIT3 Sao Paolo Brazil United Kingdom C Brazilian RealWAREHOUSE Co., Ltd. 4724 Tokyo Japan Japan C F Japanese YenWest Energy Ltd. WTL Toronto Canada Canada C,S,L Canadian Dollarwww.factset.com 56
Mergerstat <strong>Control</strong> <strong>Premium</strong> <strong>Study</strong><strong>2nd</strong> <strong>Quarter</strong> <strong>2010</strong>Company Descriptions (Domestic)Target Name Target Business Description Acquirer Business Description3Com Corp.Airvana, Inc.Allied Capital Corp.AMICAS, Inc.BJ Services Co. LLCBrink's Home Security Holdings,Inc.Provides voice and data networking productsand servicesProvides internet and mobile wirelesstechnology servicesEngages in providing long-term debt andequity capital for small and mid sizedcompaniesProduces and develops imaging informationtechnology solutionsProvides pressure pumping and oilfieldservicesHome security servicesDevelops imaging and printing systems,computing systems and informationtechnology solutionsAcquisition vehicle led by SAC PrivateCapital Group, LLC, GSO Capital PartnersLP, Sankaty Advisors LLC and ZelnickMediaClosed-End Investment Fund/Investment TrustDevelops medical imaging, informationmanagement softwareProvides oil field servicesManufactures electronic security systems andprovides various security servicesBWAY Holding Co. Manufactures metal and plastic containers Alternative investment managerChordiant Software, Inc. Provides e-business infrastructure software Develops customer relationship managementsoftwareCOMSYS IT Partners, Inc.Provides information technology staffing andmanagement servicesProvides employment services, includingtemporary and contract staffingDialysis Corp. of AmericaDevelops and operates outpatient kidney Owns and operates dialysis centersdialysis centersDiedrich Coffee, Inc.Sells coffee beverages made with its own Produces and sells coffeeroasted coffeeEXX, Inc.Designs, produces, and sells toys and electric Private group led by David A. SegalmotorsFacet Biotech Corp.Develops antibody therapeutics for thetreatment of oncology and immunologicdiseasesManufactures and sells healthcare productsFirst Litchfield Financial Corp. Operates as a bank holding company Provides commercial banking servicesGlobal Med Technologies, Inc. Provides information management softwareproducts and services to the healthcareDesigns, manufactures, markets and servicesblood processing systemsindustryHarleysville National Corp. National commercial bank Provides banking servicesICO, Inc.Provides high technology polymer equipmentand coating services to the energy and steelindustriesProduces plastic compounds and resinsIowa Telecommunications Services,Inc.K-Tron International, Inc.Provides wired and wirelesstelecommunications servicesManufactures industrial conveyers and feedingsystemsProvides voice, broadband and entertainmentservicesOwns a casket manufacturer.Lodgian, Inc. Owns and operates hotels Alternative investment managerMeridian Resource Corp.Acquires, explores and develops mineral Explores oil and natural gaspropertiesCopyright © <strong>2010</strong>, FactSet Mergerstat, LLC. All rights reserved. 57
Mergerstat <strong>Control</strong> <strong>Premium</strong> <strong>Study</strong><strong>2nd</strong> <strong>Quarter</strong> <strong>2010</strong>Target Name Target Business Description Acquirer Business DescriptionO.A.K. Financial Corp. Bank holding company for Byron bank State commercial bankOSI Pharmaceuticals, Inc.Manufactures and develops pharmaceuticaldrugsManufactures and markets pharmaceuticalsand related medical productsPECO II, IncDesigns, manufactures, and marketsAlternative investment managercommunications power systems and powerdistribution equipmentPLATO Learning, Inc.Develops and markets computer-based, Alternative investment managerinteractive, self-paced instructional softwareand e-learning solutions for education andrelated servicesProtection One, Inc. Provides security alarm monitoring systems Alternative investment managerRiskMetrics Group, Inc. Provides financial risk management services Provides investment decision supportapplications to investment institutionsworldwide, including indices and risk andreturn portfolio analyticsSilicon Storage Technology, Inc. Designs, manufactures and marketsnonvolatile memory solutionsDesigns and manufactures microcontrollers forhigh volume embedded control applicationsSpectrum Brands, Inc.Switch & Data Facilities Co., Inc.Makes and sells personal care products,general batteries and other consumer productsProvides data center and internet exchangeservicesProvides asset management services andengages in various investment activitiesProvides global data center servicesTechwell, Inc. Designs, sells and markets integrated circuits Designs and manufactures analogsemiconductorsTerra Industries, Inc.Varian, Inc.White Electronic Designs Corp.XTO Energy, Inc.Youbet.com, Inc.Zareba Systems, Inc.Zenith National Insurance Corp.Manufactures and distributes chemicalfertilizersDevelops, manufactures, and sells scientificinstruments and vacuum technologiesManufactures and supplies electronicscomponents for defense and aerospacemarketsExplores and produces oil and natural gaspropertiesProvides technology and parimutuel horseracing content for consumer through Internetand telephone platformsManufactures electronic fence controllers,electronic medical instruments andconnectivity productsProvides workers compensation, property andcasualty insurance servicesManufactures and distributes nitrogenousfertilizersDesigns, manufactures and marketsmeasurement and monitoring instrumentsDesigns, manufactures and markets analog,mixed-signal, discrete integrated circuits andsemiconductorsExplores for and produces crude oil andnatural gasOperates racetrack facilitiesAlternative investment managerProvides insurance and reinsurance serviceswww.factset.com 58
Mergerstat <strong>Control</strong> <strong>Premium</strong> <strong>Study</strong><strong>2nd</strong> <strong>Quarter</strong> <strong>2010</strong>Company Descriptions (International)Target Name Target Business Description Acquirer Business DescriptionAdvent International Corp. (HerlitzAG)Manufactures school and office stationeryproductsManufactures and distributes writinginstruments, art, painting and hobby products,office stationeries and printer consumablesAfNat Resources Ltd.Explores for uranium and other miscellaneous Mines for goldmineralsAtlas Estates Ltd. Closed-ended investment company Provides real estate development servicesAyrton Drug Manufacturing Ltd. Produces drugs Manufactures, markets & sells branded andgeneric prescription and over-the-counterpharmaceuticalBanca Italease SpA Provides banking services Offers commercial, private, and investmentbanking servicesBangkok Bank Public Co. Ltd. International commercial bankOperates as an international commercial bank(ACL Bank Public Co. Ltd.)Bank of Thailand (Siam City Bank International commercial bankEngages in investment holdingPublic Co. Ltd.)Bankier.pl SA Operates an online financial portal Operates as a holding company with interestsin the media sectorBioXell SpA Manufactures drugs for inflammatory diseases Manufactures drugsCadbury PLCManufactures and wholesales branded Manufactures and wholesales food productsconfectionery and beveragesCagim Real Estate Corp. Real estate investment trust Real Estate Investment TrustCanext Energy Ltd. Explores for oil and natural gas. Explores and develops mineral propertiesCare UK PLC Provides health and social services Alternative investment managerConsolidated Mercantile, Inc.Constantia Packaging AGDBS Bank Ltd. (CholamandalamDBS Finance Ltd.)Delta PLCForge Group Ltd.Geneart AGGinger SAInvests in merchant banking and to its corestrategic industriesManufactures flexible packaging andcorrugated cardboardProvides retail financing, mutual funds, stockbroking, investment advisory, vehicle financeand risk management servicesManufactures and supplies electrolyticmanganese dioxide to dry cell battery andprovides galvanizing services to steelfabricators and engineersEngages in the engineering and constructionprojectsProvides integrated system solutions for DNAengineering focusing on gene synthesis,evolution and plasmid servicesProvides heavy construction and engineeringservicesProvides real estate servicesProvides investment banking servicesManufactures automobile accessories, sugar,chemicals, and provides securities brokerageand investment advisory servicesManufactures fabricated metal products andmechanized irrigation machineryOperates as an investment holding companywith interest in construction and engineeringservicesProvides biotechnology research services anddevelops system-based solutionsProvides engineering and consultancy servicesCopyright © <strong>2010</strong>, FactSet Mergerstat, LLC. All rights reserved. 59
Mergerstat <strong>Control</strong> <strong>Premium</strong> <strong>Study</strong><strong>2nd</strong> <strong>Quarter</strong> <strong>2010</strong>Target Name Target Business Description Acquirer Business DescriptionGlisten PLCGVT Holding SAHandMade PLCManufactures chocolate and sugar coatedproducts and related confectioneryProvides internet, cellular and wirelesstelecommunication servicesProduces feature films, the exploitation offilm libraries and other intellectual property,and the sale of distribution rights for featurefilmsProduces plant-based products and ensuresfood safetyProvides music, television channels, books,films, and software gamesPrivate acquisition vehicle owned by DavidFrancisHigashiyama Film Co. Ltd. Engaged in the film-processing business Provides investment management andadvisory servicesHoutoku Co. Ltd. Manufactures and sells office furniture Wholesales furniture; manages real estatepropertiesInspired Gaming Group PLC Provides gaming and entertainment terminals Alternative investment managerIntelligent Wave, Inc. Provides software services Provides publishing and commercial printingservicesIntergold Ltd. Designs and manufactures jewelry Operating as a holding companyInternational Absorbents, Inc. Develops sorbent products Alternative investment managerIteration Energy Ltd. Explores for and produces oil and natural gas Explores for and produces oil and natural gasKawamura Cycle Co. Ltd. Manufactures and wholesales wheelchairs Retails office equipments, industrialequipments, and household equipmentsKelman Technologies, Inc.Provides seismic and geophysical dataarchiving servicesProvides seismic and geophysical dataarchiving servicesMadison Energy Corp. Explores and mines for oil and gas Explores and mines for oil and gasMAMA Group PLCMarktec Corp.Matrikon, Inc.Mitsui & Co. Ltd. / Aucnet, Inc. /J21 KK (Japan AutomobileAuction, Inc.)Morgan Stanley (Compagnie LaLucette)Morse PLCMulvihill Capital Management, Inc.(First <strong>Premium</strong> Income TrustPLUS)Operates live music venues, engages in musicpublishing, invests in recording businessesand distributes music magazinesDevelops, manufactures and sells nondestructive testing equipments and markingmachineryProvides information technology services andsoftware solutionsEngages in car auctions and network auctionsSpecializes in antimony and gold miningactivitiesProvides technology integration andinformation technology servicesClosed-End Investment Fund/InvestmentTrustOperates music, video and book retail storesAlternative investment managerManufactures aerospace products, controltechnologies, automotive products, powergeneration systems, specialty chemicals,fibers, plastics, and electronic and advancedmaterialsAcquisition vehicleOperates a real estate investment trustAlternative investment managerClosed-End Investment Fund/InvestmentTrustwww.factset.com 60
Mergerstat <strong>Control</strong> <strong>Premium</strong> <strong>Study</strong><strong>2nd</strong> <strong>Quarter</strong> <strong>2010</strong>Target Name Target Business Description Acquirer Business DescriptionMW Trade SA Provides financial services Operates as a holding a company withinterests in investment advice and brokerageservicesPacMag Metals Ltd.Explores for gold, magnesium and mineral Explores and mines for goldsandsPan Andean Resources PLC Explores and produces oil and gas Explores for oil and gasPorthus NVProvides software applications to managesupply chainDesigns and develops software-as-a-servicelogistics solutionsRedcliffe Exploration, Inc. Explores and drills for oil Explores for and produces oil and gasRensburg Sheppards PLC Provides investment management services Provides financial products and serviceResult Energy, Inc.Royal Laser Corp.RPG Cables Ltd.Explores for, produces and develops oil andgas propertiesManufactures custom wood and metalproductsManufactures power and control cables, jellyfilled telephone cables, optical fiber cablesand house wiring cablesExplores for oil and natural gasProcesses ferrous and non-ferrous metalsOperates in power transmission, distribution,substations, telecom and railwayelectrification sectorsRusina Mining NL Explores nickel, gold, copper and zinc Explore and produces nickel depositsSchneider Power, Inc.SECOM Co., Ltd. (Tokyo BisoKogyo Corp.)SkillSoft PLCSMIT Internationale NVSodifranceSSH Corp. Ltd.State of São Paulo (Banco NossaCaixa SA)Sumitomo Corp. (Interhides PublicCo. Ltd.)Sun Wave Corp.Producer and developer of renewable energyprojects and provider of related servicesProvides property management services;engages in the maintenance and repair ofbuildingsProvides integrated enterprise e-learningsolutions, online information resources, andflexible learning technologies servicesProvides maritime services, including harbortowage, salvaging, terminal, transport andheavy liftingProvides computer systems engineering,integration and software development servicesEngages in industrial materials, generalhardware and welding equipment distributionOperates as a international bankManufactures and distributes leather coveringfor car seatsManufactures and wholesales kitchen andbathroom equipmentsDesigns, manufactures, and suppliesintegrated fuel systems and alternative fuelequipmentsAcquisition vehiclePrivate group led by Berkshire Partners LLC,Advent International Corp, and Bain CapitalPartners LLCSpecializes in the construction andmaintenance of ports and waterways, landreclamation, coastal defense and riverbankprotection; maritime infrastructure; maritimeand terminal servicesOperates as a holding company with interestsin IT servicesConstructs oil rigs and distributes oilfieldequipmentProvides banking servicesPrivate group let by Mr. OngartThumrongsakulvongProduces house construction materialsincluding window sashes, tiles, sanitaryequipments and related partswww.factset.com 61
Mergerstat <strong>Control</strong> <strong>Premium</strong> <strong>Study</strong><strong>2nd</strong> <strong>Quarter</strong> <strong>2010</strong>Target Name Target Business Description Acquirer Business DescriptionTandberg ASATPV Technology Ltd.Trulscom AB (Tilgin AB)Unicharm Petcare Corp.Unimat Life Corp.Produces video conferencing systems andinformation technology network solutionsManufactures and distributes cathode ray tubeand liquid crystal display monitorsProvides the technology and equipmentneeded to produce high quality voice andadvanced video streamingProduces and markets pet foods and pettoiletry goodsWholesale and supplies coffee for businessesofficesDesigns, develops and manufacturesnetworking solutions including routers, LANand ATM switches, dial-up access servers,and network management softwarePrivate group led by Mitsui & Co Ltd andChina Electronics CorpAlternative investment managerManufactures sanitary napkins and paperdiapersProvides private investment and real estatemanagement servicesVault Minerals, Inc. Mines for natural resources including gold Explores and develops gold depositsVotorantim Novos Negócios Ltda. /Pátria Investimentos (TIVITTerceirizacao de ProcessosServicos e Technologia SA)WAREHOUSE Co., Ltd.Provides information technology and businessoutsourcing servicesOperates video and CD rental shops, gamearcade centers, Internet cafe, and bowlingcentersAlternative Investment ManagerProvides CD, DVD and computer softwarerental services and sells secondhand goodsWest Energy Ltd. Explores for oil and natural gas. Unit Investment Trustwww.factset.com 62
Mergerstat <strong>Control</strong> <strong>Premium</strong> <strong>Study</strong><strong>2nd</strong> <strong>Quarter</strong> <strong>2010</strong>Standard Industrial Classification (SIC) Summary01-09 Agriculture and Forestry10-14 Mining10 Metal mining12 Coal mining13 Oil and gas extraction14 Mining and quarrying of nonmetallic minerals, except fuels15-17 Construction15 Building construction16 Heavy construction17 Construction – special trade contractors20-39 Manufacturing20 Food and kindred products21 Tobacco products22 Textile mill products23 Apparel24-26 Lumber, furniture and paper27 Printing, publishing and allied industries28 Chemicals and allied products29 Petroleum refining30 Rubber and miscellaneous plastics products31 Leather and leather products32-33 Stone, concrete products and primary metals34-35 Fabricated metal products, industrial machinery and computers36 Electrical and electronic machinery and equipment37 Transportation equipment38 <strong>Control</strong>ling instruments; photographic, medical and optical goods; and clocks39 Miscellaneous manufacturing40-47 Transportation40 Railroad transportation41 Local and suburban transit42 Motor freight transportation43 U.S. Postal Service44 Water transportation45 Air transportation46 Pipelines47 Transportation services48 Communications49 Electric, Gas, and Sanitary Services50-51 Wholesale Trade50 Durable goods51 Nondurable goodsCopyright © <strong>2010</strong>, FactSet Mergerstat, LLC. All rights reserved. 63
Mergerstat <strong>Control</strong> <strong>Premium</strong> <strong>Study</strong><strong>2nd</strong> <strong>Quarter</strong> <strong>2010</strong>52-59 Retail Trade52 Building materials and mobile home dealers53 General merchandise stores54 Food stores55 Automotive dealers and gasoline service stations56 Apparel stores57 Furniture and equipment stores58 Eating and drinking places59 Miscellaneous retail60-67 Finance, Insurance, and Real Estate60-61 Banking and credit agencies62 Security and commodity brokers and related services63-64 Insurance companies and agents65 Real estate67 Holding companies and other investment offices70-99 Services and Other70 Hotels and lodging places72 Personal services73-78 Business services79 Amusement and recreation services80-82 Health services83-84 Social services, museums and zoos86 Membership organizations87 Engineering, accounting, research and management88-89 Private households and miscellaneous services99 Nonclassifiable establishmentsCopyright © <strong>2010</strong>, FactSet Mergerstat, LLC. All rights reserved. 64
Mergerstat <strong>Control</strong> <strong>Premium</strong> <strong>Study</strong><strong>2nd</strong> <strong>Quarter</strong> <strong>2010</strong>Description of TermsConsideration Codes<strong>Control</strong> <strong>Premium</strong>C = CashD = DebtL = LiabilitiesS = StockX = Other (warrants, contingent payments, etc.)Mergerstat’s control premium is computed by comparing the per share totalconsideration price for one share of the target company’s common stock to theMergerstat unaffected price. This pre-announcement price is selected byMergerstat and based on volume and price fluctuations during the period priorto the acquisition announcement.Guidelines for control premium calculation:• Determination of announcement data• Price and volume retrieval prior to announcement date• Analysis of data for significant fluctuations in price and volume• Selection of a price just prior to this point of change in representativenormal pricing activity• If no significant price and volume fluctuations occur, selection of the priceone day prior to the announcement date• Determination of the final price that the acquirer offers, per share, topurchase the target company's common stock, per terms of a tender offer• Computation of the control premium using the following equation:Purchase Price - Mergerstat Unaffected PriceMergerstat Unaffected PriceMergerstat Unaffected PricePercentage Common Held AfterMinority Discount FormulaPercentage Common Previously Held<strong>Premium</strong> 1 Day<strong>Premium</strong> 1 Week<strong>Premium</strong> 1 Month<strong>Premium</strong> 2 MonthsTarget company’s common stock price per share unaffected by the acquisitionannouncement. Selected by Mergerstat after analyzing each transaction (seeTransaction Information).Percent of the target company’s common shares held by the acquiring companyfollowing the transaction.1-(1/(1+<strong>Control</strong> <strong>Premium</strong>))Percent of the target company’s common shares owned by the acquiringcompany prior to the transaction.<strong>Premium</strong> computed by comparing the price ultimately paid to the common stockprice one day prior to the announcement date.<strong>Premium</strong> computed by comparing the price ultimately paid to the common stockprice one week prior to the announcement date.<strong>Premium</strong> computed by comparing the price ultimately paid to the common stockprice one month prior to the announcement date.<strong>Premium</strong> computed by comparing the price ultimately paid to the common stockprice two months prior to the announcement date.Copyright © <strong>2010</strong>, FactSet Mergerstat, LLC. All rights reserved. 65
Mergerstat <strong>Control</strong> <strong>Premium</strong> <strong>Study</strong><strong>2nd</strong> <strong>Quarter</strong> <strong>2010</strong>Price 1 DayPrice 1 WeekPrice 1 MonthPrice 2 MonthsPurchase Price Per ShareTarget Book ValueTarget EBITTarget EBITDATarget IncomeTarget Market Value of EquityTarget Price/Book Value RatioTarget Price/Earnings RatioTarget Price/Sales RatioTarget company’s common stock price per share one day prior to the acquisitionannouncement date.Target company’s common stock price per share one week prior to theacquisition announcement date.Target company’s common stock price per share one month prior to theacquisition announcement date.Target company’s common stock price per share two months prior to theacquisition announcement date.The total consideration paid per share for the target company’s shares.Target company’s book value, sometimes referred to as shareholder’s equity ornet tangible assets, is based on the latest reported period prior to thetransaction’s closing date. Book value is reported in millions and rounded.Target company’s earnings before interest and taxes (“EBIT”) based on thelatest reported 12-month period prior to the transaction’s announcement date.EBIT is reported in millions of dollars and rounded.Target company’s earnings before interest, taxes, depreciation and amortization(“EBITDA”) based on the latest reported 12-month period prior to thetransaction’s announcement date. EBITDA is reported in millions of dollars androunded.Target company’s net income (loss), excluding extraordinary items, based onthe latest reported 12-month period prior to the transaction’s announcementdate. Income is reported in millions of dollars and rounded.Target market value of equity based on the purchase price per share times totalshares outstanding reported in the period prior to the transaction’sannouncement date. Market value of equity is reported in millions of dollars androunded.Purchase price-to-book value ratio for the target company based on the impliedmarket value of equity divided by book value of the target company.Purchase price-to-earnings ratio for the target company based on the impliedmarket value of equity divided by the latest reported 12-month net income priorto the announcement date.Purchase price-to-sales ratio for the target company based on the implied marketvalue equity divided by the latest reported 12-month sales prior to theannouncement date.Copyright © <strong>2010</strong>, FactSet Mergerstat, LLC. All rights reserved. 66
Mergerstat <strong>Control</strong> <strong>Premium</strong> <strong>Study</strong><strong>2nd</strong> <strong>Quarter</strong> <strong>2010</strong>Target SalesTarget TICTarget TIC/EBIT RatioTarget TIC/EBITDA RatioTotal Deal ValueTarget company’s sales based on the latest reported 12-month period prior tothe transaction’s announcement date. Sales are reported in millions of dollarsand rounded.Target company’s implied total invested capital (“TIC”) based on the sum ofimplied market value of equity plus the face value of total interest bearing debtand the book value of preferred stock outstanding prior to the announcementdate.Target TIC-to-EBIT ratio based on the target TIC divided by the latest reported12-month earnings before interest and taxes prior to the announcement date.Target TIC-to-EBITDA ratio based on the target TIC divided by the latestreported 12-month earnings before interest, taxes, depreciation and amortizationprior to the announcement date.The aggregate purchase price given to shareholders of the target company’scommon stock by the acquiring company. Shown in millions of dollars androunded.Copyright © <strong>2010</strong>, FactSet Mergerstat, LLC. All rights reserved. 67