Pratt's Stats Private Deal Update (PDF) - BVMarketData
Pratt's Stats Private Deal Update (PDF) - BVMarketData
Pratt's Stats Private Deal Update (PDF) - BVMarketData
- No tags were found...

Create successful ePaper yourself
Turn your PDF publications into a flip-book with our unique Google optimized e-Paper software.
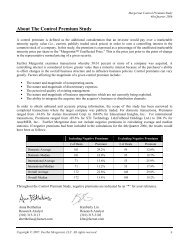
PRATT’S STATSPRIVATE DEAL UPDATE1Q 2012A QUARTERLY PUBLICATION ANALYZING PRIVATE COMPANY ACQUISITIONSBY PRIVATE BUYERS FROM THE PRATT’S STATS DATABASE.INTRODUCTIONThe quarterly Pratt’s <strong>Stats</strong> <strong>Private</strong> <strong>Deal</strong> <strong>Update</strong> (PDU)provides general trend information on valuation multiplesand profit margins for transactions in the Pratt’s <strong>Stats</strong>database, available exclusively through BusinessValuation Resources, LLC (BVR) at www.<strong>BVMarketData</strong>.com 1 . The PDU also includes an excerpt from theEconomic Outlook <strong>Update</strong> 2 , published by BVR.The charts and graphs in PDU present median value. Themajority of valuation practitioners accept the median (themiddle observation) as best measure of central tendencyfor valuation multiples and profit margins because outlierscan distort the mean (the arithmetic average). Pratt’s <strong>Stats</strong>users can conduct comparative analysis in the databaseto determine which transactions to use.Financial advisors, merger and acquisition professionals,business appraisers, business brokers, investmentbankers and many others use the Pratt’s <strong>Stats</strong> databaseto determine the value of a subject company by applyingthe market approach with comparable company data.Pratt’s <strong>Stats</strong> is the premier source for private businesspurchase details and includes both private and publicbuyers. Pratt’s <strong>Stats</strong> includes up to 88 data points thathighlight the financial and transactional details of thebusiness sales. As of the publication date, the Pratt’s <strong>Stats</strong>database contained 12,022 transactions in which thebuyer was a private party. The database included a totalof 18,114 transactions in which a privately held companywas sold to either a private or public buyer. Exhibit 1shows deal count in Pratt’s <strong>Stats</strong> for private buyersonly.Exhibit 1. Pratt’s <strong>Stats</strong> Summary Information (private buyers only)2003 2004 2005 2006 2007 2008 2009 2010 2011Count 701 940 1,028 1,036 1,150 1,438 931 1,006 797Median Revenue $449,596 $448,119 $449,159 $490,603 $502,293 $442,578 $464,790 $400,738 $404,982Average Revenue $1,302,753 $1,147,812 $1,290,382 $1,427,547 $2,562,131 $1,212,626 $1,501,020 $1,085,229 $947,755Median Selling Price $200,000 $200,000 $205,000 $225,000 $239,873 $190,000 $189,000 $160,000 $160,000Average Selling Price $589,046 $684,434 $641,943 $885,194 $1,016,813 $684,292 $678,186 $568,721 $483,6351. Brokers who contribute transaction details on closed business sales receive 3 months of free access to the database for each deal included inPratt’s <strong>Stats</strong>. For more information, visit www.<strong>BVMarketData</strong>.com, run your cursor over “Pratt’s <strong>Stats</strong>” on the left-hand side of the screen, andthen click on “Broker Contribute.” You can also contact Doug Twitchell, BV Market Data Publisher at dougt@bvresources.com or Adam Manson,Manager of Financial Analysis, at adamm@bvresources.com.2. The Economic Outlook <strong>Update</strong> (EOU) is published monthly and quarterly by BVR and provides details on the state of the US economy and anoutlook for future quarters. The EOU covers general economic conditions, energy prices, stocks and bonds and more. Visit <strong>BVMarketData</strong>.comto learn more.© 2012 Business Valuation Resources, LLC, 503-291-7963. All Rights Reserved. 1
PRATT’S STATS PRIVATE DEAL UPDATE — 1Q 20121Q 2012 CONTENTSINTRODUCTION. . . . . . . . . . . . . . . . . . . . . . . . . 1Exhibit 1. Pratt’s <strong>Stats</strong> Summary Information (private buyers only) .1PRATT’S STATS MEDIAN VALUES—ALL INDUSTRIES. . . . 3Exhibit 2: Pratt’s <strong>Stats</strong> Median Valuation Multiples—AllIndustries, Organized by Net Sales Range and Year . . . . . . . . .3Exhibit 3: Pratt’s <strong>Stats</strong> Median Profit Margins—All Industries,Organized by Net Sales Range and Year . . . . . . . . . . . . . . .3Exhibit 4: Pratt’s <strong>Stats</strong> Median MVIC/Sales by Industry for allNet Sales Ranges . . . . . . . . . . . . . . . . . . . . . . . . . . .4Exhibit 5: Pratt’s <strong>Stats</strong> Median MVIC/EBIT by Industry for allNet Sales Ranges . . . . . . . . . . . . . . . . . . . . . . . . . . .5Exhibit 6: Pratt’s <strong>Stats</strong> Median MVIC/EBITDA by Industry forall Net Sales Ranges. . . . . . . . . . . . . . . . . . . . . . . . . .6Exhibit 7: Pratt’s <strong>Stats</strong> Median Gross Profit Margins byIndustry for all Net Sales Ranges . . . . . . . . . . . . . . . . . . .7Exhibit 8: Pratt’s <strong>Stats</strong> Median Operating Profit Margins byIndustry for all Net Sales Ranges . . . . . . . . . . . . . . . . . . .8Exhibit 9: Pratt’s <strong>Stats</strong> Median Net Profit Margins by Industryfor all Net Sales Ranges. . . . . . . . . . . . . . . . . . . . . . . .9Exhibit 10: Pratt’s <strong>Stats</strong> Median Valuation MultiplesConstruction: SIC 1521—1799, All Years—Public vs. <strong>Private</strong> Buyers 10Exhibit 11: Pratt’s <strong>Stats</strong> Median Valuation MultiplesManufacturing: SIC 2011—3999, All Years—Public vs. <strong>Private</strong>Buyers . . . . . . . . . . . . . . . . . . . . . . . . . . . . . . . . 11Exhibit 12: Pratt’s <strong>Stats</strong> Median Valuation MultiplesTransportation, Communications, Electric, Gas & Sanitary: SIC4011—4971, All Years—Public vs. <strong>Private</strong> Buyers. . . . . . . . . . 11Exhibit 13: Pratt’s <strong>Stats</strong> Median Valuation Multiples WholesaleTrade: SIC 5012—5199, All Years—Public vs. <strong>Private</strong> Buyers . . . 12Exhibit 14: Pratt’s <strong>Stats</strong> Median Valuation Multiples RetailTrade: SIC 5211—5999, All Years—Public vs. <strong>Private</strong> Buyers . . . 12Exhibit 15: Pratt’s <strong>Stats</strong> Median Valuation Multiples Services:SIC 7011—9999, All Years—Public vs. <strong>Private</strong> Buyers . . . . . . . 13Exhibit 16: Pratt’s <strong>Stats</strong> Median Valuation Multiples AllIndustries: SIC 1521—9999, All Years—Public vs. <strong>Private</strong> Buyers . 13ECONOMIC OUTLOOK . . . . . . . . . . . . . . . . . . . . .14EXHIBIT 17: Key Economic Variables Actual 2005-2011 andForecast 2012-2021 . . . . . . . . . . . . . . . . . . . . . . . . . 15MVIC: Total consideration paid to the seller and includesany cash, notes and/or securities that were used as a formof payment plus any interest-bearing liabilities assumedby the buyer. The MVIC price includes the non-competevalue and the assumption of interest-bearing liabilities andexcludes (1) the real estate value and (2) any earn-outs (becausethey have not yet been earned, and they may notbe earned) and (3) the employment/consulting agreementvalues.Gross Profit: Net Sales—Cost of Goods SoldOperating Profit: Gross Profit—Total Operating ExpensesNet Income: EBT—Tax ExpenseEBITDA: Operating Profit + Noncash Charges (Depreciationand/or Amortization)EBIT: Operating ProfitEconomic Outlook <strong>Update</strong>Quarterly & Monthly - 16 issues a year!Rely on the Economic Outlook <strong>Update</strong> for thedata you need to complete your valuation report.The EOU is a review of the state of the U.S.economy and forecast.Each report provides: An overview of selected economic factors thatprevailed in the respective period A discussion of the factors that are crucial over an extendedperiod of time Forecasts for the futureDownload a Sample Report at:www.BVResources.com/EOUPratt’s <strong>Stats</strong> CalculationsGross Profit Margin: Gross Profit/SalesOperating Profit Margin: Operating Profit/SalesNet Profit Margin: Net Income/SalesAdam MansonManaging EditorJasmine PearsallCustomer ServiceDavid FosterCEOLucretia LyonsPresidentDoug TwitchellPublisherThe Pratt’s <strong>Stats</strong> <strong>Private</strong> <strong>Deal</strong> <strong>Update</strong> (ISSN 1937-9021) is published quarterly and exclusively for subscribers ofthe Pratt’s <strong>Stats</strong> database by Business Valuation Resources, LLC, 1000 SW Broadway, Suite 1200, Portland OR97205-3035. Contact sales@bvresources.com for more information or visit our website at www.<strong>BVMarketData</strong>.com.Although the information in this publication has been obtained from sources that BVR believes to be reliable,we do not guarantee its accuracy, and such information may be condensed or incomplete. This publicationis intended for information purposes only, and it is not intended as financial, investment, legal, or consultingadvice.No portion of this document can be republished without the express written consent of Business ValuationResources, LLC.www.<strong>BVMarketData</strong>.com 2
PRATT’S STATS PRIVATE DEAL UPDATE — 1Q 2012PRATT’S STATS MEDIAN VALUES– ALL INDUSTRIESExhibit 2 presents median valuation multiples based onrevenue ranges for all industries.Companies with sales under $1M tended to have thelowest MVIC/EBIT and MVIC/EBITDA multiples. In recentyears, companies with sales over $5M tended to have thelargest MVIC/EBIT and MVIC/EBITDA multiples. In recentyears, companies with sales between $1M and $5 tendedto have the lowest MVIC/Revenue multiples.Exhibit 3 presents median profit margins based onrevenue ranges for all industries.There appears to be a negative correlation between firmrevenues and profit margins. As firm revenues increase,the various profit margins tend to decrease. Firms withrevenues of $5M or greater tended to have the lowestprofit margins. Most of the smaller firms are pass-throughentities (S Corporations, LLCs, etc.) while many of thelarger firms are C Corporations—this may explain thelower profit margins of the larger firms.Exhibit 2: Pratt’s <strong>Stats</strong> Median Valuation Multiples—All Industries, Organized by Net Sales Range and Year2003 2004 2005 2006 2007 2008 2009 2010 2011MVIC/Net Sales$0-$1M 0.48 0.50 0.48 0.50 0.49 0.48 0.45 0.47 0.47$1M-$5M 0.40 0.43 0.42 0.41 0.44 0.40 0.42 0.42 0.34>$5M 0.38 0.50 0.41 0.60 0.53 0.44 0.48 0.44 0.60MVIC/EBIT$0-$1M 3.52 3.45 3.27 3.53 3.11 2.53 2.32 2.29 2.32$1M-$5M 7.13 5.57 5.17 5.42 5.24 4.61 4.20 3.73 4.16>$5M 6.25 10.52 5.38 5.81 7.19 5.88 5.07 5.03 6.29MVIC/EBITDA$0-$1M 3.80 3.80 4.05 4.16 3.73 2.60 2.32 2.26 2.31$1M-$5M 7.16 5.50 5.72 5.53 5.40 4.44 4.19 3.72 3.64>$5M 6.24 6.74 4.48 4.96 6.74 4.69 4.69 3.86 6.21Note: Each data point in this chart was based on a minimum of 10 transactions by private buyers of private companies. Pratt’s <strong>Stats</strong> alsoincludes acquisitions by public buyers, but that data is not included here.Exhibit 3: Pratt’s <strong>Stats</strong> Median Profit Margins—All Industries, Organized by Net Sales Range and Year2003 2004 2005 2006 2007 2008 2009 2010 2011Gross Profit Margin$0-$1M 68% 70% 69% 67% 69% 70% 69% 71% 70%$1M-$5M 39% 42% 40% 42% 49% 46% 53% 53% 40%>$5M 25% 33% 28% 32% 31% 34% 39% 35% 29%Operating Profit Margin$0-$1M 11% 11% 12% 11% 12% 16% 17% 18% 16%$1M-$5M 4% 5% 5% 5% 7% 8% 7% 9% 5%>$5M 3% 5% 4% 10% 7% 6% 9% 9% 7%Net Profit Margin$0-$1M 10% 9% 11% 10% 11% 15% 17% 18% 15%$1M-$5M 4% 4% 5% 4% 7% 7% 6% 9% 4%>$5M 3% 4% 4% 9% 5% 5% 7% 5% 5%Note: Each data point in this chart was based on a minimum of 10 transactions by private buyers of private companies. Pratt’s <strong>Stats</strong> alsoincludes acquisitions by public buyers, but that data is not included here.© 2012 Business Valuation Resources, LLC, 503-291-7963. All Rights Reserved. 3
PRATT’S STATS PRIVATE DEAL UPDATE — 1Q 2012Exhibits 4 through 6 present median valuation multiplesbased on major industry groups, as identified by SICcode.Not all of the major industries were included in the chartsand graphs, as there was not enough transactional datafor those industries to make the results meaningful.Exhibit 4: Pratt’s <strong>Stats</strong> Median MVIC/Sales by Industry for all Net Sales RangesSIC Industry 2003 2004 2005 2006 2007 2008 2009 2010 20111521-1799 Construction 0.32 0.34 0.43 0.38 0.42 0.39 0.40 0.34 0.322011-3999 Manufacturing 0.58 0.66 0.61 0.58 0.65 0.53 0.57 0.56 0.494011-4971Transportation, Communications,Electric, Gas & Sanitary 0.44 0.51 0.55 0.68 0.62 0.69 0.43 0.58 0.645012-5199 Wholesale Trade 0.35 0.41 0.42 0.40 0.42 0.46 0.46 0.48 0.395211-5999 Retail Trade 0.34 0.38 0.40 0.42 0.39 0.36 0.32 0.34 0.327011-9999 Services 0.61 0.59 0.57 0.57 0.58 0.56 0.53 0.57 0.541521-9999 All Industries 0.45 0.47 0.47 0.49 0.48 0.46 0.44 0.46 0.45Note: Each data point in this chart was based on a minimum of 10 transactions by private buyers of private companies. Pratt’s <strong>Stats</strong> alsoincludes acquisitions by public buyers, but that data is not included here.Exhibit 4A: Pratt’s <strong>Stats</strong> Median MVIC/Sales by Industry for all Net Sales RangesMedian Valuation Multiple0.80.70.60.50.4ConstructionManufacturingTransportation,Communications, Electric,Gas & SanitaryWholesale TradeRetail TradeServicesAll Industries0.32003 2004 2005 2006 2007 2008 2009 2010 2011www.<strong>BVMarketData</strong>.com 4
PRATT’S STATS PRIVATE DEAL UPDATE — 1Q 2012Exhibit 5: Pratt’s <strong>Stats</strong> Median MVIC/EBIT by Industry for all Net Sales RangesSIC Industry 2003 2004 2005 2006 2007 2008 2009 2010 20111521-1799 Construction 2.18 5.51 4.05 3.52 3.74 4.04 4.69 2.78 3.312011-3999 Manufacturing 6.28 5.06 5.40 4.69 5.81 5.01 4.30 3.78 4.694011-4971Transportation, Communications,Electric, Gas & Sanitary 3.59 3.51 6.31 6.05 2.81 3.47 2.54 3.39 2.335012-5199 Wholesale Trade 4.32 3.87 2.85 3.93 4.06 4.07 7.86 3.79 3.735211-5999 Retail Trade 3.71 3.46 3.34 3.96 3.14 2.29 2.23 2.08 2.227011-9999 Services 4.42 3.80 3.75 3.75 3.72 3.32 2.97 2.42 3.001521-9999 All Industries 4.17 3.86 3.74 3.99 3.74 3.11 2.72 2.54 2.55Note: Each data point in this chart was based on a minimum of 10 transactions by private buyers of private companies. Pratt’s <strong>Stats</strong> alsoincludes acquisitions by public buyers, but that data is not included here.Exhibit 5A: Pratt’s <strong>Stats</strong> Median MVIC/EBIT by Industry for all Net Sales RangesMedian Valuation Multiple7.56.55.54.53.52.5ConstructionManufacturingTransportation,Communications, Electric,Gas & SanitaryWholesale TradeRetail TradeServicesAll Industries1.52003 2004 2005 2006 2007 2008 2009 2010 2011© 2012 Business Valuation Resources, LLC, 503-291-7963. All Rights Reserved. 5
PRATT’S STATS PRIVATE DEAL UPDATE — 1Q 2012Exhibit 6: Pratt’s <strong>Stats</strong> Median MVIC/EBITDA by Industry for all Net Sales RangesSIC Industry 2003 2004 2005 2006 2007 2008 2009 2010 20111521-1799 Construction 2.71 4.89 4.69 4.38 3.67 3.85 3.93 2.46 3.212011-3999 Manufacturing 6.03 5.06 4.98 5.18 5.44 4.66 4.83 3.70 3.584011-4971Transportation, Communications,Electric, Gas & Sanitary 2.95 4.11 5.54 4.25 3.54 3.31 2.52 3.19 2.415012-5199 Wholesale Trade 4.32 4.98 3.36 6.59 3.83 3.94 7.94 3.86 3.495211-5999 Retail Trade 4.01 3.75 4.27 4.95 4.23 2.28 2.15 1.93 2.177011-9999 Services 5.08 4.22 4.42 4.14 4.53 3.38 2.99 2.48 2.991521-9999 All Industries 4.46 4.27 4.49 4.63 4.46 3.11 2.67 2.48 2.52Note: Each data point in this chart was based on a minimum of 10 transactions by private buyers of private companies. Pratt’s <strong>Stats</strong> alsoincludes acquisitions by public buyers, but that data is not included here.Exhibit 6A: Pratt’s <strong>Stats</strong> Median MVIC/EBITDA by Industry for all Net Sales RangesMedian Valuation Multiple7.56.55.54.53.52.5ConstructionManufacturingTransportation,Communications, Electric,Gas & SanitaryWholesale TradeRetail TradeServicesAll Industries1.52003 2004 2005 2006 2007 2008 2009 2010 2011www.<strong>BVMarketData</strong>.com 6
PRATT’S STATS PRIVATE DEAL UPDATE — 1Q 2012Tables 7 through 9 present median profit margins basedon major industry groups, as identified by SIC code.Not all of the major industries were included in the charts,as there was not enough transactional data for thoseindustries to make the results meaningful.Exhibit 7: Pratt’s <strong>Stats</strong> Median Gross Profit Margins by Industry for all Net Sales RangesSIC Industry 2003 2004 2005 2006 2007 2008 2009 2010 20111521-1799 Construction 54% 46% 48% 44% 51% 41% 43% 46% 42%2011-3999 Manufacturing 49% 47% 52% 53% 52% 57% 56% 58% 52%4011-4971Transportation, Communications,Electric, Gas & Sanitary 82% 67% 77% 98% 89% 82% 81% 72% 89%5012-5199 Wholesale Trade 34% 42% 41% 41% 38% 39% 38% 46% 46%5211-5999 Retail Trade 58% 56% 58% 57% 62% 63% 59% 63% 64%7011-9999 Services 95% 97% 89% 83% 89% 89% 90% 91% 90%1521-9999 All Industries 63% 64% 63% 61% 65% 66% 66% 68% 68%Note: Each data point in this chart was based on a minimum of 10 transactions by private buyers of private companies. Pratt’s <strong>Stats</strong> alsoincludes acquisitions by public buyers, but that data is not included here.Exhibit 7A: Pratt’s <strong>Stats</strong> Median Gross Profit Margins by Industry for all Net Sales Ranges100%ConstructionMedian Gross Profit Margin90%80%70%60%50%ManufacturingTransportation,Communications, Electric,Gas & SanitaryWholesale TradeRetail TradeServices40%30%2003 2004 2005 2006 2007 2008 2009 2010 2011All Industries© 2012 Business Valuation Resources, LLC, 503-291-7963. All Rights Reserved. 7
PRATT’S STATS PRIVATE DEAL UPDATE — 1Q 2012Exhibit 8: Pratt’s <strong>Stats</strong> Median Operating Profit Margins by Industry for all Net Sales RangesSIC Industry 2003 2004 2005 2006 2007 2008 2009 2010 20111521-1799 Construction 11% 5% 10% 9% 12% 12% 9% 8% 9%2011-3999 Manufacturing 8% 10% 9% 11% 11% 9% 13% 16% 10%4011-4971Transportation, Communications,Electric, Gas & Sanitary 8% 15% 9% 10% 20% 15% 14% 11% 16%5012-5199 Wholesale Trade 5% 7% 11% 6% 7% 8% 5% 10% 13%5211-5999 Retail Trade 8% 9% 8% 6% 9% 14% 13% 14% 11%7011-9999 Services 9% 9% 11% 12% 11% 15% 16% 18% 15%1521-9999 All Industries 8% 9% 10% 9% 10% 13% 14% 16% 13%Note: Each data point in this chart was based on a minimum of 10 transactions by private buyers of private companies. Pratt’s <strong>Stats</strong> alsoincludes acquisitions by public buyers, but that data is not included here.Exhibit 8A: Pratt’s <strong>Stats</strong> Median Operating Profit Margins by Industry for all Net Sales Ranges22%ConstructionMedian Operating Profit Margin20%18%16%14%12%10%8%6%4%2003 2004 2005 2006 2007 2008 2009 2010 2011ManufacturingTransportation,Communications, Electric,Gas & SanitaryWholesale TradeRetail TradeServicesAll Industrieswww.<strong>BVMarketData</strong>.com 8
PRATT’S STATS PRIVATE DEAL UPDATE — 1Q 2012Exhibit 9: Pratt’s <strong>Stats</strong> Median Net Profit Margins by Industry for all Net Sales RangesSIC Industry 2003 2004 2005 2006 2007 2008 2009 2010 20111521-1799 Construction 11% 5% 9% 9% 11% 11% 9% 7% 9%2011-3999 Manufacturing 7% 9% 8% 10% 8% 9% 13% 14% 9%4011-4971Transportation, Communications,Electric, Gas & Sanitary 7% 14% 8% 8% 20% 15% 13% 11% 14%5012-5199 Wholesale Trade 5% 6% 11% 6% 7% 8% 4% 10% 12%5211-5999 Retail Trade 7% 8% 8% 6% 8% 14% 12% 13% 11%7011-9999 Services 8% 7% 10% 11% 11% 14% 15% 18% 15%1521-9999 All Industries 7% 8% 9% 8% 10% 13% 13% 14% 13%Note: Each data point in this chart was based on a minimum of 10 transactions by private buyers of private companies. Pratt’s <strong>Stats</strong> alsoincludes acquisitions by public buyers, but that data is not included here.Exhibit 9A: Pratt’s <strong>Stats</strong> Median Net Profit Margins by Industry for all Net Sales RangesMedian Net Profit Margin22%20%18%16%14%12%10%8%6%4%ConstructionManufacturingTransportation,Communications, Electric,Gas & SanitaryWholesale TradeRetail TradeServicesAll Industries2%2003 2004 2005 2006 2007 2008 2009 2010 2011© 2012 Business Valuation Resources, LLC, 503-291-7963. All Rights Reserved. 9
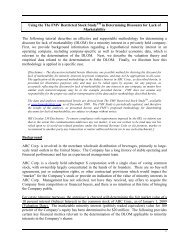
PRATT’S STATS PRIVATE DEAL UPDATE — 1Q 2012Tables 10 through 16 compare the median valuationmultiples private buyers paid (those transactions brokeredby business intermediaries) to what public companybuyers paid based on major industry groups, as identifiedby SIC code.In general, public buyers paid higher multiples for privatetargets than private buyers paid. This may partially reflectsynergies between the public buyer and the privatetarget. Also, the typical acquisition public buyers madewas larger than those made by private buyers, so thepossibility exists that larger companies may sell for highermultiples than smaller companies.Exhibit 10: Pratt’s <strong>Stats</strong> Median Valuation Multiples Construction: SIC 1521—1799, All Years—Public vs. <strong>Private</strong>BuyersMVIC/Revenue MVIC/EBIT MVIC/EBITDATransactionCountMedian NetSalesMedian MVIC<strong>Private</strong> Buyers 0.37 4.08 3.88 507 $964,364 $375,000Public Buyers 0.55 6.65 5.95 125 $27,487,170 $17,814,180Exhibit 10A: Pratt’s <strong>Stats</strong> Median Valuation Multiples Construction: SIC 1521—1799, All Years—Public vs. <strong>Private</strong>Buyers www.<strong>BVMarketData</strong>.com 10
PRATT’S STATS PRIVATE DEAL UPDATE — 1Q 2012Exhibit 11: Pratt’s <strong>Stats</strong> Median Valuation Multiples Manufacturing: SIC 2011—3999, All Years—Public vs. <strong>Private</strong>BuyersMVIC/Revenue MVIC/EBIT MVIC/EBITDATransactionCountMedian NetSales Median MVIC<strong>Private</strong> Buyers 0.59 5.14 4.92 1,352 $820,209 $436,750Public Buyers 1.13 11.14 8.73 1,862 $18,011,050 $22,935,460Exhibit 11A: Pratt’s <strong>Stats</strong> Median Valuation Multiples Manufacturing: SIC 2011—3999, All Years—Public vs. <strong>Private</strong>Buyers Exhibit 12: Pratt’s <strong>Stats</strong> Median Valuation Multiples Transportation, Communications, Electric, Gas & Sanitary: SIC4011—4971, All Years—Public vs. <strong>Private</strong> BuyersMVIC/Revenue MVIC/EBIT MVIC/EBITDATransactionCountMedian NetSales Median MVIC<strong>Private</strong> Buyers 0.58 3.51 3.40 391 $531,492 $300,000Public Buyers 1.30 13.17 9.38 519 $12,399,000 $14,707,000Exhibit 12A: Pratt’s <strong>Stats</strong> Median Valuation Multiples Transportation, Communications, Electric, Gas & Sanitary: SIC4011—4971, All Years—Public vs. <strong>Private</strong> Buyers © 2012 Business Valuation Resources, LLC, 503-291-7963. All Rights Reserved. 11
PRATT’S STATS PRIVATE DEAL UPDATE — 1Q 2012Exhibit 13: Pratt’s <strong>Stats</strong> Median Valuation Multiples Wholesale Trade: SIC 5012—5199, All Years—Public vs. <strong>Private</strong>BuyersMVIC/Revenue MVIC/EBIT MVIC/EBITDATransactionCountMedian NetSales Median MVIC<strong>Private</strong> Buyers 0.42 4.35 4.55 712 $853,236 $350,000Public Buyers 0.59 10.50 8.22 311 $26,116,000 $12,868,600Exhibit 13A: Pratt’s <strong>Stats</strong> Median Valuation Multiples Wholesale Trade: SIC 5012—5199, All Years—Public vs. <strong>Private</strong>Buyers Exhibit 14: Pratt’s <strong>Stats</strong> Median Valuation Multiples Retail Trade: SIC 5211—5999, All Years—Public vs. <strong>Private</strong>BuyersMVIC/Revenue MVIC/EBIT MVIC/EBITDATransactionCountMedian NetSales Median MVIC<strong>Private</strong> Buyers 0.37 3.06 3.15 4,313 $418,982 $150,000Public Buyers 0.50 10.68 8.65 320 $32,433,200 $15,616,120Exhibit 14A: Pratt’s <strong>Stats</strong> Median Valuation Multiples Retail Trade: SIC 5211—5999, All Years—Public vs. <strong>Private</strong>Buyers www.<strong>BVMarketData</strong>.com 12
PRATT’S STATS PRIVATE DEAL UPDATE — 1Q 2012Exhibit 15: Pratt’s <strong>Stats</strong> Median Valuation Multiples Services: SIC 7011—9999, All Years—Public vs. <strong>Private</strong> BuyersMVIC/Revenue MVIC/EBIT MVIC/EBITDATransactionCountMedian NetSales Median MVIC<strong>Private</strong> Buyers 0.57 3.67 3.94 3,974 $365,665 $194,292Public Buyers 1.59 13.74 11.20 2,423 $6,288,184 $12,100,000Exhibit 15A: Pratt’s <strong>Stats</strong> Median Valuation Multiples Services: SIC 7011—9999, All Years—Public vs. <strong>Private</strong> Buyers Exhibit 16: Pratt’s <strong>Stats</strong> Median Valuation Multiples All Industries: SIC 1521—9999, All Years—Public vs. <strong>Private</strong>BuyersMVIC/Revenue MVIC/EBIT MVIC/EBITDATransactionCountMedian NetSales Median MVIC<strong>Private</strong> Buyers 0.47 3.59 3.71 12,022 $455,950 $199,000Public Buyers 1.25 11.62 9.26 6,092 $11,569,210 $16,439,010Exhibit 16A: Pratt’s <strong>Stats</strong> Median Valuation Multiples All Industries: SIC 1521—9999, All Years—Public vs. <strong>Private</strong>Buyers © 2012 Business Valuation Resources, LLC, 503-291-7963. All Rights Reserved. 13
PRATT’S STATS PRIVATE DEAL UPDATE — 1Q 2012ECONOMIC OUTLOOK 3The U.S. economy experienced its quickest growthrate this quarter since the second quarter of 2010.Unfortunately, most economists do not believe thisgrowth rate is sustainable. To further dampen the news,the Economic Policy Institute (EPI) points out that, if youremove changes in private inventories (a particularlyvolatile part of the economy), final demand (GDP minusthe impact of inventory changes) grew at only a 0.8% ratethis quarter. Domestic demand (final demand that addsimports but subtracts exports—a measure of how muchU.S.-based households, businesses, and governmentsare demanding) grew at only 0.9%. The EPI concludes“this [economic] health is poor.”Consumer spending grew this quarter, but was partiallyfinanced from consumers’ savings as disposablepersonal income only grew modestly. This marks the fifthconsecutive quarter of decline for the personal savingsrate. Decreasing food and energy prices eased thegrowth of the Consumer Price Index and Producer PriceIndex and the Federal Open Market Committee believesthat inflation will settle, over coming quarters, at levels ator below those consistent with their goal inflation rate.After dropping sharply in October, the ConsumerConfidence Index showed steady growth in Novemberand December. Regardless, the index remains low andmany are unsure whether this is a rebound from earlierdeclines or a sustainable shift in improving consumeroptimism.The major stock market indexes experienced notablegrowth this quarter as market volatility—indicated byVIX—remained elevated.The Institute for Supply Management’s manufacturingsector index and services sector index increased slightlythis quarter. While the two indexes remain at a levelsignifying growth, they are barely within the healthy rangeand indicate that growth is sluggish.<strong>Private</strong>ly-owned housing starts and building permitsauthorized were up this quarter from one year ago. Homesales continued to increase and are up from a year agoas record low mortgage interest rates, job growth and3 This excerpt is from the Economic Outlook <strong>Update</strong>, a monthlyand quarterly economic publication published by Business ValuationResources, which provides details on the state of the US economy andprovides an outlook for future quarters. The Economic Outlook <strong>Update</strong>covers everything from general economic conditions and energy prices tostock and bond markets. To purchase a current or historic issue of theEconomic Outlook <strong>Update</strong>, or to view a sample issue, visit <strong>BVMarketData</strong>.com.bargain home prices are leading more consumers intothe housing market. To the dismay of many homeowners,housing prices have yet to see any improvement.The 35 participants in The Livingston Survey (the “Survey”)released their latest predictions in December. Theparticipants, who are surveyed by the Federal ReserveBank of Philadelphia twice a year, project real GDP togrow at an annual rate of 2.1% between 4Q 2011 and 2Q2012 (down from their previous estimate of 3.0%). Theythen expect GDP will increase at an annual rate of 2.5%between 2Q 2012 and 4Q 2012. They believe GDP willgrow 2.6% annually over the next 10 years.The Survey also noted that forecasts for the unemploymentrate have been revised upward from the previous Survey.They expect the unemployment rate to be about 8.9% byJune 2012, up from their previous estimate of 8.3%. Theyexpect unemployment to decrease to 8.7% by December2012.The forecasters in the Survey have maintained their neartermpredictions for consumer price inflation (CPI). Theyexpect CPI inflation to be 2.2% in 2012, unchangedfrom the previous survey. They predict CPI inflation willbe 2.3% in 2013. The Survey expects CPI inflation toaverage 2.5% over the next 10 years, slightly higher thanthe forecast of 2.4% estimated in the prior Survey. TheSurvey expects producer price inflation (PPI) to be 2.3%in 2012—down from the previous estimate of 2.5%—before increasing 2.6% in 2013.The Survey predicts the interest rate on three-monthTreasury bills to be 0.05% at the end of June 2012—revised down from their previous estimate of 0.89%. TheLivingston forecasters predict that the rate will then riseto 0.09% in December 2012 before rising to 0.38% inDecember 2013. The interest rate on 10-year Treasurybonds are predicted to reach 2.40% at the end ofJune 2012, down from the previous estimate of 4.18%.According to the Survey, the rate will then rise to 2.75%in December 2012 and to 3.16% in December of 2013.The forecasters from the Survey have decreased theirprevious projections for future S&P 500 values. Theyexpect the S&P 500 will be at 1,322.5 at the end of June2012, before climbing to 1,395.0 by the end of December2012. They believe the S&P 500 will end 2013 at 1,480.0.The Energy Information Administration (EIA) predicts thatthe West Texas Intermediate (WTI) crude oil spot pricewill average approximately $94.81 per barrel in 2011 andwww.<strong>BVMarketData</strong>.com 14
PRATT’S STATS PRIVATE DEAL UPDATE — 1Q 2012$98.00 per barrel in 2012, up from $79.40 in 2010. TheEIA expects regular grade retail gas prices to average$3.53 per gallon in 2011 and $3.45 per gallon in 2012, upfrom $2.78 in 2010.The EIA believes the Henry Hub natural gas spot price willaverage $4.02 per million Btu (MMBtu) in 2011 and $3.70per MMBtu in 2012, compared with $4.39 per MMBtu in2010.Residential electric prices, which averaged 11.58 centsper kilowatt-hour (kWh) in 2010, are expected to average11.78 cents per kWh in 2011 and 11.85 cents per kWh in2012.The National Association of Realtors (NAR) believesexisting home sales will climb to 4.44 million in 2012before growing to 4.62 million in 2013. The MortgageBankers Association (MBA) believes existing home saleswill be 4.40 million in 2012 and 4.70 million in 2013. NARbelieves new home sales will be 351,000 in 2012 and506,000 in 2013. MBA believes new home sales will be311,000 in 2012 and 389,000 in 2013.NAR believes the median existing-home price (middleprice of all homes sold) will increase to $167,300 in2012 before increasing to $172,600 in 2013. MBA moreoptimistically believes the median price of existinghomes will be $172,500 in 2012 and $178,400 in 2013.NAR believes the median new home price will grow to$227,000 in 2012 before growing to $235,800 in 2013.MBA more conservatively believes the median newhome price will grow to $222,200 in 2012 and $227,800in 2013.EXHIBIT 17: Key Economic Variables Actual 2005-2011 and Forecast 2012-20216.04.02.0Percent per year0.0-2.0-4.0-6.0-8.0Real GDP*Industrial Production*Personal Consumption*Consumer Prices*-10.0-12.02005 2006 2007 2008 2009 2010 2011 2012 2013 2014 2015 2016 2017-2021Source of historical data: U.S. Department of Commerce, U.S. Department of Labor and The Federal Reserve Board.Source of forecasts: Consensus Forecasts.© 2012 Business Valuation Resources, LLC, 503-291-7963. All Rights Reserved. 15