FactSet Mergerstat® / BVR Control Premium Study ... - BVMarketData
FactSet Mergerstat® / BVR Control Premium Study ... - BVMarketData
FactSet Mergerstat® / BVR Control Premium Study ... - BVMarketData

You also want an ePaper? Increase the reach of your titles
YUMPU automatically turns print PDFs into web optimized ePapers that Google loves.
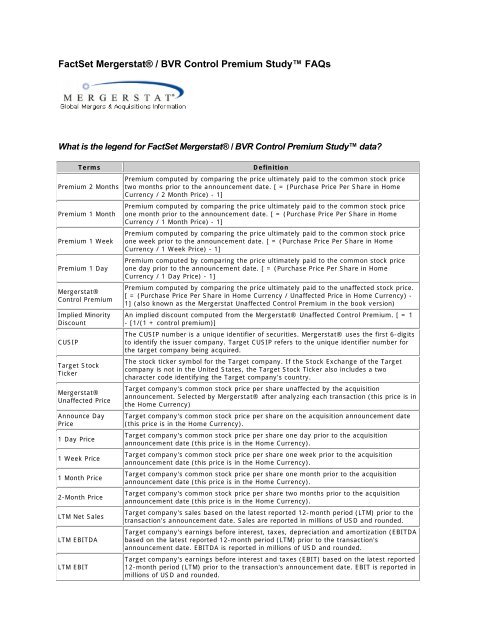
<strong>FactSet</strong> Mergerstat® / <strong>BVR</strong> <strong>Control</strong> <strong>Premium</strong> <strong>Study</strong> FAQsWhat is the legend for <strong>FactSet</strong> Mergerstat® / <strong>BVR</strong> <strong>Control</strong> <strong>Premium</strong> <strong>Study</strong> data?Terms<strong>Premium</strong> 2 Months<strong>Premium</strong> 1 Month<strong>Premium</strong> 1 Week<strong>Premium</strong> 1 DayMergerstat®<strong>Control</strong> <strong>Premium</strong>Implied MinorityDiscountCUSIPTarget StockTickerMergerstat®Unaffected PriceAnnounce DayPrice1 Day Price1 Week Price1 Month Price2-Month PriceLTM Net SalesLTM EBITDALTM EBITDefinition<strong>Premium</strong> computed by comparing the price ultimately paid to the common stock pricetwo months prior to the announcement date. [ = (Purchase Price Per Share in HomeCurrency / 2 Month Price) - 1]<strong>Premium</strong> computed by comparing the price ultimately paid to the common stock priceone month prior to the announcement date. [ = (Purchase Price Per Share in HomeCurrency / 1 Month Price) - 1]<strong>Premium</strong> computed by comparing the price ultimately paid to the common stock priceone week prior to the announcement date. [ = (Purchase Price Per Share in HomeCurrency / 1 Week Price) - 1]<strong>Premium</strong> computed by comparing the price ultimately paid to the common stock priceone day prior to the announcement date. [ = (Purchase Price Per Share in HomeCurrency / 1 Day Price) - 1]<strong>Premium</strong> computed by comparing the price ultimately paid to the unaffected stock price.[ = (Purchase Price Per Share in Home Currency / Unaffected Price in Home Currency) -1] (also known as the Mergerstat Unaffected <strong>Control</strong> <strong>Premium</strong> in the book version)An implied discount computed from the Mergerstat® Unaffected <strong>Control</strong> <strong>Premium</strong>. [ = 1- [1/(1 + control premium)]The CUSIP number is a unique identifier of securities. Mergerstat® uses the first 6-digitsto identify the issuer company. Target CUSIP refers to the unique identifier number forthe target company being acquired.The stock ticker symbol for the Target company. If the Stock Exchange of the Targetcompany is not in the United States, the Target Stock Ticker also includes a twocharacter code identifying the Target company's country.Target company's common stock price per share unaffected by the acquisitionannouncement. Selected by Mergerstat® after analyzing each transaction (this price is inthe Home Currency)Target company's common stock price per share on the acquisition announcement date(this price is in the Home Currency).Target company's common stock price per share one day prior to the acquisitionannouncement date (this price is in the Home Currency).Target company's common stock price per share one week prior to the acquisitionannouncement date (this price is in the Home Currency).Target company's common stock price per share one month prior to the acquisitionannouncement date (this price is in the Home Currency).Target company's common stock price per share two months prior to the acquisitionannouncement date (this price is in the Home Currency).Target company's sales based on the latest reported 12-month period (LTM) prior to thetransaction's announcement date. Sales are reported in millions of USD and rounded.Target company's earnings before interest, taxes, depreciation and amortization (EBITDAbased on the latest reported 12-month period (LTM) prior to the transaction'sannouncement date. EBITDA is reported in millions of USD and rounded.Target company's earnings before interest and taxes (EBIT) based on the latest reported12-month period (LTM) prior to the transaction's announcement date. EBIT is reported inmillions of USD and rounded.
LTM Net IncomeBV TargetCommon EquityTarget InvestedCapitalBook Value perShareCommon SharesOutstandingOperating ProfitMarginNet Profit MarginImplied MVE ($mil)Price/SalesPrice/IncomePrice/Book ValueTarget InvestedCapital/EBITTarget InvestedCapital/EBITDADate AnnouncedDate EffectiveDeal Value ($mil)Deal Currency% of SharesAcquired% of Shares Heldat Date Announced% of Shares Heldafter AcquisitionPurchase Price PerShare (USD $'s)Common SharesAcquired (mil)Deal ExchangeRatePurchasePrice/Share (Homecurrency)Target company's net income (loss), excluding extraordinary items, based on the latestreported 12-month period (LTM) prior to the transaction's announcement date. Income isreported in millions of USD and rounded.Target company's book value (BV), sometimes referred to as shareholder's equity or nettangible assets, is based on the latest reported period prior to the transaction'sannouncement date. Book value is reported in millions of USD and rounded.Target company's implied total invested capital (TIC) based on the sum of impliedmarket value of equity plus the face value of total interest bearing debt and the bookvalue of preferred stock outstanding prior to the announcement date. (Reported inmillions of USD)The target company's BV Target Common Equity divided by the target company'sCommon Shares Outstanding.(Reported in USD)Target company's number of common shares outstanding shown in millions and rounded.LTM EBIT / LTM Net SalesLTM Net Income / LTM Net SalesTarget market value of equity (MVE) based on the purchase price per share times totalshares outstanding reported in the period prior to the transaction's announcement date.Market value of equity is reported in millions of USD and rounded.Purchase price-to-sales ratio for the target company based on the implied market valueof equity divided by the latest reported 12-month net sales prior to the announcementdate.Purchase price-to-net income ratio for the target company based on the implied marketvalue of equity divided by the latest reported 12-month net income prior to theannouncement date.Purchase price-to-book value ratio for the target company based on the implied marketvalue of equity divided by book value of the target company.Target TIC-to-EBIT ratio based on the target TIC divided by the latest reported 12-monthearnings before interest and taxes prior to the announcement date.Target TIC-to-EBITDA ratio based on the target TIC divided by the latest reported 12-month earnings before interest, taxes, depreciation and amortization prior to theannouncement date.Date that the acquisition was announced.Date that the acquisition became effective.The aggregate purchase price given to shareholders of the target company's commonstock by the acquiring company. Shown in millions of USD and rounded.The target company's local currency.Percent of the target company's common shares purchased by the acquiror in theacquisition.Percent of the target company's common shares held by the acquiring company on thedate announced.Percent of the target company's common shares held by the acquiring company followingthe transaction.The total consideration paid per share for the target company's shares.Number of target company's common shares acquired by the acquiring company in theacquisition, shown in millions and rounded.The Deal Exchange Rate is used to convert the financial data of international deals. It isalways going to be 1.00 for US deals. It is expressed in US dollars per unit of foreigncurrency. This rate is as of the closing date of the transaction.The total consideration paid per share for the target company's shares, denominated inthe home currency of the target company.
target is being acquired. An analyst will conduct further research into supporting press releases and SECfilings to find the unaffected price.Does the <strong>Control</strong> <strong>Premium</strong> <strong>Study</strong> include transactions of privately held companies?No, the <strong>Control</strong> <strong>Premium</strong> <strong>Study</strong> only includes transactions where the target was a publicly tradedcompany.I noticed that the <strong>Control</strong> <strong>Premium</strong> <strong>Study</strong> includes SIC codes that aren't part of the masterOSHA list. Why is this and what are these codes?In order to better classify the industries of certain acquirers and targets in the <strong>Control</strong> <strong>Premium</strong> <strong>Study</strong>,Mergerstat® created eight additional SIC codes. These codes are not part of the master OSHA list, butare used in the <strong>Control</strong> <strong>Premium</strong> <strong>Study</strong>. These additional codes are:6197 - Finance Companies6771 - Venture Capital/Private Equity6781 - Special Purpose Vehicles9141 - Sovereign Government9151 - Province/State Government9161 - Municipal Government9171 - National Agencies9181 - State AgenciesAre bankruptcy deal types included the Mergerstat® <strong>Control</strong> <strong>Premium</strong>?No. Bankruptcy deal types are excluded from the database.What is the Mergerstat® <strong>Control</strong> <strong>Premium</strong>?The Mergerstat® <strong>Control</strong> <strong>Premium</strong> is computed by comparing the per share total consideration price forone share of the target company's common stock to the Mergerstat® unaffected price (see below). Thispre-announcement price is selected by Mergerstat® and based on volume and price fluctuations duringthe period prior to the acquisition announcement.What are the guidelines for calculating the Mergerstat® <strong>Control</strong> <strong>Premium</strong>?1. Determination of the unaffected stock price2. Determination of the final price that the acquirer offers, per share, to purchase the target company'scommon stock, per terms of a tender offer3. Computation of the control premium using the following equation:(Purchase Price - Mergerstat®Unaffected Price) / Mergerstat® Unaffected PriceHow does Mergerstat® determine an unaffected stock price?Mergerstat® looks at the trading volume and stock price fluctuations for the year prior to the date ofannouncement. If they discover there is a significant change in stock trading activity, they conductresearch to determine the reason for such changes. If the reason is due to potential M&A activity (i.e. thetarget company has hired a financial advisor to seek buy-out opportunity, or the target company is in talkswith potential buyers), then the earliest date before such announcements will be selected as the
unaffected date, since this date is representative of normal pricing activity. If no talks or rumors weredisclosed prior to the announcement, one day prior to announcement will be selected as the unaffecteddate. The Mergerstat® unaffected stock price is the stock price on the unaffected date.How does Mergerstat® determine which financial statements to use for the target acquired?Mergerstat® uses the latest financial statements available prior to the announce date. For example, if theannounce date was February 25, 2011 (bidder agreed to buy target and announcement was made),Mergerstat® would use the latest financial statements of December 31, 2010. If this deal closed on April20, 2011, Mergerstat® would not use the financial statements of March 31, 2010--the latest financialstatements available prior to the announce date would be used, which would be the financial statementsof December 31, 2010.Can you give an example calculating the Mergerstat® <strong>Control</strong> <strong>Premium</strong>?As an example, let's use "Optical Coating Laboratory Inc."; SIC code is 3827. Unaffected price is $119.25 per share Purchase price per share is $400.55 <strong>Control</strong> <strong>Premium</strong> is 2.36The acquiror paid a premium over the Mergerstat® unaffected price per share of 2.36 TIMES ABOVE theMergerstat® unaffected price per share. With this example, the acquiror paid $281.43 per share (2.36 X$119.25) above the unaffected price of $119.25 per share, or a total price of $400.55 per share ($281.43+ $119.25). The key phrase is TIMES ABOVE the Mergerstat® unaffected price. The acquiror paid 2.36TIMES ABOVE the Mergerstat® unaffected price or 3.36 TIMES the Mergerstat® unaffected price. It ismore practical to express this number in percentage since that is the standard way of showing premiums:in this example the control premium would read 236%.Describe the proper use of the Mergerstat <strong>Control</strong> <strong>Premium</strong> -- how should it be selected for agiven engagement?The most likely case for the use of the <strong>Control</strong> <strong>Premium</strong> study would be for publicly traded companywhose quoted market price could serve as a fair value estimate.Lower valuations are used by the acquirer to evaluate internal synergies, with higher valuations justifiedby expected value of external synergies such as goodwill.The CPS can also be used for valuations of private companies with determining multiples price to book,price to revenue, and EBITDA multiples being used for companies of similar sizeI noticed that the <strong>FactSet</strong> Mergerstat® / <strong>BVR</strong> <strong>Control</strong> <strong>Premium</strong> <strong>Study</strong> calculates a minoritydiscount; what is the formula that the database uses to calculate this discount?The database uses the following calculation: Implied Minority Discount = 1 - [1/(1 + control premium)]An alternate equation that can also be used to determine the Implied Median Minority Discount is (whereCP is the <strong>Control</strong> <strong>Premium</strong>):Implied Median Minority Discount = CP / (1 + CP)
Is there any theoretical research that affirms that the inverse of a control premium is an impliedminority discount -- or is this simply accepted in the business valuations profession?The minority discount is widely perceived of as the inverse of the control premium, where as an acquirerwould assumingly pay a higher price for control in a company and pay a lesser amount for a minoritystake.An alternative theory used by appraisers and other professionals, was that the control premiums thatwere observed in the public markets tended to be paid by strategic buyers, or buyers that had the abilityto derive synergies from combinations or had other, specific, strategic intent.There is another large category of buyers of companies, the financial buyer. Financial buyers may nothave the ability to derive synergies from an acquisition, but they can seek financial returns from theirinvestments.How does a practitioner know when to apply a control premium or a minority discount?This document is an excerpt from the PowerPoint for <strong>BVR</strong>'s March 2008 webinar, Getting the Most fromthe <strong>FactSet</strong> Mergerstat®/<strong>BVR</strong> <strong>Control</strong> <strong>Premium</strong> <strong>Study</strong>, and is helpful in thinking about this question.Why are some of the Alacra-sourced Mergerstat transactions not present in the <strong>FactSet</strong>Mergerstat®/<strong>BVR</strong> <strong>Control</strong> <strong>Premium</strong> <strong>Study</strong>?Because the CPS is the result of an analysis of the data by Mergerstat research analysts whoreview each controlling acquisition for its relevancy for inclusion in the <strong>Study</strong>, the CPS does notinclude transactions deemed to be outliers.The CPS also does not include the valuation multiples for transactions where the valuationmultiples fall outside the following ranges (the transactions are included, though):o Price/Sales: 0-10X;o Price/Income: 0-40X;o Price/Book Value: 0-10X;o TIC/EBIT: 0-35Xo TIC/EBITDA: 0- 25XThese values were established as acceptable ranges when the <strong>Study</strong> was first put together in theearly 1990s.The CPS includes a control premium that is based on an unaffected price. This price is chosenafter an analysis of the trading volume and stock price fluctuations for the year prior to the date ofannouncement. The Alacra-sourced Mergerstat data does not include a control premium basedon an unaffected price.Does the MVIC include or exclude the value of any non-compete or employment agreements inthe Mergerstat CPS?
MVIC does not include the value of any non-compete or employment agreements. The Base Equity Priceis only comprised of what the Target is offered (price per share) multiplied by the Target's outstandingshare amount.In the <strong>FactSet</strong> Mergerstat®/<strong>BVR</strong> <strong>Control</strong> <strong>Premium</strong> <strong>Study</strong>, what is the amount of shares thatthe acquirer needs to purchase from the target for the transaction to be included in the study?The study includes all deals in which the buyer has both a controlling stake in the target (50.1% or above)after the transaction and had a minority stake (or 0% stake) in the target prior to the purchase. So, if acompany owned 40% and purchased 11% this transaction would be included. But if a company had a54% stake and bought 11%, it would not be included.How does Mergerstat determine the four transaction types (conglomerate, financial, verticaland horizontal)?By definition, they are as follows:Horizontal – both the target and acquirer are in the same industry and they compete directly inthe same product lines or markets. This is a strategic transaction. For example when 2 banks arecombining, it is horizontal because they are in the same business line. In most cases, the reasonbehind such transaction is to create an economies of scaleVertical – the target and acquirer are involved in different stages of the production process, suchas when a manufacturer acquires a distributor. This is a strategic transaction.Financial – the acquirer is a financial buyer. The buyer may be funded by a buy-out fund orspecially formed group of private investors or achieved through a leveraged buyout. Themotivation is not strategic, but financial and has the backing of outside investors. Other exampleswould be acquisitions by public shells and Management Buy-Out deals.Conglomerate – the target and the acquirer are in completely unrelated industries such as whena hotel acquires a radio station or when a waste collection company acquires auto distributors.Why does Mergerstat exclude valuation multiples that fall outside the following ranges:Price/Sales: 0-10X; Price/Income: 0-40X; Price/Book Value: 0-10X; TIC/EBIT: 0-35X andTIC/EBITDA: 0- 25X? How were these ranges selected and doesn't this introduce a bias into thedata?These values were established as acceptable ranges when the study was first put together in the early1990s. The ranges were developed and verified through Mergerstat’s relationships with investmentbanking firms [specifically HLHZ]. While it is true that excluding multiples from the ranges could introducebias, our experience has been that the vast majority of transactions fall within these ranges (for at leastone category). Please note the valuation multiples are excluded but the transactions are not.
What are the main differences between the Mergerstat data in Alacra and the <strong>FactSet</strong>Mergerstat®/<strong>BVR</strong> <strong>Control</strong> <strong>Premium</strong> <strong>Study</strong>?There are several differences between the two databases. 1) The Mergerstat/<strong>BVR</strong> CPS databasecontains only deals where the result is that a controlling interest is being exchanged (more than 50%),while Alacra covers all deals regardless of the percentage interest being exchanged. 2) TheMergerstat/<strong>BVR</strong> CPS database bases the control premium on an Unaffected Price (as well as 1-day, 1-week, 1-month, and 2-month price), while Alacra only uses a 1-day, 1-week, and 1-month price.What is the main difference between the <strong>FactSet</strong> Mergerstat®/<strong>BVR</strong> <strong>Control</strong> <strong>Premium</strong> <strong>Study</strong>database and the Mergerstat® Review publication?When calculating the control premium, the Mergerstat® Review uses the stock price on the acquisitionannouncement date, while the <strong>FactSet</strong> Mergerstat®/<strong>BVR</strong> <strong>Control</strong> <strong>Premium</strong> <strong>Study</strong> uses the unaffectedprice from potentially a different day from the announcement date price. Furthermore, the <strong>FactSet</strong>Mergerstat®/<strong>BVR</strong> <strong>Control</strong> <strong>Premium</strong> <strong>Study</strong> includes only controlling purchases while the Mergerstat®Review includes both controlling and non-controlling purchases.For a more detailed comparison, please see our Comparison ChartWe recently ordered the online Mergerstat® / <strong>BVR</strong> <strong>Control</strong> <strong>Premium</strong> <strong>Study</strong>. Does theMergerstat® Review contain information not included in the <strong>FactSet</strong> Mergerstat® / <strong>BVR</strong> <strong>Control</strong><strong>Premium</strong> <strong>Study</strong>? What are the differences, if any?The <strong>FactSet</strong> Mergerstat® / <strong>BVR</strong> <strong>Control</strong> <strong>Premium</strong> <strong>Study</strong> provides the actual transactions, theirmultiples and control premium and builds from there to deliver the range, mean and median premium byindustry or by quarter or 12-month summary. It also provides the ability to develop aggregate figures overlonger periods - like a chef would produce a meal from individual ingredients.The Mergerstat® Review takes the individual transactions (in this publication, the details are notavailable, except for a limited transaction roster in the book) and processes them into results - overallM&A market analysis, industry analysis, geographical analysis - like ready to consume food in thecompartments of a frozen dinner tray.There are advantages for any firm to owning both publications because there is little overlap. TheMergerstat® Review covers a much broader spectrum of M&A deals whereas the Mergerstat® / <strong>BVR</strong><strong>Control</strong> <strong>Premium</strong> <strong>Study</strong> focuses on premiums.Why doesn't the <strong>FactSet</strong> Mergerstat®/<strong>BVR</strong> <strong>Control</strong> <strong>Premium</strong> <strong>Study</strong> contain as manytransactions as are shown in the 2001 Mergerstat® Review? Because the <strong>FactSet</strong>Mergerstat®/<strong>BVR</strong> <strong>Control</strong> <strong>Premium</strong> <strong>Study</strong> contains data back to 1998 inclusive, one mightthink that the online version would have over 24,000 deals (4 years X 6,000 deals) in it. Why thediscrepancy?The reason the <strong>FactSet</strong> Mergerstat®/<strong>BVR</strong> <strong>Control</strong> <strong>Premium</strong> <strong>Study</strong> does not have as many closedtransactions as the Mergerstat® Review is because the CPS only contains information involving PUBLICtargets. The CPS tracks all closed deals on a quarterly basis involving worldwide public targets.
Also, the Mergerstat® Review includes both closed and announced deals; <strong>FactSet</strong> Mergerstat®/<strong>BVR</strong>control <strong>Premium</strong> <strong>Study</strong> only includes closed deals.Information in the Mergerstat® Review is only limited to transactions involving US companies, therefore itwill contain public, private, divestitures, and cross-border deals. The CPS is an in-depth extension of thepublic portion of the Mergerstat® Review, updated quarterly.My firm subscribes to both the Mergerstat® Review and the <strong>FactSet</strong> Mergerstat®/<strong>BVR</strong> <strong>Control</strong><strong>Premium</strong> <strong>Study</strong> (CPS). Recently, I noticed a difference that I cannot reconcile.Within the Mergerstat® Review, there is a chart that details the premiums paid for acquisitionsof publicly traded companies. From 1998 to 2000, the number of transactions was as follows.1998 5121999 7232000 574When I sort the CPS by year I get the following:1998 4061999 6772000 925Could you help me understand why there might be discrepancies in the transaction totals?The main difference between the two products stems from the inclusion criteria for each publication:The premiums in the Mergerstat® Review are only for US public targets. The data for the year comesonly from deals announced during that year that meet the criteria (of being a US public company).The premium information from the CPS comes from worldwide public targets where a controlling interestwas acquired, and the transaction closes during the specific quarter in which it is tracked. Regardless ofwhat year a deal is announced, it is only included in the <strong>Study</strong> when it closes.The main differences are US vs. worldwide data; controlling vs. minority & controlling data; andannounced date vs. closed date. The data in the 4Q CPS are the most likely to compare with the data inthe Review, but because of the difference in announce/close date criteria, they never match up exactly.Are all transactions in the <strong>FactSet</strong> Mergerstat® / <strong>BVR</strong> <strong>Control</strong> <strong>Premium</strong> <strong>Study</strong> stockpurchases, or are some asset purchases?The vast majority of transactions in the CPS are share purchases. Generally asset purchases get weededout in our screening process for a variety of reasons ~ price is for assets only, no per share amount forshareholders, sale is through bankruptcy courts, no financials available for assets only, etc.I see that you show the Harmonic Mean in the Transaction Summary table results for thevaluation multiples. What is the Harmonic Mean?
In the Transaction Summary of the Subscriber Search Results we present medians, averages,coefficients of variation and harmonic means, depending on the data. Many practitioners and academicsbelieve the harmonic mean is a better measure of central tendency for valuation multiples than the mean(the arithmetic average) or median (the middle value in a series). Quoting Wikipedia:The harmonic mean is the preferable method for averaging multiples, such as the price/earning ratio, inwhich price is in the numerator. If these ratios are averaged using an arithmetic mean (a common error),high data points are given greater weights than low data points. The harmonic mean, on the other hand,gives equal weight to each data point.Shannon P. Pratt of Shannon Pratt Valuations, Inc. writes on page 140 of his Second Edition of TheMarket Approach to Valuing Businesses:Although the harmonic mean is not used frequently, probably because it is unfamiliar to most readers ofvaluation reports, it is conceptually a very attractive alternative measure to central tendency.In addition, Gilbert Matthews of Sutter Securities Inc. wrote an article in the June 2006 BusinessValuation Update issue that is available here that explains what the Harmonic Mean is and provides adetailed example. Mark G. Filler of Filler & Associates P.A. replied to Mr. Matthews in the August 2006Business Valuation Update here. In addition, Mr. Matthews was quoted in the July 2001 BusinessValuation Update as follows:The harmonic mean is preferable in any ratio in which price is the numerator. For yields, when the price isin the denominator, an arithmetic mean is correct. An example is the “earnings yield” (EPS/P) rather thanPE used by the British. If price is the numerator, the result is an inverted ratio for which the harmonicmean is statistically a more appropriate measure of central value. The harmonic mean gives an equalweight to an equal investment in each company, while the arithmetic mean gives three times the weight toa multiple of 30x compared to a multiple of 10x. For most other uses in valuation, the arithmetic mean isappropriate. For a fuller discussion, see “Fairness Opinions” 1 by Mark M. Lee and Gilbert E. Matthewsand page 139 and 140 of the Second Edition of The Market Approach to Valuing Businesses by ShannonPratt.1 “Fairness Opinions” (Gilbert E. Matthews and M. Mark Lee), in The Handbook of Advanced BusinessValuation, R. Reilly and R. Schweihs, eds. (McGraw Hill, 2000).Lastly, here is an example that is provided by Toby Tatum and is representative for the businessvaluation profession. In addition, Toby has posted an article at his website that further investigates theharmonic mean:When calculating the average selling price (SP) to earnings ratios for businesses within a defined industrylet’s assume the known selling price to seller’s discretionary earnings (SDE) for one comparable companyis 3.0 times earnings and for another it is 2.0 times earnings. The object of the exercise is to determine,on average in a defined industry, what a business is worth based on a given level of earnings. Thearithmetic average of these two is 2.50 times earnings. This suggests that if a business has an SDE of$100,000 it is worth $250,000.Now, do the math for each business purchase separately. Assume the first buyer paid $300,000 for abusiness with an SDE of $100,000 (i.e., 3.0 times SDE). Assume another buyer paid $300,000 for abusiness with annual SDE of $150,000 (i.e., 2.0 times SDE). The total price paid for both businesses is$600,000 and the total SDE purchased is $250,000. This yields an average SP/SDE ratio of $600,000divided by $250,000 or 2.40 x SDE. 2.40 is the harmonic mean value of the Selling Price to Seller’sDiscretionary Earnings in this industry. Thus we can conclude that, on average in this industry, if abusiness has an SDE of $100,000, it is worth $240,000, or for every $1.00 in SDE, the seller gets $2.40(and not $2.50 as computed via the arithmetic mean above). Therefore, if one is to assume that the fairmarket value of a subject company is equal to the “average” selling price to earnings ratio for the
comparable transactions selected to represent that industry, then the multiple to apply against the knownearnings of the subject company must be the harmonic mean value of the comparables, and not thearithmetic mean.Would you please explain the "Coefficient of Variation" and how we should utilize and interpreteach calculation?The Coefficient of Variation = Standard Deviation / Mean (mean is the same as the average)The Coefficient of Variation is a measure of dispersion around the mean (average).The theory is that the valuation multiples with the lowest Coefficient of Variation are those with the leastdispersion around their respective means and may be the better indicators of value. The value derivedusing these valuation multiples may be weighted more heavily than those with larger Coefficient ofVariations.Why don't I see my SIC code of interest in the search engine's list of SIC codes?The Web site's search engines use the underlying data to create the list of SIC codes. If your SIC code isnot listed in the search engine, this means there are no transactions with that SIC code in the selecteddatabase. You may want to search the other databases to see if they have any helpful data. You cansearch all databases at the same time, by SIC code, by either clicking here or selecting the "Search All"menu option at the top left. The results of this search engine will display the number of transactionscontained in each <strong>BVMarketData</strong> database. If you click on each databases' representative number, theWeb site will display a summary of the data in that database. If you are a subscriber to the selecteddatabase, the Web site will display the subscriber search results. If you are not a subscriber to theselected database, the Web site will display the visitor search results.In the <strong>FactSet</strong> Mergerstat®/<strong>BVR</strong> <strong>Control</strong> <strong>Premium</strong> <strong>Study</strong>, I notice none of the companies inthe SIC code 6000 and 7000 series contains a calculation for the TIC/EBIT and TIC/EBITDAmultiples. The information to calculate these multiples is often included in the underlying data,but a valuation multiple is not displayed. Why is this?These valuation multiples are normally not meaningful when pricing financial companies, therefore, the<strong>FactSet</strong> Mergerstat®/<strong>BVR</strong> <strong>Control</strong> <strong>Premium</strong> <strong>Study</strong> has never calculated the TIC/EBIT and TIC/EBITDAmultiples for the companies that fall in the SIC code 6000 and 7000 series. This relates to all companiesin the Finance, Insurance, and Real Estate industries.What are the thresholds for company's financials and valuation multiples that Mergerstat® willinclude in the <strong>Control</strong> <strong>Premium</strong> <strong>Study</strong>?For company financials, including sales, net income, EBIT, EBITDA, and book value, Mergerstat®presents the latest twelve month (LTM) numbers including both positive and negative figures. However,for valuation multiples, including Price/Sales, Price/Income, Price/Book Value, TIC/EBIT and TIC/EBITDA,Mergerstat® has guidelines for including ratios that are considered representative for the <strong>Control</strong><strong>Premium</strong> <strong>Study</strong>. For reference, Mergerstat® only includes the multiples that fall in the following ranges:Price/Sales: 0-10X; Price/Income: 0-40X; Price/Book Value: 0-10X; TIC/EBIT: 0-35X and TIC/EBITDA: 0-25X. Please note the valuation multiples are excluded but the transactions are not.We were wondering about the number of bank and thrift transactions in the <strong>FactSet</strong>Mergerstat®/<strong>BVR</strong> <strong>Control</strong> <strong>Premium</strong> <strong>Study</strong>. The SIC codes we used were 6021, 6022, 6035 and
the NAICS codes were 52211, 52212. For 2003, only 4 transactions had data when, per SNLFinancial, 135 bank and thrift transactions have occurred this year. Why is there such a largediscrepancy?There could be several reasons as to why there are so few bank transactions in the <strong>FactSet</strong>Mergerstat®/<strong>BVR</strong> <strong>Control</strong> <strong>Premium</strong> <strong>Study</strong>. Oftentimes, the price paid per share was not disclosed and alump sum was given as the purchase price, therefore a premium could not be calculated. Also,sometimes banks don't always disclose their outstanding shares in their filings, especially if they areprivate. Financials can be obtained but if they are private, there would not be any trading prices, thereforea premium would not be able to be calculated. These would be some of the reasons why many banktransactions might be excluded from the <strong>FactSet</strong> Mergerstat®/<strong>BVR</strong> <strong>Control</strong> <strong>Premium</strong> <strong>Study</strong>.How does <strong>FactSet</strong> Mergerstat®/<strong>BVR</strong> <strong>Control</strong> <strong>Premium</strong> <strong>Study</strong> calculate LTM sales figures forbanks?LTM revenues for banks are calculated from interest income and non-interest income such ascommissions, foreign exchange income, etc.Can I use public company data to value a private company?Yes, sale details on publicly traded companies (valuation multiples for publicly traded companies can befound in the Public Stats database and the <strong>FactSet</strong> Mergerstat®/<strong>BVR</strong> <strong>Control</strong> <strong>Premium</strong> <strong>Study</strong>) canbe used to value a private company. The indicated value utilizing the sale of an entire public company willresult in a control value. It normally would not be appropriate to add a control premium. One or morediscounts may be appropriate, depending on the valuation assignment. For more details, see The MarketApproach to Valuing Businesses by Shannon Pratt (New York: John Wiley & Sons, 2001. p. 39).It appears that a business’s “selling price” in each database at <strong>BVMarketData</strong>.com sm usesdifferent terminology; can you please clarify the “selling price” in each database?Below, we show the term used for the “selling price” in each <strong>BVMarketData</strong>.com database and itsrespective definition:Pratt’s Stats® uses the term MVIC (Market Value of Invested Capital) for the “selling price.” The MVIC isthe overall consideration in the business sale and includes any cash, notes and/or securities that wereused as a form of payment plus any interest-bearing liabilities assumed by the buyer.The <strong>FactSet</strong> Mergerstat®/<strong>BVR</strong> <strong>Control</strong> <strong>Premium</strong> <strong>Study</strong> also uses two terms for the “selling price”;the Target Invested Capital (TIC) and Price. The TIC is the target company's implied total invested capitalbased on the sum of the implied market value of equity plus the face value of total interest bearing debtand the book value of preferred stock outstanding prior to the announcement date. The Price is theimplied market value of equity.BIZCOMPS ® uses one term for the “selling price”; Sale Price. Sale Price is the actual sale price ($000's)where inventory has been deducted, if it was included in the sale price.Public Stats uses the term MVIC (Market Value of Invested Capital) for the “selling price.” The MVIC isthe overall consideration in the business sale and includes any cash, notes and/or securities that wereused as a form of payment plus any interest-bearing liabilities assumed by the buyer.The FMV Restricted Stock <strong>Study</strong> does not report details on the sale of either a portion of a companyor an entire company and therefore does not contain a selling price field. Instead, this database reportsthe details related to transactions in restricted stock. This database does report a Market Value (in $000s)which is the market value of the firm determined on a pre-deal basis. The market value is calculated bymultiplying the shares outstanding before the private placement with the high-low average market pricefor the stock for the month prior to the transaction. The market value is not the selling price, per se, but acalculation of the value of the total equity on the date of the restricted stock transaction.The Valuation Advisors’ Lack of Marketability Discount <strong>Study</strong> does not report details on the sale ofeither a portion of a company or an entire company and therefore does not contain a selling price field.Instead, this database reports the details related to transactions in common stocks, stock options or
convertible preferred stocks prior to an initial public offering, and the relationship of these prices to theIPO price per share (the price of the stock paid by the initial public investors to acquire their shares).How do your subscribers pass along to their clients the expenses they incur for guidelinecompany data, control premium data, discount for lack of marketability data, economic data,industry data, etc?Some of our subscribers impose a separate resource/technology charge for every valuation assignment.They know approximately how many appraisals they do per year and divide that number into the [annual]costs of the databases and basic data resources they use, thereby passing along the resource (ortechnology) charges.Can I print more than one transaction at a time?To print a group of transactions (the current group size is 10); on the search results page in the list oftransactions, utilize the icon that looks like a red piece of paper – it is labeled “Print Detail ReportPackage”. When printing more than a couple of detailed transaction reports, this will save you time.I want the transaction reports to fit onto one page, instead of two. What can I do to make thispossible?The best solution is to maximize your print margins. In Internet Explorer the default margin size is 0.75inches. When you print transaction reports, reduce the print margins to 0.25 inches and most will fit on asingle page. Also, you should remove any header/footer information that Internet Explorer includes in webpage printouts. The print margins and header/footer settings can be found under File -> Page Setup inInternet Explorer.How can I expand my 4-digit SIC search to a 3-digit search or 2-digit search (select more thanone SIC code)?By pressing and holding down the LEFT mouse button, you can highlight a series of SIC codes (either bytwo digit SIC codes, three digit SIC codes or any series you want [all of manufacturing, for example]).By holding down the CONTROL button on the keyboard (and clicking with the LEFT mouse button), youcan highlight a noncontiguous group of SIC codes.Each time after I alter my search of the database and I ask for a printable format, the results ofmy very first search continues to show in the printable format window. Is there somethingdifferent that I can do so that I can print the results of the most current search?Assuming you are using Microsoft Internet Explorer, please do the following:In Internet Explorer, go to the Tools/Internet Options menuOn the General tab, in the Temporary Internet Files section, click "Delete Files"On the General tab, in the Temporary Internet Files section, click "Settings"If it is not already clicked, click the "Every visit to the page" radio button, then click "OK"I am unable to get the printable format window to appear when clicking on “Printable Format”or the Excel download when I click "Excel Format."Check your browser version and update to the latest. Also, check if you have some sort of pop-upwindow blocker, you need to disable the pop-up window blocker.
Some of the more advanced pop-up window blockers will allow you to customize the specific pop-ups youwould like to allow. Otherwise they will need to disable the program in order to view the printable format.Some pop-up blockers can be temporarily disabled by holding the "Ctrl" and "Alt" keys on the keyboardwhen you are attempting to allow pop-ups.Why don’t I see Excel Export as an option when I use Mozilla Firefox?Currently the Excel Export feature on BVMarketdata.com is only supported in Internet Explorer. The ExcelExport uses VBScript which is only supported in Internet Explorer. We are in the process of updating theexport function to be compatible with other web browsers. An alternative would be to use the Email to Meoption which will email the data to you in a comma separated file.When I click on the Excel Format button I am asked “Do you have Microsoft Excel installed?” Ianswer yes and then nothing happens. What is the fix for this?This typically happens when the subscriber is using a pop-up blocker. To bypass the pop-up blocker,press down on your “Shift,” “<strong>Control</strong>,” or "Alt" key (try all) prior AND during clicking on the Excel Formatbutton – this should bypass the pop-up blocker. If you are able, you may also addwww.<strong>BVMarketData</strong>.com as a “trusted” site in your pop-up blocker program – this would negate the needto hold down your <strong>Control</strong> button when you next use the Excel Format button.We are Windows users and are not successful in downloading the data to Excel format.If you are using Outlook to browse the internet, you may experience this problem. Apparently webbrowsing within Outlook has problems passing data from one page to another. To solve this, exit Outlookand use Internet Explorer to access our website.Another possibility is that you may have a pop-up blocker that is preventing the new window fromappearing. To solve this, disable your pop-up blocker by (1) turning the pop-up blocker off until you aredone exporting the data (2) holding either shift or control (dependent on your pop-up blocking software)which allows you to temporarily allow pop-ups while the button is pressed, and then reverts to blockingpop-ups once the button is depressed or (3) find the options or settings on your pop-up blocker andchoose to allow pop-ups from our website.We are Mac Users and are not successful in downloading the data into Excel format.Make sure you are using the most recent version of Internet Explorer for Mac. Here's a link to downloadthe most recent version of IE for Mac.http://www.microsoft.com/mac/download/default.asp#IEIf you are running Office 2001 for Mac, make sure you have the latest version. Click the link below todownload it and install it.http://www.microsoft.com/mac/downloads.aspx#office2001 and click on Microsoft Office 2001 CombinedUpdate 9.0.4
If you have any further questions please contact the Webmaster via e-mail at: nathans@bvresources.comor phone at 888-287-8258 and ask for Nathan.I am having trouble viewing the Excel Exported data in Excel 2000. Can you please help withthis?If you are having trouble viewing the Excel exported data from <strong>BVMarketData</strong>.com sm and are using Excel2000 (other versions of Excel have not exhibited this problem), please read the following.In the original version of Office 2000 there was a bug when passing Excel data over the web. Thisproblem was fixed in a service pack released by Microsoft. Once you install this service pack update onyour computer you should not have any trouble viewing the Excel data from <strong>BVMarketData</strong>.com sm .To update your Office 2000 to the latest service pack release, please locate your Office 2000 CD or Excel2000 CD and then visit the following web site at Microsoft.com:http://office.microsoft.com/ProductUpdates/default.aspxAt the top of the page click on the following link:Check for UpdatesYou will then be taken through a process of updating your Office 2000 install on your computer. This willupdate your Excel application as well. During the install, it will ask for your Office 2000 CD.If you have any questions please e-mail Nathan Struk at: nathans@bvresources.comCan you please discuss the difference between the mean and the median and how I mayinterpret the mean and median values of the search results?Click here for an explanation.Last updated: 11/13/2013Copyright © 2013 Business Valuation Resources, LLC. All rights reserved.(503) 291-7963