Using the The FMV Restricted Stock Study in ... - BVMarketData
Using the The FMV Restricted Stock Study in ... - BVMarketData
Using the The FMV Restricted Stock Study in ... - BVMarketData
- No tags were found...

You also want an ePaper? Increase the reach of your titles
YUMPU automatically turns print PDFs into web optimized ePapers that Google loves.
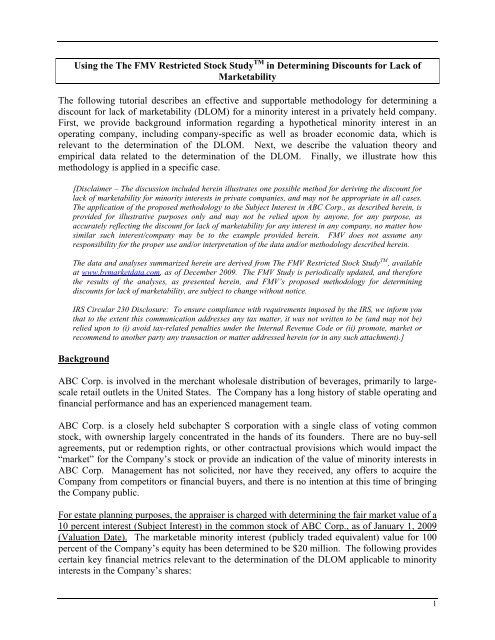
Latest twelve-month (LTM) revenues of $50 million. LTM net <strong>in</strong>come of $1 million. Total assets of $15 million as of December 31, 2008.Book value of shareholders’ equity of $5 milion as of December 31, 2008. Distributions to shareholders have historically been made <strong>in</strong> amounts necessary to covershareholders’ tax liabilities, but have never been <strong>in</strong> exces of such amounts <strong>in</strong> favor ofreta<strong>in</strong><strong>in</strong>g <strong>in</strong>come for expansion. <strong>The</strong> majority owners <strong>in</strong>tend to pursue a similar strategy<strong>in</strong> <strong>the</strong> foreseeable future.Economic InformationAnnualized economic growth, as measured by gross domestic product (GDP), was negative 6.3percent <strong>in</strong> Q4 2008, compared with negative 0.5 percent <strong>in</strong> Q3 2008 and negative 0.2 percent <strong>in</strong>Q4 2007. 1 UCLA’s Anderson Forecast projects that real GDP will decl<strong>in</strong>e at annualized rates of6.8 percent <strong>in</strong> Q1 2009, 4.5 percent <strong>in</strong> Q2 2009, and 1.7 percent <strong>in</strong> Q3 2009. Nationalunemployment rose to 6.7 percent <strong>in</strong> November 2008 from 4.5 percent a year earlier 2 andwas expected to reach 10 percent <strong>in</strong> 2010. 3U.S. equity markets experienced significant turbulence <strong>in</strong> 2008. <strong>The</strong> first significant decrease <strong>in</strong><strong>the</strong> Dow occurred on July 15, 2008 when <strong>the</strong> blue chip <strong>in</strong>dex fell below 11,000 on fears of bankfailures. <strong>The</strong> Dow <strong>the</strong>n <strong>in</strong>creased substantially <strong>the</strong> follow<strong>in</strong>g day due to a comb<strong>in</strong>ation of ris<strong>in</strong>goil prices and U.S. government market <strong>in</strong>tervention, through which short-sell<strong>in</strong>g of shares wasprohibited for 799 f<strong>in</strong>ancial stocks. <strong>The</strong> Dow decreased aga<strong>in</strong> on September 17, 2008, whenAIG received a loan from <strong>the</strong> U.S. government, and aga<strong>in</strong> on September 29, when <strong>the</strong> U.S.Treasury Department’s bailout bil failedto ga<strong>in</strong> approval <strong>in</strong> <strong>the</strong> House of Representatives. For<strong>the</strong> full year, <strong>the</strong> Dow decl<strong>in</strong>ed 4,268 po<strong>in</strong>ts to 8,776, <strong>the</strong> S&P 500 decreased 544 po<strong>in</strong>ts to 903,and <strong>the</strong> NASDAQ decreased 1,033 po<strong>in</strong>ts to 1,557. Highlight<strong>in</strong>g <strong>the</strong> extreme level of marketvolatility observed <strong>in</strong> fall 2008, on October 24, 2008, <strong>the</strong> CBOE VIX <strong>in</strong>dicator 4 reached its alltime<strong>in</strong>traday high of 89.53, 5 and on November 20, 2008, <strong>the</strong> <strong>in</strong>dicator experienced its highestdaily clos<strong>in</strong>g of 80.86. On December 31, 2008, VIX closed at 40.Problem: DLOM Determ<strong>in</strong>ationReview <strong>the</strong> data provided regard<strong>in</strong>g ABC Corp., <strong>the</strong> Subject Interest and <strong>the</strong> state of <strong>the</strong>economy as of <strong>the</strong> Valuation Date. Your assignment is to determ<strong>in</strong>e an appropriate DLOM for<strong>the</strong> Subject Interest as of <strong>the</strong> Valuation Date.1 http://www.bea.gov/newsreleases/national/gdp/gdpnewsrelease.htm2 http://www.bls.gov/news.release/jec.nr0.htm3 http://uclaforecast.com/contents/archive/2009/media_32509_1.asp4 Measures market expectations of near-term volatility conveyed by S&P 500 stock <strong>in</strong>dex option prices. Seehttp://www.cboe.com/micro/vix/<strong>in</strong>troduction.aspx5 http://cboenews.com/10-29-2009/VIX_milestones.php2
alowed <strong>the</strong> purchaser to “tack” <strong>the</strong> hold<strong>in</strong>g period of previous owners to his/her ownhold<strong>in</strong>g period, as long as <strong>the</strong> previous owners were not affiliates of <strong>the</strong> issuer.- 1997. <strong>The</strong> <strong>in</strong>itial hold<strong>in</strong>g period was shortened from two years to one year, and <strong>the</strong> ultimatehold<strong>in</strong>g period for non-affiliates under Rule 144 (k) was shortened from three years to twoyears.- 2008. <strong>The</strong> <strong>in</strong>itial hold<strong>in</strong>g period applicable to <strong>the</strong> resale of restricted securities of report<strong>in</strong>gissuers was reduced from one year to six months (<strong>the</strong> hold<strong>in</strong>g period for sales of restrictedsecurities of non-report<strong>in</strong>g issuers rema<strong>in</strong>ed at one year). <strong>The</strong> ultimate hold<strong>in</strong>g period fornon-affiliates was reduced to six months for report<strong>in</strong>g issuers, and to one year for nonreport<strong>in</strong>gissuers.In addition to <strong>the</strong> above-mentioned regulatory changes that have improved <strong>the</strong> liquidity ofrestricted stock, <strong>the</strong> development of new f<strong>in</strong>ancial derivatives and trad<strong>in</strong>g techniques hassimilarly impacted <strong>the</strong> “market” for restricted stock.Valuation Guidel<strong>in</strong>esIRS Revenue Rul<strong>in</strong>g 77-287 establishes valuation guidel<strong>in</strong>es <strong>in</strong> <strong>the</strong> determ<strong>in</strong>ation of DLOMs forsecurities restricted under Rule 144. <strong>The</strong> basis for Revenue Rul<strong>in</strong>g 77-287 was <strong>the</strong> InstitutionalInvestor <strong>Study</strong> Report 7 (SEC <strong>Study</strong>), which empirically exam<strong>in</strong>ed discounts <strong>in</strong> more than 300transactions <strong>in</strong>volv<strong>in</strong>g securities that were restricted under provisions similar to Rule 144, andwhich found an overall average discount of 24 percent. Importantly, <strong>the</strong> SEC <strong>Study</strong> also foundthat <strong>the</strong> discount is correlated with certa<strong>in</strong> key f<strong>in</strong>ancial metrics of <strong>the</strong> issu<strong>in</strong>g company. Basedon <strong>the</strong> SEC <strong>Study</strong> f<strong>in</strong>d<strong>in</strong>gs, Revenue Rul<strong>in</strong>g 77-287 provides certa<strong>in</strong> guidel<strong>in</strong>es for determ<strong>in</strong><strong>in</strong>gDLOMs for restricted securities, <strong>in</strong>clud<strong>in</strong>g but not limited to <strong>the</strong> follow<strong>in</strong>g:1. No automatic formulas should be used.2. <strong>The</strong> discount is a function of <strong>the</strong> earn<strong>in</strong>gs, net assets and sales of <strong>the</strong> issu<strong>in</strong>g entity.3. <strong>The</strong> discount is a function of <strong>the</strong> resale constra<strong>in</strong>ts applicable to <strong>the</strong> restrictedsecurity.In summary, <strong>the</strong> appropriate DLOM for illiquid securities is not <strong>the</strong> result of apply<strong>in</strong>g anautomatic formula, but will vary depend<strong>in</strong>g on <strong>the</strong> specific facts and circumstances <strong>in</strong> any case.[Take-Home Po<strong>in</strong>t =>] In select<strong>in</strong>g a DLOM, consideration should be given to (1) <strong>the</strong> f<strong>in</strong>ancialcondition and performance of <strong>the</strong> issu<strong>in</strong>g company, and (2) <strong>the</strong> degree of illiquidity of <strong>the</strong>securities be<strong>in</strong>g valued.7 Institutional Investor <strong>Study</strong> Report of <strong>the</strong> Securities and Exchange Commission, H.R. Doc. No. 64, Part 5, 92ndCongress, 1st Session, 1971, pp. 2444-2456.5
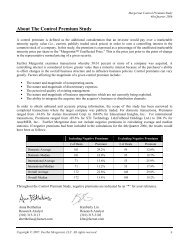
<strong>The</strong> <strong>FMV</strong> <strong>Restricted</strong> <strong>Stock</strong> <strong>Study</strong> TM<strong>The</strong> <strong>FMV</strong> <strong>Study</strong> is <strong>the</strong> largest, most detailed of <strong>the</strong> available restricted stock studies, andprovides specific <strong>in</strong>formation on how to determ<strong>in</strong>e DLOMs for m<strong>in</strong>ority <strong>in</strong>terests <strong>in</strong> privatefirms. <strong>The</strong> <strong>FMV</strong> <strong>Study</strong> 8 <strong>in</strong>cludes 597 actual transactions <strong>in</strong>volv<strong>in</strong>g restricted securities of publiccompanies from July 1980 through December 2008. <strong>The</strong> overall average discount for all 597transactions <strong>in</strong> <strong>the</strong> <strong>FMV</strong> <strong>Study</strong> is 20.5 percent and <strong>the</strong> median discount is 17.0 percent. <strong>The</strong>sample distribution is shown <strong>in</strong> <strong>the</strong> histogram below:Histogram: <strong>The</strong> <strong>FMV</strong> <strong>Restricted</strong> <strong>Stock</strong> <strong>Study</strong> (1980-2008)Frequency1009080706050403020100< -10%-10% to -5%-5% to 0%0% to 5%5% to 10%10% to 15%15% to 20%20% to 25%25%to 30%30% to 35%35% to 40%40% to 45%<strong>Restricted</strong> <strong>Stock</strong> Discount45% to 50%50% to 55%55% to 60%60% to 65%65% to 70%70% to 75%75% to 100%<strong>The</strong> impact of f<strong>in</strong>ancial risk and stock price volatility on <strong>the</strong> DLOM is significant. <strong>The</strong>follow<strong>in</strong>g table provides a comparison of company characteristics between high-discounttransactions and low-discount transactions. <strong>The</strong> sample is divided <strong>in</strong>to five percentile groups, orqu<strong>in</strong>tiles, based on <strong>the</strong> distribution of <strong>the</strong> restricted stock discount, and medians are computed foreach qu<strong>in</strong>tile group across all parameters. 98 <strong>The</strong> <strong>FMV</strong> <strong>Restricted</strong> <strong>Stock</strong> <strong>Study</strong> is presented <strong>in</strong> “Determ<strong>in</strong><strong>in</strong>g Lack of Marketability Discounts” and al of <strong>the</strong>data <strong>the</strong>re<strong>in</strong> is available through www.BVMarketdata.com.9 Due to <strong>the</strong> long time period over which <strong>the</strong> <strong>FMV</strong> <strong>Study</strong> transactions take place, company f<strong>in</strong>ancial characteristicshave been adjusted for <strong>in</strong>flation for better comparability.6
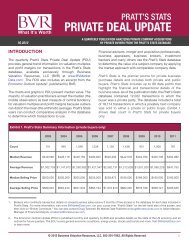
<strong>The</strong> <strong>FMV</strong> <strong>Study</strong> also provides data on variables that are directly associated with <strong>the</strong> particulardegree of liquidity of a block of restricted stock. As discussed previously, Rule 144 requires that<strong>in</strong> order to sell through public trad<strong>in</strong>g, restricted stock has to be held for an <strong>in</strong>itial hold<strong>in</strong>g periodof between six months and two years, depend<strong>in</strong>g on <strong>the</strong> date <strong>the</strong> stock was issued, and <strong>the</strong>nslowly “dribbled out” <strong>in</strong> public markets accord<strong>in</strong>g to Rule 144’s volume limit provisions. Under<strong>the</strong> dribble-out provisions, large blocks of restricted stock can take many years to dribble-out <strong>in</strong>public trad<strong>in</strong>g and are <strong>the</strong>refore significantly more illiquid than small blocks. Not surpris<strong>in</strong>gly,<strong>the</strong> DLOM is strongly correlated with block size, as shown <strong>in</strong> <strong>the</strong> table below:Median StatisticsMarket Total% Shares Value Assets MTB IssuerPlaced ($mm) ($mm) Ratio Volatility VIX Discount0 - 10% $129.7 $33.2 5.6 75.7% 22.2 16.2%10 - 20% 99.2 41.6 3.5 68.5% 17.9 16.5%20 - 30% 62.2 32.9 2.9 75.3% 15.1 17.6%30 - 40% 37.0 22.9 2.6 79.8% 15.7 33.1%> 40% 15.8 23.0 1.3 80.8% 17.6 40.2%<strong>The</strong> data shows that <strong>the</strong> discount <strong>in</strong>creases due to a greater degree of illiquidity (i.e., larger blocksize), and <strong>the</strong> magnitude of this relationship is most significant among block sizes greater than 30percent.[Take-Home Po<strong>in</strong>t =>] <strong>The</strong>se very large blocks, which may require many years to liquidatethrough public sales, are so illiquid that <strong>the</strong>y resemble private equity. Stated differently, <strong>the</strong>dribble-out provisions of Rule 144 make it so difficult to sell such blocks <strong>in</strong> public markettrad<strong>in</strong>g that <strong>the</strong> most attractive solution, <strong>in</strong> most cases, would be a private sale.We note that <strong>the</strong> large-block transactions are, on average, accompanied by weaker companyf<strong>in</strong>ancial characteristics as <strong>in</strong>dicated by lower market value and total assets. Accord<strong>in</strong>gly, <strong>in</strong>order to better isolate <strong>the</strong> impact of liquidity on <strong>the</strong> discount, we have elim<strong>in</strong>ated companies <strong>in</strong><strong>the</strong> <strong>FMV</strong> <strong>Study</strong> with market values greater than $100 million. Additionally, we have elim<strong>in</strong>atedtransactions that were known to <strong>in</strong>clude registration rights. 11 <strong>The</strong> table below provides acomparison of large-block versus small-block transactions with<strong>in</strong> this transaction sample.11 Because <strong>the</strong> terms of registration rights are often ei<strong>the</strong>r unknown or are sufficiently complex such that estimat<strong>in</strong>g<strong>the</strong>ir impact is difficult, we have removed this uncerta<strong>in</strong>ty from our analysis.8
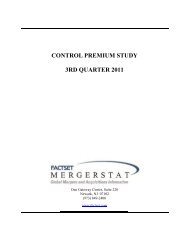
Median StatisticsMarket Total% Shares Value Assets MTB IssuerPlaced ($mm) ($mm) Ratio Volatility VIX Discount< 20% $39.9 $11.9 4.2 81.7% 22.2 23.9%> 20% 37.4 16.8 3.1 85.7% 15.1 34.5%> 25% 35.0 18.1 2.8 68.6% 15.1 37.9%> 30% 33.4 20.3 2.7 78.5% 16.6 47.7%> 35% 23.9 8.3 6.7 80.8% 17.5 52.6%MTB 35% 38.6 60.7 3.3 80.8% 21.2 52.6%Increas<strong>in</strong>g block size from less than 20 percent to greater than 35 percent results <strong>in</strong> an <strong>in</strong>crease to<strong>the</strong> discount of 28.7 percentage po<strong>in</strong>ts (52.6% - 23.9% = 28.7%), or approximately 2.2 times(52.6% / 23.9% = 2.2). We note that given <strong>the</strong> particular sample selected, as described above,<strong>the</strong> key f<strong>in</strong>ancial characteristics are generally similar between <strong>the</strong> various groups analyzed.However, because <strong>the</strong> MTB ratio <strong>in</strong>creases somewhat for blocks greater than 35 percent, wehave removed companies that have MTB ratios above 10.0, as shown above, and we f<strong>in</strong>d similarresults. We conclude that, given a particular level of company-specific risk, more illiquidsecurities require substantially higher discounts.We have stated previously that private equity should generally be considered more illiquid thantypical restricted stock <strong>in</strong> public entities, and that <strong>the</strong> largest blocks of restricted stock <strong>in</strong> publiccompanies are <strong>the</strong> most comparable to private equity. <strong>The</strong> table below provides <strong>the</strong> <strong>in</strong>dicateddiscount adjustment factors that result from <strong>the</strong> greater illiquidity associated with large blocks ofrestricted shares, which should also be considered appropriate adjustment factors to derive <strong>the</strong>discount applicable to private equity (which is most similar to <strong>the</strong> largest blocks of restrictedshares).9
Based on our analysis, we have determ<strong>in</strong>ed two adjustment factors: additive (determ<strong>in</strong>ed as <strong>the</strong>difference <strong>in</strong> <strong>the</strong> median discount between <strong>the</strong> large-block and small-block transaction samples)and multiplicative (determ<strong>in</strong>ed as <strong>the</strong> fraction of <strong>the</strong> median discount of <strong>the</strong> large-blocktransactions divided by <strong>the</strong> median discount of <strong>the</strong> small-block transactions). For example, <strong>the</strong>28.7% additive adjustment for greater-than-35% blocks is calculated as 52.6% - 23.9%, and <strong>the</strong>2.20 multiplicative adjustment is calculated as 52.6% / 23.9%. As shown, <strong>the</strong> additiveadjustment factors range from 11.0 percent to 29.0 percent and <strong>the</strong> multiplicative adjustmentfactors range from 1.45 to 2.2 times.[Take-Home Po<strong>in</strong>t =>] <strong>Us<strong>in</strong>g</strong> <strong>the</strong> degree of liquidity of large blocks of restricted stock <strong>in</strong>public companies as a proxy for <strong>the</strong> degree of liquidity of private equity, <strong>the</strong>se adjustment factorsmay be applied to <strong>the</strong> restricted stock equivalent discount to derive <strong>the</strong> discount appropriate forprivate equity.Typically, <strong>the</strong> multiplicative adjustment factor should be considered more appropriate than <strong>the</strong>additive adjustment factor, especially <strong>in</strong> cases where <strong>the</strong> selected restricted stock equivalentdiscount is significantly above or below <strong>the</strong> 23.9% median discount for <strong>the</strong> control group. Forexample, add<strong>in</strong>g 28.7% to a 15% restricted stock equivalent discount may be excessive (providesa private equity discount <strong>in</strong>dication of 43.7%), whereas a 2.2 times multiplicative adjustmentprovides a private equity discount <strong>in</strong>dication of 33%.<strong>The</strong> variables discussed so far are <strong>in</strong>dicators of company-specific f<strong>in</strong>ancial and market risk and<strong>the</strong> degree of liquidity of a particular security. <strong>The</strong> <strong>FMV</strong> <strong>Study</strong> also provides data regard<strong>in</strong>g <strong>the</strong>impact of broader market risk, measured by volatility <strong>in</strong> equity markets. In order to assess <strong>the</strong>impact of broader market risk on restricted stock discounts, each transaction <strong>in</strong> <strong>the</strong> <strong>FMV</strong> <strong>Study</strong> isassigneda “market volatility” variable. For this analysis, we utilized <strong>the</strong> CBOE Volatility Index(VIX), a widely used measure of market risk. 12 To control for short-term fluctuations <strong>in</strong> VIXvalues (which can be highly volatile) dur<strong>in</strong>g <strong>the</strong> typical time period required to complete privateplacement transactions, <strong>the</strong> trail<strong>in</strong>g 6-month average daily VIX clos<strong>in</strong>g value. 13 <strong>The</strong> table belowdemonstrates that transactions occurr<strong>in</strong>g dur<strong>in</strong>g times of high VIX values have higher-thannormaldiscounts.12 VIX is <strong>the</strong> ticker symbol for <strong>the</strong> Chicago Board Options Exchange Volatility Index, which is constructed us<strong>in</strong>g<strong>the</strong> implied volatilities of a wide range of S&P <strong>in</strong>dex options (both calls and puts) and <strong>in</strong>dicates <strong>the</strong> market’sexpectation of 30-day forward-look<strong>in</strong>g volatility. See http://www.<strong>in</strong>vestopedia.com/terms/v/vix.asp.13 S<strong>in</strong>ce only <strong>the</strong> transaction month and not <strong>the</strong> exact day is known for many of <strong>the</strong> <strong>FMV</strong> <strong>Study</strong> transactions, <strong>the</strong>market volatility variable is <strong>the</strong> maximum trail<strong>in</strong>g 6-month average daily VIX clos<strong>in</strong>g value for <strong>the</strong> transactionmonth.10
Median StatisticsMarket TotalVIX % Shares Value Assets MTBPercentile Group Low High Placed ($mm) ($mm) Ratio VIX DiscountTop Qu<strong>in</strong>tile 25.3 - 32.9 8.2% 64.8 23.0 2.9 28.4 20.4%Second Qu<strong>in</strong>tile 23.2 - 25.3 6.8% 131.9 34.5 5.7 23.9 17.1%Third Qu<strong>in</strong>tile 17.4 - 23.2 7.6% 126.6 34.0 5.2 21.5 15.2%In order to isolate market risk and control for <strong>the</strong> degree of liquidity, for <strong>the</strong> above analysis wehave excluded transactions <strong>in</strong> <strong>the</strong> <strong>FMV</strong> <strong>Study</strong> with block sizes greater than 20 percent. Asillustrated, <strong>the</strong> top-qu<strong>in</strong>tile and second-qu<strong>in</strong>tile groups possess median discounts of 20.4 percentand 17.1 percent, respectively, versus discount for <strong>the</strong> middle (third) qu<strong>in</strong>tile of 15.2 percent.We note that <strong>the</strong> companies <strong>in</strong> <strong>the</strong> top qu<strong>in</strong>tile, on average, possess greater f<strong>in</strong>ancial risk than <strong>the</strong>companies <strong>in</strong> <strong>the</strong> second and third qu<strong>in</strong>tiles, as shown by lower market value and total assets.Accord<strong>in</strong>gly, <strong>in</strong> order to better isolate <strong>the</strong> impact of stock market volatility on <strong>the</strong> discount, wehave elim<strong>in</strong>ated companies <strong>in</strong> <strong>the</strong> <strong>FMV</strong> <strong>Study</strong> with market values greater than $100 million. <strong>The</strong>sample analyzed <strong>in</strong> <strong>the</strong> below table <strong>in</strong>cludes all <strong>FMV</strong> <strong>Study</strong> transactions with block sizes lessthan 20 percent and market values below $100 million.Median StatisticsMarket TotalVIX % Shares Value Assets MTBLow High Placed ($mm) ($mm) Ratio VIX DiscountTop Decile 28.5 - 32.9 6.9% 43.6 11.8 2.9 29.7 32.1%Top Qu<strong>in</strong>tile 26.1 - 32.9 7.7% 43.6 12.0 2.9 28.5 26.9%Second Qu<strong>in</strong>tile 23.9 - 26.1 7.8% 48.6 16.7 3.1 24.6 24.4%Sample Median 11.7 - 32.9 9.0% 44.3 15.0 3.2 22.5 21.8%As shown, <strong>the</strong> various percentile groups possess similar company-specific f<strong>in</strong>ancial risk andliquidity characteristics, suggest<strong>in</strong>g that <strong>the</strong> observed differences <strong>in</strong> discounts are primarily afunction of differences <strong>in</strong> market volatility. <strong>The</strong> table below provides <strong>the</strong> <strong>in</strong>dicatedmultiplicative adjustment factors based on <strong>the</strong> VIX value as of a valuation date.VIX Median Median MultiplicativeLow High VIX Discount Adj. FactorTop Decile 28.5 - 32.9 29.7 32.1% 1.47Top Qu<strong>in</strong>tile 26.1 - 32.9 28.5 26.9% 1.23Second Qu<strong>in</strong>tile 23.9 - 26.1 24.6 24.4% 1.12Sample Median 11.7 - 32.9 22.5 21.8% 0.00<strong>The</strong> above table <strong>in</strong>dicates that mov<strong>in</strong>g from a VIX value of 22.5 to 29.7 results <strong>in</strong> an <strong>in</strong>crease <strong>in</strong><strong>the</strong> discount of 10.3 percentage po<strong>in</strong>ts, or 1.47 times <strong>the</strong> median discount for <strong>the</strong> overall sample.Accord<strong>in</strong>gly, <strong>in</strong> <strong>the</strong> event that a valuation date falls with<strong>in</strong> a period of unusually high market11
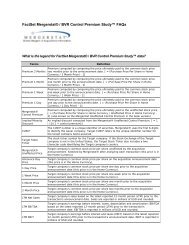
volatility, it is appropriate to apply an adjustment factor to <strong>the</strong> discount arrived at by comparisonof company-specific f<strong>in</strong>ancial and market risk and security liquidity characteristics. <strong>The</strong>appropriate adjustment factor is selected consider<strong>in</strong>g <strong>the</strong> median discount from <strong>the</strong>qu<strong>in</strong>tile/decile group <strong>in</strong> which a particular valuation date falls based on <strong>the</strong> trail<strong>in</strong>g 6-monthaverage VIX value as of such date. However, consideration may also be given to VIX valuescloser to <strong>the</strong> valuation date (e.g., trail<strong>in</strong>g 3-month, 1-month, and valuation date values). In <strong>the</strong>event <strong>the</strong> VIX value on a given valuation date is significantly above historical levels, such asdur<strong>in</strong>g fall 2008, valuation date VIX values may better capture <strong>in</strong>vestor sentiment than trail<strong>in</strong>g 6-month averages.DLOM Determ<strong>in</strong>ation Methodology<strong>The</strong> methodology to determ<strong>in</strong>e <strong>the</strong> DLOM, based on <strong>the</strong> above data and analyses, <strong>in</strong>volves athree-step analysis:1. <strong>Restricted</strong> <strong>Stock</strong> Equivalent Discount. <strong>The</strong> determ<strong>in</strong>ation of <strong>the</strong> discountapplicable to <strong>the</strong> shares (or o<strong>the</strong>r equity <strong>in</strong>terest) <strong>in</strong> a private company, as if <strong>the</strong>ywere restricted shares <strong>in</strong> a public company. <strong>The</strong> determ<strong>in</strong>ation of <strong>the</strong> restrictedstock equivalent discount is based on a comparative analysis of <strong>the</strong> subjectcompany and <strong>the</strong> <strong>FMV</strong> <strong>Study</strong> companies issu<strong>in</strong>g small blocks of restricted stock.2. Private Equity Discount. An analysis of <strong>the</strong> <strong>in</strong>cremental discount required forprivate equity, which reflects <strong>the</strong> fact that <strong>in</strong>terests <strong>in</strong> private companies aresignificantly less liquid than all but <strong>the</strong> most illiquid issues (i.e., <strong>the</strong> largestblocks) of restricted stock <strong>in</strong> public companies. <strong>The</strong> adjustment to go from <strong>the</strong>restricted stock equivalent discount to <strong>the</strong> private equity discount is based on <strong>the</strong>additive and multiplicative adjustment factors derived from <strong>the</strong> comparison ofdiscounts associated with small-block versus large-block transactions.3. Market Volatility Adjustment. An analysis of <strong>the</strong> <strong>in</strong>cremental discount required <strong>in</strong><strong>the</strong> event that equity markets demonstrate unusually high volatility around a givenvaluation date. This adjustment reflects <strong>the</strong> fact that restricted stock transactionsgenerally occur at higher discounts dur<strong>in</strong>g periods of abnormally high marketvolatility. <strong>The</strong> adjustment factor is derived from a comparison of <strong>FMV</strong> <strong>Study</strong>transactions occurr<strong>in</strong>g dur<strong>in</strong>g months with normal trail<strong>in</strong>g 6-month average VIXvalues versus those occurr<strong>in</strong>g dur<strong>in</strong>g months with very high trail<strong>in</strong>g 6-monthaverage VIX values.<strong>The</strong> three steps outl<strong>in</strong>ed above relate to <strong>the</strong> alternative levels of value framework,discussed previously, as shown <strong>in</strong> <strong>the</strong> follow<strong>in</strong>g diagram.12
Level of Value Adjustment Support<strong>in</strong>g Data / MethodologyMarketable M<strong>in</strong>ority(Publicly Traded Equivalent) <strong>Restricted</strong> <strong>Stock</strong> Comparative Analysis with Small-BlockEquivalent Discount <strong>Restricted</strong> <strong>Stock</strong> Transactions<strong>Restricted</strong> <strong>Stock</strong> EquivalentPrivate EquityLarge-Block vs. Small-BlockNon-Marketable M<strong>in</strong>ority Discount Adjustment <strong>Restricted</strong> <strong>Stock</strong> Transactions(Private Equity)Normal Time FrameMarket Volatility <strong>Restricted</strong> <strong>Stock</strong> TransactionsNon-Marketable M<strong>in</strong>ority Adjustment Dur<strong>in</strong>g Volatile Months(Private Equity)vs. Normal MonthsHighly Volatile Time Frame[Take-Home Po<strong>in</strong>t =>] <strong>FMV</strong> does not advocate estimat<strong>in</strong>g <strong>the</strong> DLOM based on a directcomparison of <strong>the</strong> subject company with large-block transactions (or with large-blocktransactions occurr<strong>in</strong>g dur<strong>in</strong>g highly volatile periods), which would necessitate a s<strong>in</strong>gle step toderive <strong>the</strong> private equity discount (or <strong>the</strong> total discount <strong>in</strong> <strong>the</strong> event a valuation date falls with<strong>in</strong> ahighly volatile period), because <strong>the</strong>re is not a sufficient sample of large-block transactions toprovide a reliable discount <strong>in</strong>dication <strong>in</strong> most cases. It is our op<strong>in</strong>ion that <strong>the</strong> two-step analysisto derive <strong>the</strong> private equity discount (and <strong>the</strong> three-step analysis to derive <strong>the</strong> total discount)generates more accurate results.Application of DLOM Determ<strong>in</strong>ation MethodologyThis section illustrates how <strong>the</strong> above three-step method may be applied to determ<strong>in</strong>e anappropriate DLOM for <strong>the</strong> Subject Interest <strong>in</strong> ABC Corp.<strong>Restricted</strong> <strong>Stock</strong> Equivalent DiscountThis analysis is based on a comparison of <strong>the</strong> follow<strong>in</strong>g f<strong>in</strong>ancial characteristics of <strong>the</strong> subjectprivate company to those of issuers of small-block transactions (less than 20 percent sharesplaced) <strong>in</strong> <strong>the</strong> <strong>FMV</strong> <strong>Study</strong>: market value, revenues, total assets, book value of equity, MTB ratio,net <strong>in</strong>come, net profit marg<strong>in</strong>, and whe<strong>the</strong>r or not <strong>the</strong> company pays regular dividends. <strong>The</strong>seeight valuation parameters are grouped <strong>in</strong>to four broad categories: size, balance sheet risk,profitability, and dividends. [Note - for private entities which are pass-through entities for taxpurposes (e.g., subchapter S corporations, limited partnerships, and limited liability companies),we typically consider such entities to be dividend-pay<strong>in</strong>g only if distributions are made above <strong>the</strong>level required to satisfy owners’<strong>in</strong>dividual <strong>in</strong>come tax liabilities.] Although stock pricevolatility demonstrates a strong positive correlation with <strong>the</strong> DLOM, it is not a measurablevariable for <strong>the</strong> stock of private companies, and it is <strong>the</strong>refore not used <strong>in</strong> <strong>the</strong> determ<strong>in</strong>ation ofDLOM’s for private companies. <strong>Stock</strong> price volatility, however, should be considered <strong>in</strong>determ<strong>in</strong><strong>in</strong>g discounts for restricted stock <strong>in</strong> publicly traded companies.<strong>The</strong> data <strong>in</strong> <strong>the</strong> <strong>FMV</strong> <strong>Study</strong> is sorted <strong>in</strong>to various percentile groups (five qu<strong>in</strong>tiles as well as a topand bottom decile) for each of <strong>the</strong> above parameters, and <strong>the</strong> median discount for each group iscomputed. <strong>The</strong> subject entity is <strong>the</strong>n compared with <strong>the</strong> data for each parameter to see <strong>in</strong> which13
qu<strong>in</strong>tile/decile group it belongs. <strong>The</strong> median discount for <strong>the</strong> qu<strong>in</strong>tile/decile group <strong>in</strong> which <strong>the</strong>subject entity falls provides one <strong>in</strong>dication of <strong>the</strong> appropriate restricted stock equivalentdiscount. <strong>The</strong> table below provides an example of this analysis with respect to <strong>the</strong> total assetsvariable.As shown <strong>in</strong> <strong>the</strong> schedule below, <strong>the</strong> weighted average of <strong>the</strong> discount <strong>in</strong>dications for all of <strong>the</strong>valuation parameters is <strong>the</strong>n computed, where <strong>the</strong> selection of weights is based on which factorstend to be <strong>the</strong> most important determ<strong>in</strong>ants of <strong>the</strong> DLOM. As mentioned previously, <strong>in</strong> mostcases <strong>the</strong> key variables are considered to be market value, total assets, MTB ratio and netprofit marg<strong>in</strong>. However <strong>the</strong> weights applied <strong>in</strong> any particular case may vary based on <strong>the</strong>specific facts and circumstances surround<strong>in</strong>g <strong>the</strong> subject company and <strong>the</strong> subject <strong>in</strong>terest be<strong>in</strong>gvalued. This analysis is presented as follows:In addition to <strong>the</strong> discount <strong>in</strong>dication provided by <strong>the</strong> above analysis, we perform an additionalanalysis which <strong>in</strong>volves identify<strong>in</strong>g companies <strong>in</strong> <strong>the</strong> <strong>FMV</strong> <strong>Study</strong> that are comparable to <strong>the</strong>subject private company across a number of <strong>the</strong> key variables. Aga<strong>in</strong>, we base this analysis onsmall-block transactions only. Sub-samples of <strong>FMV</strong> <strong>Study</strong> transactions are created us<strong>in</strong>g <strong>the</strong>follow<strong>in</strong>g methodology:14
• Each transaction <strong>in</strong> <strong>the</strong> <strong>FMV</strong> <strong>Study</strong> is analyzed to see if <strong>the</strong> issu<strong>in</strong>g entity is a matchwith <strong>the</strong> subject company across <strong>the</strong> four key variables: market value, total assets,MTB ratio, and net profit marg<strong>in</strong>. An “exact match” on any particular variable isdef<strong>in</strong>ed as <strong>the</strong> issu<strong>in</strong>g entity <strong>in</strong> <strong>the</strong> <strong>FMV</strong> <strong>Study</strong> be<strong>in</strong>g <strong>in</strong> <strong>the</strong> same qu<strong>in</strong>tile group as <strong>the</strong>subject company for that variable. A “close match” on any particular variable isdef<strong>in</strong>ed as <strong>the</strong> issu<strong>in</strong>g entity <strong>in</strong> <strong>the</strong> <strong>FMV</strong> <strong>Study</strong> be<strong>in</strong>g <strong>in</strong> <strong>the</strong> same, or an adjacent,qu<strong>in</strong>tile group as <strong>the</strong> subject company for that variable.• Four sub-samples of companies are <strong>the</strong>n constructed, two with companies that arematches (exact matches for one sub-sample and close matches for <strong>the</strong> second) on allfour key variables and two with companies that are matches (aga<strong>in</strong>, exact matches forone sub-sample and close matches for <strong>the</strong> second) on any three of <strong>the</strong> four keyvariables.<strong>The</strong> median discounts for each of <strong>the</strong> sub-samples are computed, which provide additional<strong>in</strong>dications for <strong>the</strong> appropriate restricted stock equivalent discount for <strong>the</strong> subject company. Inthis analysis, particular attention should be given to <strong>the</strong> number of transactions <strong>in</strong>cluded <strong>in</strong> eachsample. Generally, depend<strong>in</strong>g on <strong>the</strong> sufficiency of <strong>the</strong> number of transactions, greatest weightshould given to <strong>the</strong> discount <strong>in</strong>dications from <strong>the</strong> “4-Exact” matches sub-sample, and lesserweight should be given to <strong>the</strong> “3-Exact” matches and <strong>the</strong> two “Close” matches sub-samples. <strong>The</strong>results of this analysis when performed of ABC Corp. are presented as follows:<strong>The</strong> restricted stock equivalent discount for <strong>the</strong> subject entity is selected giv<strong>in</strong>g consideration toeach of <strong>the</strong> <strong>in</strong>dications from <strong>the</strong> two analyses described above. In <strong>the</strong> case of ABC Corp., aconservative estimate of <strong>the</strong> restricted stock equivalent discount would be 20 percent.Private Equity Discount<strong>The</strong> restricted stock equivalent discount represents <strong>the</strong> discount appropriate for a public companyissu<strong>in</strong>g a small block of restricted stock that will ultimately have access to a public trad<strong>in</strong>gmarket. Interests <strong>in</strong> privately held entities are generally subject to a greater level of illiquidity,more similar to that associated with <strong>the</strong> largest blocks of restricted stock <strong>in</strong> public companies.<strong>The</strong> next step <strong>the</strong>n is to determ<strong>in</strong>e <strong>the</strong> appropriate total discount for lack of marketability for an<strong>in</strong>terest <strong>in</strong> a private company by apply<strong>in</strong>g <strong>the</strong> aforementioned range of private equity adjustmentfactors (see“Indicated Private Equity Adjustment Factor Range” on p. 9) to <strong>the</strong> restricted stockequivalent discount, which yields a range for <strong>the</strong> total marketability discount applicable toprivate equity (before consideration of broader market risks and any o<strong>the</strong>r applicable specialfactors). <strong>The</strong> appropriate private equity discount is selected from this range, giv<strong>in</strong>g15
consideration to all of <strong>the</strong> available data. For most valuations, absent strong arguments to <strong>the</strong>contrary, <strong>the</strong> private equity discount for <strong>the</strong> subject entity is likely to be drawn from <strong>the</strong> middleof this range. <strong>The</strong> follow<strong>in</strong>g illustrates <strong>the</strong> application of this analysis to <strong>the</strong> Subject Interest <strong>in</strong>ABC Corp.Apply<strong>in</strong>g <strong>the</strong> range of additive and multiplicative private equity adjustment factors to <strong>the</strong> 20percent restricted stock equivalent discount provides an <strong>in</strong>dicated private equity discount rangeof between 30 and 47 percent. Given that <strong>the</strong>re are no unusual circumstances surround<strong>in</strong>g an<strong>in</strong>vestment <strong>in</strong> <strong>the</strong> Subject Interest, such as contractual restrictions on resale, <strong>in</strong> this case we selecta private equity discount of 40 percent, or approximately <strong>the</strong> mid-po<strong>in</strong>t of <strong>the</strong> <strong>in</strong>dicated range.Market Volatility AdjustmentHav<strong>in</strong>g determ<strong>in</strong>ed <strong>the</strong> private equity discount, which is based on <strong>the</strong> specific risk and liquiditycharacteristics of ABC Corp. and <strong>the</strong> Subject Interest, <strong>the</strong> next step is to determ<strong>in</strong>e <strong>the</strong>appropriate market volatility adjustment. In order to make an appropriate comparison with <strong>the</strong>market volatility variable <strong>in</strong>cluded for each transaction <strong>in</strong> <strong>the</strong> <strong>FMV</strong> <strong>Study</strong>, <strong>the</strong> trail<strong>in</strong>g 6-monthaverage daily VIX clos<strong>in</strong>g value as of a given valuation date is compared to <strong>the</strong> VIX values fortransactions with<strong>in</strong> <strong>the</strong> <strong>FMV</strong> <strong>Study</strong>. If <strong>the</strong> calculated VIX value falls with<strong>in</strong> <strong>the</strong> top decile, topqu<strong>in</strong>tile, or second qu<strong>in</strong>tile of transactions <strong>in</strong> <strong>the</strong> <strong>FMV</strong> <strong>Study</strong>, <strong>the</strong> <strong>in</strong>dicated adjustment factorsmay be applied to <strong>the</strong> private equity discount to calculate <strong>the</strong> market volatility adjustment. <strong>The</strong>application of <strong>the</strong> market volatility adjustment for <strong>the</strong> Subject Interest <strong>in</strong> ABC Corp. is illustratedas follows:16
VIX 6-Month AverageMultiplicativeMedian AdjustmentLow Median High Discount FactorTop Decile 28.5 29.7 32.9 32.1% 1.47Top Qu<strong>in</strong>tile 26.1 28.5 32.9 26.9% 1.23Second Qu<strong>in</strong>tile 23.9 24.6 26.1 24.4% 1.12Sample Median 11.7 22.5 32.9 21.8% 0.00Selected Market Volatility Adjustment FactorTrail<strong>in</strong>g 6-Month Average VIX as of Valuation Date 41.83Indicated Multiplicative Adjustment Factor 1.47Selected Market Volatility Adjustment Factor 1.50<strong>The</strong> trail<strong>in</strong>g 6-month average daily VIX clos<strong>in</strong>g value is 41.83, which lies above <strong>the</strong> high end of<strong>the</strong> data <strong>in</strong> <strong>the</strong> <strong>FMV</strong> <strong>Study</strong>. In this case, we conservatively select a 1.5 times multiplicativeadjustment factor based on <strong>the</strong> top decile <strong>in</strong>dication. However, arguments could reasonably bemade to select a greater adjustment factor. Given <strong>the</strong> empirically observed relationship betweenrestricted stock discounts and market volatility, dur<strong>in</strong>g certa<strong>in</strong> time periods when extremevolatility is present, it may be appropriate to apply adjustment factors <strong>in</strong> excess of those<strong>in</strong>dicated by <strong>the</strong> top decile. For example, due to <strong>the</strong> collapse of credit markets stemm<strong>in</strong>g from<strong>the</strong> mortgage crisis, and compounded by rapidly decl<strong>in</strong><strong>in</strong>g economic conditions <strong>in</strong> <strong>the</strong> U.S. andabroad, on October 24, 2008 <strong>the</strong> VIX reached a record level of nearly 90, reflect<strong>in</strong>gunprecedented expectations of future volatility. Given that <strong>the</strong> median VIX value <strong>in</strong> <strong>the</strong> topdecile of <strong>the</strong> <strong>FMV</strong> <strong>Study</strong> is 29.7, <strong>the</strong> <strong>in</strong>dicated adjustment factors would not appropriately take<strong>in</strong>to consideration this unique period <strong>in</strong> history. Apply<strong>in</strong>g <strong>the</strong> 1.5 times adjustment factor to <strong>the</strong>private equity discount of 40 percent results <strong>in</strong> a total discount <strong>in</strong>dication of 60 percent.Selected Private Equity Discount 40.0%Times: Market Volatility Adjustment Factor 1.50Indicated Total Discount for Lack of Marketability 60.0%Discount ConclusionF<strong>in</strong>ally, any specific facts or circumstances surround<strong>in</strong>g <strong>the</strong> <strong>in</strong>terest be<strong>in</strong>g valued must beconsidered <strong>in</strong> reach<strong>in</strong>g a conclusion for <strong>the</strong> discount for lack of marketability. <strong>The</strong>se may<strong>in</strong>clude attributes such as contractual restrictions on transfer, right of first refusal, high levels ofcash distributions, or <strong>the</strong> probability of a sale of <strong>the</strong> subject entity. In <strong>the</strong> case of ABC Corp. and<strong>the</strong> Subject Interest, <strong>the</strong>re are no significant additional factors that would warrant an adjustmentto <strong>the</strong> 60 percent total discount arrived at above.17