CONTROL PREMIUM STUDY 3RD QUARTER 2011 - BVMarketData
CONTROL PREMIUM STUDY 3RD QUARTER 2011 - BVMarketData
CONTROL PREMIUM STUDY 3RD QUARTER 2011 - BVMarketData
- No tags were found...

You also want an ePaper? Increase the reach of your titles
YUMPU automatically turns print PDFs into web optimized ePapers that Google loves.
<strong>CONTROL</strong> <strong>PREMIUM</strong> <strong>STUDY</strong><strong>3RD</strong> <strong>QUARTER</strong> <strong>2011</strong>One Gateway Center, Suite 220Newark, NJ 07102(973) 849-2400www.factset.com
Copyright © 2012, FactSet Mergerstat, LLC. All rights reserved. Subscription: Contact Business Valuation Resources at(888) 287-8258. For additional information about Mergerstat or our services, please visit our web site atwww.mergerstat.com. It is illegal under Federal copyright law to reproduce this publication or any portion of its contentswithout the publisher’s permission. Media: Media quotation with source attribution is encouraged. Reporters requestingadditional information or editorial comment should contact Tayo Olatoyan at (973) 849-2420. Mergerstat gathers its datafrom sources it considers reliable; however, it does not guarantee the accuracy or completeness of the information providedwithin this publication.
Mergerstat Control Premium Study3rd Quarter <strong>2011</strong>Table of ContentsPageAbout the Control Premium Study .........................................................................................iiControl Premium Analytics ...................................................................................................... 1Control Premium Comparative Results .................................................................................. 212-Month Median Premiums by Industry .............................................................................. 3Premiums vs. S&P 500 Index ................................................................................................... 43rd Quarter <strong>2011</strong> Summary Statistics ..................................................................................... 512-Month Summary Figures .................................................................................................... 5Control Premiums by Industry ................................................................................................ 6Transaction InformationTarget Name and SIC Number (Domestic)........................................................................... 28Target Name and SIC Number (International) .................................................................... 30Announce & Closing Dates, Total Deal Value (Domestic) ................................................. 34Announce & Closing Dates, Total Deal Value (International) ............................................ 36Purchase Price/Share – Mergerstat Unaffected Price (Domestic)......................................... 40Purchase Price/Share – Mergerstat Unaffected Price (International) .................................. 42Mergerstat Unaffected Control Premium (Domestic)........................................................... 46Mergerstat Unaffected Control Premium (International) ..................................................... 50Target Financials (Domestic)................................................................................................ 57Target Financials (International)........................................................................................... 59Target Multiples (Domestic)................................................................................................. 63Target Multiples (International)............................................................................................ 67Target Demographics (Domestic) ........................................................................................ 74Target Demographics (International) ................................................................................... 76Company DescriptionsDomestic .............................................................................................................................. 80International ......................................................................................................................... 83Standard Industry Classification (SIC) Summary ................................................................ 89Description of Terms ................................................................................................................ 91Copyright © 2012, FactSet Mergerstat, LLC. All rights reserved.i
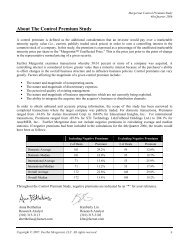
Mergerstat Control Premium Study3rd Quarter <strong>2011</strong>About The Control Premium StudyA control premium is defined as the additional consideration that an investor would pay over a marketableminority equity value (i.e., current, publicly traded stock prices) in order to own a controlling interest in thecommon stock of a company. In this study, the premium is expressed as a percentage of the unaffected marketableminority price per share or the “Mergerstat Unaffected Price.” This is the price just prior to the point of changein the representative normal pricing of a given security.Mergerstat examines transactions whereby 50.01 percent or more of a company was acquired. A controllinginterest is considered to have greater value than a minority interest because of the purchaser’s ability to effectchanges in the overall business structure and to influence business policies. Control premiums can vary greatly.Factors affecting the magnitude of a given control premium include:• The nature and magnitude of nonoperating assets.• The nature and magnitude of discretionary expenses.• The perceived quality of existing management.• The nature and magnitude of business opportunities which are not currently being exploited.• The ability to integrate the acquiree into the acquirer’s business or distribution channels.In order to obtain unbiased and accurate pricing information, the scope of this study has been narrowed tocompleted transactions where the target company was publicly traded. For domestic transactions, Premiumsranged from -35.7% for K-Sea Transportation Partners LP to 295.0% for Vaughan Foods, Inc.. For internationaltransactions, Premiums ranged from -52.9% for Henkel AG & Co. KGaA (Henkel India Ltd.) to 226.9% foriSOFT Group Ltd.. Mergerstat does not include negative premiums in calculating average and median statistics.If negative premiums had been included in the calculations for the 3rd Quarter <strong>2011</strong>, the results would have beenas follows:Including Negative PremiumsExcluding Negative Premiums# of Deals Premium # of Deals PremiumDomestic Average 45 38.3% 40 45.0%Domestic Median 45 30.2% 40 34.1%International Average 107 36.3% 97 42.9%International Median 107 33.2% 97 36.1%Overall Average 152 36.9% 137 43.5%Overall Median 152 31.6% 137 35.5%Throughout the Control Premium Study, negative premiums are indicated by an “*” for your reference.Jennifer HarikrishinSenior Research Analyst(973) 849-2419jharikrishin@factset.comTayo OlatoyanManager, M&A(973) 849-2420tolatoyan@factset.comCopyright © 2012, FactSet Mergerstat, LLC. All rights reserved.ii
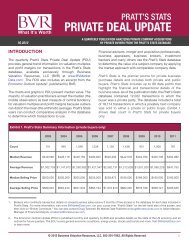
Mergerstat Control Premium Study3rd Quarter <strong>2011</strong>Control Premium Analytics *OverallPremium80%# of Deals Average MedianDeals24070%20060%50%16040%12030%8020%10%400%3Q06 4Q06 1Q07 2Q07 3Q07 4Q07 1Q08 2Q08 3Q08 4Q08 1Q09 2Q09 3Q09 4Q09 1Q10 2Q10 3Q10 4Q10 1Q11 2Q11 3Q110DomesticInternational80% PremiumDeals20070%PremiumDeals14070%17560%12060%50%40%30%20%150125100755050%40%30%20%10080604010%2510%200%3Q09 4Q09# of1Q10Deals2Q10 3Q10Average4Q10 1Q11 2Q11Median3Q1100%3Q09 4Q09# of 1Q10 Deals 2Q10 3Q10 Average 4Q10 1Q11 2Q11 Median 3Q1103Q11Latest Twelve MonthsInternational57%International57%Domestic43%Domestic43%* Average and median calculations exclude negative premiumsCopyright © 2012, FactSet Mergerstat, LLC. All rights reserved. 1
Mergerstat Control Premium Study3rd Quarter <strong>2011</strong>Control Premium Study Results *ControlPremiumMERGERSTAT<strong>CONTROL</strong> <strong>PREMIUM</strong> <strong>STUDY</strong>COMPARATIVE RESULTS45% 12-Month Median 3-Month Median Transactions40%35%30%25%20%15%10%5%0%3Q08 4Q08 1Q09 2Q09 3Q09 4Q09 1Q10 2Q10 3Q10 4Q10 1Q11 2Q11 3Q1112-Month Median 27% 31% 34% 38% 41% 44% 41% 38% 36% 36% 35% 34% 35%3-Month Median 30% 34% 45% 56% 41% 38% 40% 32% 34% 39% 34% 31% 35%Transactions 181 155 100 95 124 128 92 106 134 177 145 186 152Percentages are rounded.* Median calculations excludes negative premiumsCopyright © 2012, FactSet Mergerstat, LLC. All rights reserved. 2
Mergerstat Control Premium Study3rd Quarter <strong>2011</strong>12-Month Median Premiums by Industry*MERGERSTAT<strong>CONTROL</strong> <strong>PREMIUM</strong> <strong>STUDY</strong>12-MONTH MEDIAN <strong>PREMIUM</strong>S BY INDUSTRY60%40%20%0%Agri Mining Const Mfg Trans Comm Elec & Whsle Retail Fin Svs ServicesGasMedian Premium 54% 41% 23% 33% 50% 28% 31% 37% 33% 31% 38%No. of Transactions 4 75 7 202 19 15 9 29 31 124 145For the 12 months ended Sept. 31, <strong>2011</strong>.<strong>2011</strong> 2010 2009Quarter3-MonthMedianPremiumNo. ofTrans.12-MonthMedianPremium3-MonthMedianPremiumNo. ofTrans.12-MonthMedianPremium3-MonthMedianPremiumNo. ofTrans.12-MonthMedianPremiumFirst 34.1% 145 34.7% 39.6% 92 40.8% 45.4% 100 33.9%Second 30.9% 186 33.8% 32.4% 106 37.9% 55.8% 95 37.9%Third 35.5% 152 34.8% 33.7% 134 35.8% 41.3% 124 41.5%Fourth 38.9% 177 36.0% 38.2% 128 43.7%The 12-month median premiums were gathered from transactions occurring within a trailing 12-month period, whereas the 3-month medianpremiums represent similar analyses for a 3-month period.* Median calculations excludes negative premiums.Copyright © 2012, FactSet Mergerstat, LLC. All rights reserved. 3
Mergerstat Control Premium Study3rd Quarter <strong>2011</strong>Premiums vs. S&P 500 Index *MERGERSTAT<strong>CONTROL</strong> <strong>PREMIUM</strong> <strong>STUDY</strong><strong>PREMIUM</strong>S VS. S&P 500 INDEX* Excludes negative premiums.Copyright © 2012, FactSet Mergerstat, LLC. All rights reserved. 4
Mergerstat Control Premium Study3rd Quarter <strong>2011</strong>Summary Statistics<strong>3RD</strong> <strong>QUARTER</strong> <strong>2011</strong>Domestic TransactionsNumber of Transactions 45Range -35.7% to 295.0%Median* 34.1%Average* 45.0%International TransactionsNumber of Transactions 107Range -52.9% to 226.9%Median* 36.1%Average* 42.9%Domestic and International TransactionsNumber of Transactions 152Range -52.9% to 295.0%Median* 35.5%Average* 43.5%12-MONTH SUMMARY FIGURES (10/01/10 TO 09/30/11)Number of Transactions 660Range -81.5% to 1532.5%Median* 34.8%Average* 46.8%* Excludes negative premiums.Copyright © 2012, FactSet Mergerstat, LLC. All rights reserved. 5
Mergerstat Control Premium Study3rd Quarter <strong>2011</strong>Control Premiums by Industry – Trailing 12 MonthsSIC Target Closing Mergerstat UnaffectedCode Category Date Target Name Control Premium01-09 Agriculture and Forestry10-14 MiningRange = 22.7% to 295.0% Median = 54.4% Average = 106.6%0179 09/16/11 Vaughan Foods, Inc. 295.0%0241 02/03/11 Wimm-Bill-Dann Foods OJSC 79.9%0721 11/30/10 Kurnia Setia Bhd. 22.7%0742 11/01/10 Pet DRx Corp. 28.8%Range = 5.8% to 203.0% Median = 40.5% Average = 47.6%10 Metal MiningRange = 9.0% to 203.0% Median = 49.5% Average = 60.3%1011 08/12/11 Territory Resources Ltd. 203.0%1011 05/12/11 Consolidated Thompson Iron Mines Ltd. 30.5%1021 06/17/11 Far West Mining Ltd. -12.8%*1021 04/13/11 Stuart Petroleum Ltd. 50.0%1021 03/04/11 Straits Resources Ltd. /Old/ -11.3%*1031 03/15/11 Farallon Mining Ltd. 23.1%1041 06/10/11 Jabiru Metals Ltd. 13.8%1041 08/16/11 Goldstone Resources, Inc. 50.3%1041 04/08/11 Capital Gold Corp. 68.1%1041 02/07/11 Dominion Mining Ltd. 9.0%1041 06/27/11 Simmer & Jack Mines Ltd. -26.6%*1041 06/13/11 Medoro Resources Ltd. 36.7%1041 01/06/11 Citadel Resource Group Ltd. 27.1%1041 05/19/11 Anchor Resources Ltd. 90.6%1041 04/19/11 Aragon Resources Ltd. 27.7%1041 02/04/11 Avoca Resources Ltd. -0.7%*1041 02/16/11 Laguna Resources NL 26.7%1041 03/01/11 Giralia Resources NL 93.1%1041 12/16/10 Golden Goose Resources, Inc. 56.2%1041 12/14/10 Globestar Mining Corp. 29.9%1041 10/08/10 Shield Mining Ltd. 159.0%1041 11/05/10 NGM Resources Ltd. 93.0%1061 12/09/10 Andean Resources Ltd. 69.2%1081 11/12/10 Ammtec Ltd. 49.1%* Not used in range, average and median calculations.Copyright © 2012, FactSet Mergerstat, LLC. All rights reserved. 6
Mergerstat Control Premium Study3rd Quarter <strong>2011</strong>12 Coal MiningRange = 9.4% to 90.5% Median = 36.8% Average = 38.4%1221 06/28/11 PT Bumi Resources Tbk 10.7%1221 06/01/11 Alpha Appalachia Holdings, Inc. 41.0%1222 03/11/11 Penn Virginia GP Holdings LP 9.4%1222 09/29/11 Northern Energy Corp. Ltd. 90.5%1222 08/26/11 Caledon Resources PLC 33.3%1222 06/17/11 Tata Steel Ltd. (Riversdale Mining Ltd.) 17.0%1222 04/01/11 Western Coal Corp. 55.8%1222 12/16/10 National Coal Corp. 53.8%1222 10/13/10 Centennial Coal Co. Ltd. 40.3%1241 06/15/11 International Coal Group, Inc. 32.4%13 Oil and Gas ExtractionRange = 5.8% to 100.0% Median = 35.1% Average = 40.7%1311 04/12/11 Cirrus Energy Corp. 7.5%1311 08/26/11 Petrohawk Energy Corp. 61.9%1311 04/13/11 NGAS Resources, Inc. 55.6%1311 08/04/11 Torque Energy, Inc. 56.3%1311 03/18/11 Petrolifera Petroleum Ltd. 34.4%1311 05/03/11 NuLoch Resources, Inc. 15.9%1311 02/18/11 Atlas Energy, Inc. 20.6%1311 06/02/11 Sharon Energy Ltd. 0.0% *1311 01/25/11 Pinnacle Gas Resources, Inc. 28.3%1311 06/01/11 Spartan Exploration Ltd. -29.2%*1311 11/23/10 North Peace Energy Corp. 89.8%1311 11/22/10 EPCO, Inc. (Enterprise GP Holdings LP) 28.3%1311 10/11/10 Mosaic Oil NL 92.3%1311 11/10/10 Mariner Energy, Inc. 46.7%1311 11/08/10 Stratic Energy Corp. 100.0%1311 11/04/10 Bronco Energy Ltd. 21.1%1311 10/01/10 UTS Energy Corp. 46.0%1381 07/12/11 Cinch Energy Corp. 64.0%1381 06/11/11 Ember Resources, Inc. 11.1%1381 06/10/11 Peak Energy Services Ltd. 28.4%1381 06/10/11 Stoneham Drilling Trust 40.5%1381 06/07/11 Bronco Drilling Co., Inc. 5.8%1381 05/31/11 Pride International, Inc. 20.4%1381 05/31/11 ProspEx Resources Ltd. 17.1%1381 05/31/11 Technicoil Corp. -12.4%*1381 04/14/11 Petro Uno Resources Ltd. -9.0%*1381 03/01/11 Impress Energy Ltd. 9.0%1381 10/28/10 Dana Petroleum PLC 58.6%1381 10/27/10 OMNI Energy Services Corp. 29.7%1381 11/09/10 Excelsior Energy Ltd. 14.5%Copyright © 2012, FactSet Mergerstat, LLC. All rights reserved. 7
Mergerstat Control Premium Study3rd Quarter <strong>2011</strong>13 Oil and Gas Extraction (continued)1381 10/07/10 Black Marlin Energy Holdings Ltd. 88.1%1381 11/05/10 Great Plains Exploration, Inc. 44.9%1382 07/28/11 Culane Energy Corp. 35.7%1382 06/30/11 Sprott Resource Corp. (Orion Oil & Gas Corp.) -18.1%*1382 01/25/11 Interlink Petroleum Ltd. -15.3%*1382 12/20/10 American Oil & Gas, Inc. 53.9%1389 01/07/11 Subsea 7, Inc. 66.8%1389 08/03/11 KS Energy Ltd. 10.9%14 Mining and Quarrying of Nonmetallic Minerals, Except FuelsRange = 42.7% to 113.6% Median = 44.2% Average = 66.9%1411 08/31/11 Dundee Corp. (Breakwater Resources Ltd.) 44.2%1481 11/24/10 North Queensland Metals Ltd. 113.6%1499 07/19/11 Equinox Minerals Ltd. 42.7%15-17 ConstructionRange = 0.0% to 74.4% Median = 23.0% Average = 26.2%15 Building Construction1522 09/08/11 Forever Prosperous Pte Ltd. (PT Royal Oak0.0%Development Asia Tbk)1542 08/18/11 Sunway Holdings Bhd. 15.6%16 Heavy Construction1623 10/01/10 Tsuken Corp. 30.8%1629 02/15/11 Todd Shipyards Corp. 6.0%17 Construction - Special Trade ContractorsRange = 30.4% to 74.4% Median = 52.4% Average = 52.4%1711 04/21/11 Eaga PLC 30.4%1731 07/05/11 EnergyConnect Group, Inc. 74.4%1731 10/01/10 Todentsu Corp. -17.2%*Copyright © 2012, FactSet Mergerstat, LLC. All rights reserved. 8
Mergerstat Control Premium Study3rd Quarter <strong>2011</strong>20-39 ManufacturingRange = 0.2% to 175.3% Median = 33.4% Average = 41.7%20 Food and Kindred ProductsRange = 0.3% to 148.4% Median = 32.1% Average = 42.4%2023 07/08/11 Parmalat SpA 12.5%2026 11/04/10 Kotmale Holdings PLC 0.3%2032 06/20/11 Cofigéo SA 1.3%2033 03/08/11 Del Monte Foods Co. 20.9%2037 08/19/11 Charlie's Group Ltd. 57.1%2038 05/20/11 Brossard SA 82.6%2046 01/28/11 PT AKR Corporindo Tbk (PT Sorini Agro Asia 6.9%Corp. Tbk)2051 05/25/11 Tasty Baking Co. 148.4%2064 09/07/11 Government of Serbia (Paracinka AD) 53.2%2075 12/01/10 People's Food Holdings Ltd. (Pine Agritech Ltd.) 11.4%2076 07/06/11 Frankland River Olive Co. Ltd. 50.0%2085 05/13/11 Pioneer Distilleries Ltd. 53.5%2085 12/27/10 Balaji Distilleries Ltd. 100.7%2086 01/24/11 Gold Pak Co., Ltd. 40.3%2086 06/01/11 Grupo Continental, SAB 19.6%2099 05/16/11 Danisco A/S 32.1%2099 12/20/10 OK Food Industry Co., Ltd. 30.9%22 Textile Mill ProductsRange = 14.3% to 14.3% Median = 14.3% Average = 14.3%2221 08/01/11 Kawashima Selkon Textiles Co., Ltd. 14.3%2297 05/11/11 Finta Technologies SA (Tharreau Industries SA) -9.1%*2297 01/28/11 MatlinPatterson Global Advisers LLC (PolymerGroup, Inc.)-19.3%*23 ApparelRange = 3.4% to 43.4% Median = 15.5% Average = 19.3%2326 05/05/11 Greatwood Investment Trading Ltd. / Respected 3.4%International Ltd. (Carry Wealth Holdings)2331 06/30/11 Gruppo Coin SpA -3.9%*2331 06/01/11 Sanei-International Co., Ltd. 10.1%2335 06/24/11 Volcom, Inc. 24.2%2389 09/13/11 Timberland Co. 43.4%2389 03/07/11 J. Crew Group, Inc. 15.5%2389 01/17/11 Hing Yiap Group Bhd. -14.8%*2389 08/01/11 Orient Garments Ltd. -37.0%*Copyright © 2012, FactSet Mergerstat, LLC. All rights reserved. 9
Mergerstat Control Premium Study3rd Quarter <strong>2011</strong>24-26 Lumber, Furniture and PaperRange = 12.0% to 73.5% Median = 38.0% Average = 37.7%2411 06/29/11 TimberWest Forest Corp. 19.5%2448 04/01/11 IFCO Systems NV 20.0%2519 06/10/11 Hero Talent Investments Ltd. / Excel Strength -26.5%*Investments Ltd. / Willhero Investments Ltd.(JF Household Furnishings Ltd.)2653 08/10/11 HPI Resources Bhd. 12.0%2653 05/27/11 Smurfit-Stone Container Corp. 49.4%2673 11/16/10 Pactiv Corp. 38.7%2676 12/27/10 Cellu Tissue Holdings, Inc. 51.3%2678 09/28/11 Camlin Ltd. 37.2%2679 10/22/10 Le Crédit Lyonnais SA (Otor SA) 73.5%27 Printing, Publishing and Allied IndustriesRange = 1.1% to 69.5% Median = 62.1% Average = 42.4%2721 07/13/11 KKR & Co. LP (PRIMEDIA, Inc.) 62.1%2721 05/20/11 Independent Media Distribution Ltd. 13.8%2731 12/28/10 Gentosha, Inc. 69.5%2741 02/04/11 CHRYSALIS PLC 1.1%2741 11/24/10 Bowne & Co., Inc. 65.5%28 Chemicals and Allied ProductsRange = 3.7% to 160.0% Median = 32.1% Average = 41.8%2812 06/16/11 Silvinit JSC 23.6%2819 09/13/11 Rhodia SA 50.0%2819 04/26/11 JPMorgan Chase & Co., Inc. (Süd-Chemie AG) -4.0%*2819 03/21/11 Qinghai Salt Lake Industry Group Co. Ltd. -35.7%*2821 09/08/11 Blackstone Group LP (Graham Packaging Co., 52.6%Inc.)2821 09/07/11 Nippon Kagaku Yakin Co., Ltd. 42.9%2821 10/15/10 IPL, Inc. 18.2%2833 10/01/10 NBTY, Inc. 46.8%2834 02/11/11 Eurand NV 9.4%2834 08/10/11 Solvay SA (Solvay Pharma India Ltd.) -17.6%*2834 08/19/11 AB Invalda / Baltic Pharma Ltd. (Sanitas AB) 83.4%2834 04/08/11 Genzyme Corp. 36.6%2834 06/14/11 ChemGenex Pharmaceuticals Ltd. 59.1%2834 05/23/11 IS Pharma PLC 3.7%2834 05/16/11 Warburg Pincus & Co. (Inspire Pharmaceuticals, 25.6%Inc.)2834 04/05/11 CPEX Pharmaceuticals, Inc. 11.0%2834 03/25/11 Pharmaniaga Bhd. 12.7%Copyright © 2012, FactSet Mergerstat, LLC. All rights reserved. 10
Mergerstat Control Premium Study3rd Quarter <strong>2011</strong>28 Chemicals and Allied Products (continued)2834 02/28/11 King Pharmaceuticals, Inc. 40.4%2834 02/22/11 Crucell NV 57.7%2834 10/12/10 ZymoGenetics, Inc. 77.0%2834 11/16/10 NeutraHealth PLC 20.9%2834 10/28/10 Trubion Pharmaceuticals, Inc. 51.0%2834 10/15/10 Abraxis BioScience, Inc. 19.3%2834 11/04/10 Penwest Pharmaceuticals Co. 18.8%2835 08/19/11 Immucor, Inc. 30.2%2836 08/10/11 Cellestis Ltd. 26.7%2836 02/28/11 Martek Biosciences Corp. 34.8%2836 01/13/11 Cypress Bioscience, Inc. 160.0%2836 06/01/11 Talecris Biotherapeutics Holdings Corp. 102.5%2836 12/06/10 GTC Biotherapeutics, Inc. 7.1%2837 11/09/10 Movetis NV 91.0%2841 08/22/11 Henkel AG & Co. KGaA (Henkel India Ltd.) -52.9%*2844 05/10/11 Alberto-Culver Co. 19.1%2844 12/21/10 Avon Products, Inc. (Avon Products Co. Ltd.) 32.1%2865 11/09/10 Permodalan Nasional Bhd. / Union HarvardInvestment SRL / CGDC Investments Corp.(Titan Chemicals Corp. Bhd.)32.0%29 Petroleum RefiningRange = 18.7% to 63.4% Median = 28.0% Average = 36.7%2911 08/09/11 M. D. Sass Investors Services, Inc. (Sterling 63.4%Chemicals, Inc.)2911 07/01/11 Frontier Oil Corp. 18.7%2992 09/16/11 The Lubrizol Corp. 28.0%30 Rubber and Miscellaneous Plastics ProductsRange = 28.4% to 28.4% Median = 28.4% Average = 28.4%3021 01/05/11 Wonder Star Securities Ltd. / Top Source-36.1%*Securities Ltd. (KTP Holdings Ltd.)3069 06/24/11 Sinomem Technology Ltd. 28.4%3084 05/30/11 Future Advance Holdings Ltd (China Primary -65.2%*Resources Holdings Ltd)3084 04/25/11 Xinjiang Tianye Water Saving Irrigation SystemCo. Ltd.-36.6%*Copyright © 2012, FactSet Mergerstat, LLC. All rights reserved. 11
Mergerstat Control Premium Study3rd Quarter <strong>2011</strong>31 Leather and Leather ProductsRange = 25.0% to 29.7% Median = 27.3% Average = 27.3%3161 09/06/11 Safari Industries (India) Ltd. 29.7%3161 05/17/11 D&P PME IV SAS / Saint Germain Participation 25.0%SARL / Financière Descottes SARL (LeTanneur & Cie)3199 05/23/11 Jackspeed Corp. Ltd. -1.9%*32-33 Stone, Concrete Products and Primary MetalsRange = 23.0% to 92.1% Median = 53.4% Average = 49.6%3241 03/28/11 Hebei Taihang Cement Co. Ltd. 24.0%3253 06/06/11 PT Keramika Indonesia Assosiasi Tbk -1.2%*3253 01/19/11 ASA Group Holdings Ltd. 92.1%3253 12/29/10 Bell Ceramics Ltd. -8.2%*3261 02/22/11 HSBC Holdings PLC (Arnhold Holdings Ltd.) -51.9%*3281 01/20/11 Rock of Ages Corp. 55.6%3313 07/29/11 MagIndustries Corp. 53.4%3357 02/08/11 Draka Holding NV 23.0%34-35 Fabricated Metal Products, Industrial Machinery and ComputersRange = 1.9% to 126.3% Median = 37.7% Average = 42.4%3423 12/23/10 Oglesby & Butler Group 12.9%3432 05/06/11 Crane Group Ltd. 41.1%3469 05/31/11 Lincat Group PLC 37.7%3469 05/16/11 MAP Technology Holdings Ltd. 30.9%3471 03/23/11 Tanaka Galvanizing Co., Ltd. 41.8%3491 03/03/11 Essa Australia Ltd. 32.7%3499 11/10/10 Mount Engineering PLC 47.7%3499 12/02/10 Hawk Corp. 2.0%3511 06/17/11 SunPower Corp. 46.2%3511 12/15/10 Clipper Windpower PLC 31.3%3531 08/16/11 Demag Cranes AG 53.5%3532 07/08/11 Bucyrus International, Inc. 32.1%3533 01/10/11 T-3 Energy Services, Inc. 64.9%3533 11/25/10 Prosafe Production PLC 30.5%3541 02/09/11 Kuraki Co., Ltd. 70.0%3545 05/20/11 Winterthur Technologie AG 6.9%3548 12/03/10 Angelo, Gordon & Co. LP (Thermadyne Holdings 1.9%Corp.)3552 10/01/10 Nihon Spindle Manufacturing Co., Ltd. 4.7%3559 08/22/11 Gerber Scientific, Inc. 35.5%3559 01/26/11 Tinci Holdings Ltd. 126.3%3564 02/22/11 Clyde Process Solutions PLC 14.3%Copyright © 2012, FactSet Mergerstat, LLC. All rights reserved. 12
Mergerstat Control Premium Study3rd Quarter <strong>2011</strong>34-35 Fabricated Metal Products, Industrial Machinery and Computers(continued)3564 11/05/10 Munters AB 46.7%3565 03/22/11 O-M Ltd. 46.7%3569 03/11/11 Microfluidics International Corp. 58.8%3571 05/20/11 Shenzhen Languang Electronic Group Co. Ltd. -54.6%*(Gansu Languang Science & Technology Co.Ltd.)3571 08/04/11 Hypercom Corp. 126.1%3572 02/22/11 Compellent Technologies, Inc. -17.5%*3577 09/26/11 silex technology, Inc. 73.1%3578 08/24/11 Radiant Systems, Inc. 27.6%36 Electrical and Electronic Machinery and EquipmentRange = 0.2% to 175.3% Median = 35.1% Average = 44.2%3613 05/16/11 Technology Research Corp. 84.6%3621 08/26/11 Tognum AG 40.5%3621 01/27/11 Baldor Electric Co. 39.3%3625 08/04/11 elexis AG 20.6%3631 09/01/11 Tong Yang Magic Co., Ltd. 31.1%3633 09/09/11 Paradise Capital Holding Co. (Olympic Group for 35.1%Financial Investments Co.)3633 07/27/11 Schulthess Group AG 28.9%3651 03/14/11 Yokogawa Electric Corp. (Kokusai Chart Corp.) -4.6%*3651 01/27/11 Eastern Asia Technology Ltd. 31.4%3661 05/10/11 Tollgrade Communications, Inc. 0.2%3661 05/31/11 XETA Technologies, Inc. 43.2%3663 09/12/11 Maspro Denkoh Corp. 63.4%3663 09/16/11 China Security & Surveillance Technology, Inc. 33.2%3663 08/22/11 EMS Technologies, Inc. 33.1%3663 06/17/11 Endwave Corp. -2.7%*3663 02/23/11 Occam Networks, Inc. 74.4%3663 01/14/11 CommScope, Inc. 36.2%3663 12/21/10 Japan Radio Co., Ltd. 63.9%3663 12/09/10 ADC Telecommunications, Inc. 44.1%3669 02/11/11 The Cypress Group LLC (CPI International, Inc. 34.8%(California))3669 06/16/11 RAE Systems, Inc. 116.3%3669 05/31/11 AML Communications, Inc. 78.6%3669 01/27/11 Optelecom-NKF, Inc. 54.7%3674 09/23/11 National Semiconductor Corp. 75.7%3674 09/20/11 Zuken, Inc. / Kenny B YK (Chip One Stop, Inc.) 175.3%3674 08/31/11 Zoran Corp. -10.2%*3674 08/29/11 SMART Modular Technologies (WWH), Inc. 13.1%3674 06/28/11 LaBarge, Inc. 10.4%3674 05/24/11 Qualcomm Atheros, Inc. 21.6%Copyright © 2012, FactSet Mergerstat, LLC. All rights reserved. 13
Mergerstat Control Premium Study3rd Quarter <strong>2011</strong>36 Electrical and Electronic Machinery and Equipment (continued)3674 07/05/11 Ignis ASA 58.4%3674 04/19/11 Conexant Systems, Inc. 27.0%3674 07/04/11 Verigy Ltd. 68.4%3674 12/01/10 Microtune, Inc. 18.2%3679 08/16/11 ElektronikGruppen BK AB 31.0%3679 06/21/11 PCI Ltd. 4.2%3679 05/27/11 APW President Systems Ltd. 30.0%3679 03/30/11 Herley Industries, Inc. 15.7%3679 06/01/11 Spectrum Control, Inc. 42.8%3679 11/02/10 Ngai Lik Industrial Holdings Ltd. -81.5%*3679 12/01/10 Cogent, Inc. 17.8%3695 01/28/11 LaserCard Corp. 37.7%37 Transportation EquipmentRange = 5.1% to 90.6% Median = 23.9% Average = 35.1%3714 05/16/11 ICWET LP / Industrie-Beteiligungs-Gesellschaft 49.8%mbH (W.E.T. Automotive Systems AG)3714 01/24/11 Amtek India Ltd. 6.3%3724 05/09/11 Ladish Co., Inc. 90.6%3731 02/18/11 Jaya Holdings Ltd. -27.3%*3743 09/07/11 Delachaux SA 23.9%3743 12/29/10 Portec Rail Products, Inc. 5.1%3751 03/22/11 Honda Motor Co. Ltd. (Hero Honda Motors Ltd.) -54.4%*38 Controlling Instruments; Photographic, Medical and Optical Goods; and ClocksRange = 8.5% to 174.8% Median = 33.7% Average = 45.2%3812 08/31/11 ECT Industries SA 44.8%3812 10/04/10 Wexford Capital LLC (ICx Technologies, Inc.) 11.9%3821 06/30/11 Beckman Coulter, Inc. 11.1%3823 11/15/10 OI Corp. 42.9%3823 12/10/10 Roctest Ltd. 116.8%3825 01/31/11 Applied Signal Technology, Inc. 8.5%3825 12/08/10 Keithley Instruments, Inc. 74.3%3826 05/17/11 Dionex Corp. 20.7%3826 04/13/11 Clinical Data, Inc. -11.5%*3841 09/13/11 Moria SA 13.4%3841 03/08/11 Genoptix, Inc. 26.5%3841 06/27/11 Orthovita, Inc. 41.0%3841 06/17/11 American Medical Systems Holdings, Inc. 34.3%3841 05/17/11 CardioGenesis Corp. 42.8%3841 03/14/11 Siemens AG (Siemens Healthcare Diagnostics 44.4%Ltd.)3841 11/29/10 SSL International PLC 32.8%Copyright © 2012, FactSet Mergerstat, LLC. All rights reserved. 14
Mergerstat Control Premium Study3rd Quarter <strong>2011</strong>38 Controlling Instruments; Photographic, Medical and Optical Goods; andClocks (continued)3841 12/03/10 Cardiac Science Corp. 9.5%3842 02/25/11 Q-Med AB 19.2%3842 11/30/10 Otix Global, Inc. 174.8%3842 11/16/10 Osteotech, Inc. 65.0%3845 06/13/11 Wisconsin Alumni Research Foundation19.0%(TomoTherapy, Inc.)3845 08/05/11 Ophthalmic Imaging Systems, Inc. 13.2%3845 03/03/11 Aloka Co., Ltd. 118.9%3845 12/23/10 Clarient, Inc. 33.7%3845 12/21/10 Biotel, Inc. 84.3%3861 02/14/11 Dalsa Corp. 25.9%39 Miscellaneous ManufacturingRange = 27.2% to 72.8% Median = 38.1% Average = 44.1%3911 06/30/11 Bulgari SpA 72.8%3942 12/27/10 Combi Corp. 46.2%3944 04/29/11 RC2 Corp. 27.2%3999 01/01/11 Abilit Corp. 30.1%40-47 TransportationRange = 8.3% to 105.8% Median = 49.9% Average = 50.9%41 Local and Suburban Transit4119 06/30/11 Rural/Metro Corp. 37.5%4119 05/25/11 Emergency Medical Services Corp. -9.4%*42 Motor Freight Transportation4215 02/23/11 Dynamex, Inc. 63.9%44 Water TransportationRange = 8.3% to 8.3% Median = 8.3% Average = 8.3%4412 09/30/11 Crude Carriers Corp. -17.2%*4449 12/21/10 American Commercial Lines, Inc. -0.9%*4491 07/01/11 K-Sea Transportation Partners LP -35.7%*4499 03/09/11 Actiease Assets Ltd. (Sam Woo Holdings Ltd.) -26.1%*4499 06/02/11 Forth Ports Ltd. 8.3%Copyright © 2012, FactSet Mergerstat, LLC. All rights reserved. 15
Mergerstat Control Premium Study3rd Quarter <strong>2011</strong>45 Air TransportationRange = 65.3% to 105.8% Median = 71.5% Average = 80.9%4512 05/02/11 AirTran Holdings, Inc. 65.3%4512 01/21/11 Iberia Líneas Aéreas de España SA 71.5%4512 11/15/10 ExpressJet Holdings, Inc. 105.8%46 Pipelines4612 02/16/11 Wellstream Holdings PLC 29.1%4613 11/19/10 BGH GP Holdings LLC (Buckeye GP Holdings 49.9%LP)47 Transportation ServicesRange = 13.4% to 100.6% Median = 35.5% Average = 46.0%4725 09/27/11 Holidaybreak PLC 35.5%4731 09/08/11 Sical Logistics Ltd. -9.7%*4731 04/19/11 Vantec Corp. 100.6%4731 12/28/10 Aboitiz Equity Ventures, Inc. (Aboitiz Transport 13.4%System Corp.)4731 10/29/10 Integrated Distribution Services Group Ltd. 56.3%4731 12/03/10 WridgWays Australia Ltd. 24.4%48 CommunicationsRange = 2.5% to 96.1% Median = 27.6% Average = 27.8%4812 01/25/11 Spescom Ltd. (South Africa) 2.5%4812 04/01/11 Qwest Communications International, Inc. 33.5%4812 11/10/10 SpiriTel PLC 13.2%4813 06/08/11 Hughes Communications, Inc. 30.7%4813 07/28/11 Outremer Télécom SA 7.6%4813 01/24/11 Invoice, Inc. 19.0%4813 12/08/10 ITC DeltaCom, Inc. 96.1%4822 07/15/11 SAVVIS, Inc. 9.8%4822 01/25/11 Clever Communications Australia Ltd. 29.4%4832 09/16/11 Citadel Broadcasting Corp. 24.3%4832 04/20/11 Village Roadshow Ltd. (Austereo Group Ltd.) 8.5%4841 03/04/11 Mediacom Communications Corp. 27.6%4899 02/28/11 Arbinet Corp. 33.2%4899 01/13/11 Syniverse Holdings, Inc. 30.3%4899 10/21/10 WIN PLC 51.5%Copyright © 2012, FactSet Mergerstat, LLC. All rights reserved. 16
Mergerstat Control Premium Study3rd Quarter <strong>2011</strong>49 Electric, Gas, and Sanitary ServicesRange = 5.3% to 132.1% Median = 30.9% Average = 42.9%4911 05/12/11 Fundo de Investimento em Participaçoes PCP -0.4%*(Redentor Energia SA)4911 09/21/11 Indian Energy Ltd. 5.3%4911 06/23/11 Société Internationale d'Investissements9.8%Financiers SARL (EDF Energies Nouvelles)4911 05/13/11 Plutonic Power Corp. -16.4%*4911 02/03/11 International Power PLC -69.0%*4911 02/25/11 Allegheny Energy, Inc. 21.1%4911 12/22/10 Maine & Maritimes Corp. 40.6%4911 12/08/10 Prime Infrastructure Group 48.6%4953 04/21/11 Caprius, Inc. 132.1%50-51 Wholesale TradeRange = 0.9% to 182.3% Median = 37.5% Average = 44.9%50 Durable goodsRange = 0.9% to 105.3% Median = 42.1% Average = 42.8%5031 03/10/11 LE Lundbergföretagen AB (Cardo AB) 48.4%5032 06/06/11 PT Kokoh Inti Arebama Tbk 73.5%5045 08/29/11 Icron Technologies Corp. 42.1%5045 11/15/10 Yosun Industrial Corp. 49.0%5045 12/03/10 itX Group Ltd. 40.6%5047 06/08/11 Nishimoto Real Estate KK (ELK Corp.) 72.7%5052 03/14/11 Quadra FNX Mining Ltd. (Gold Wheaton Gold 19.4%Corp.)5063 03/31/11 Galaxy Far East Corp. 0.9%5065 01/03/11 Nu Horizons Electronics Corp. 105.3%5074 12/14/10 The BSS Group PLC 51.5%5088 09/29/11 Satair A/S 23.4%5088 09/26/11 Portek International Ltd. 6.1%5099 06/22/11 Woolite Mercantile Co. Ltd. 24.1%51 Nondurable GoodsRange = 9.8% to 182.3% Median = 35.4% Average = 46.7%5112 05/02/11 CPI Group Ltd. 32.4%5122 06/10/11 Animal Health International, Inc. 11.0%5122 06/16/11 BioPhausia AB 182.3%5122 01/03/11 Provet Holdings Ltd. 35.4%5137 01/11/11 Sazaby League Ltd. 44.0%Copyright © 2012, FactSet Mergerstat, LLC. All rights reserved. 17
Mergerstat Control Premium Study3rd Quarter <strong>2011</strong>51 Nondurable Goods (continued)5137 02/22/11 Justice KK (Image Holdings Co., Ltd.) 10.2%5141 06/20/11 Massmart Holdings Ltd. 9.8%5142 09/23/11 Uniq PLC 28.0%5153 11/19/10 AWB Ltd. 37.0%5159 05/05/11 Pyne Gould Corp. (PGG Wrightson Ltd.) 22.4%5169 10/14/10 Tien Fung Hong Group Ltd. / Deutsche Bank 38.0%International Trust Co. (Cayman) Ltd. (Kee-Shing Holdings Co. Ltd.)5172 02/17/11 Brío de Colombia SA 16.6%5182 03/17/11 Enoteca Co., Ltd. 47.1%5192 09/26/11 Dawson Holdings PLC 109.5%5199 01/07/11 Atlan Holdings Bhd. (DFZ Capital Bhd.) -8.3%*5199 06/27/11 Skor Food Group, Inc. 77.3%52-59 Retail TradeRange = 1.9% to 112.3% Median = 33.2% Average = 38.4%53 General Merchandise StoresRange = 7.4% to 36.7% Median = 20.2% Average = 20.9%5311 08/26/11 Shanghai Bailian Group Co. Ltd. 16.4%5311 07/18/11 Korea Value Asset Management Co., Ltd.23.7%(Hyundai DSF Co., Ltd.)5311 06/22/11 Ideal Shopping Direct Ltd. 20.2%5311 05/26/11 Retail Ventures, Inc. 36.7%5399 09/30/11 BJ's Wholesale Club, Inc. 7.4%55 Automotive Dealers and Gasoline Service Stations5511 12/15/10 Adtrans Group Ltd. 34.9%5571 01/17/11 S.P. Suzuki Public Co. Ltd. 1.9%56 Apparel StoresRange = 23.5% to 77.1% Median = 50.0% Average = 46.3%5611 08/22/11 Goto Co., Ltd. 77.1%5611 08/18/11 Forzani Group Ltd. 50.5%5611 01/31/11 F-One Ltd. 30.4%5621 02/18/11 Stellar Group Co., Ltd. 50.0%5699 11/23/10 The Gymboree Corp. 23.5%Copyright © 2012, FactSet Mergerstat, LLC. All rights reserved. 18
Mergerstat Control Premium Study3rd Quarter <strong>2011</strong>57 Furniture and Equipment Stores5722 06/13/11 Tretti AB 24.5%5734 03/22/11 Culture Convenience Club Co., Ltd. 32.7%58 Eating and Drinking PlacesRange = 10.7% to 80.1% Median = 46.0% Average = 43.6%5812 09/08/11 CAS Capital, Inc. (Kazokutei Co., Ltd.) 46.2%5812 07/07/11 California Pizza Kitchen, Inc. 10.7%5812 02/07/11 Clapham House Group PLC 31.0%5812 10/19/10 Burger King Holdings, Inc. 45.9%5812 11/05/10 Carluccio's PLC 47.9%5813 08/22/11 The Capital Pub Co. PLC 80.1%59 Miscellaneous RetailRange = 17.1% to 112.3% Median = 42.3% Average = 51.2%5912 06/03/11 drugstore.com, Inc. 112.3%5912 10/01/10 Allied Hearts Holdings Co., Ltd. 22.1%5941 09/15/11 Japan Fine Arts KK (Kojitu Co., Ltd.) 17.1%5944 02/28/11 Michael Hill International Ltd. -1.1%*5949 03/18/11 Jo-Ann Stores, Inc. 33.7%5961 06/20/11 GSI Commerce, Inc. 50.9%5984 11/22/10 Royal Dutch Shell PLC (Shell Gas LPG Pakistan) -26.4%*5984 11/05/10 Inergy Holdings LP -3.0%*5999 07/18/11 Liquidation World, Inc. -45.5%*5999 05/04/11 NetOnNet AB -1.0%*5999 02/18/11 Matrixx Initiatives, Inc. 70.9%60-67 Finance, Insurance, and Real EstateRange = 0.3% to 224.0% Median = 31.1% Average = 41.5%60-61 Banking and Credit AgenciesRange = 0.3% to 224.0% Median = 32.3% Average = 45.6%6021 04/12/11 Banco Patagonia SA 9.7%6021 04/11/11 The Wilber Corp. 57.8%6021 07/20/11 Russian Railways OJSC (TransCreditBank JSC) 4.3%6021 05/27/11 Silvio Santos Participaçoes SA (Banco11.4%Panamericano SA)6021 07/05/11 Marshall & Ilsley Corp. 39.7%6021 06/04/11 Whitney Holding Corp. 23.2%6021 01/26/11 AI Jaber Transport & General Contracting LLC(United Bank Ltd.)21.4%Copyright © 2012, FactSet Mergerstat, LLC. All rights reserved. 19
Mergerstat Control Premium Study3rd Quarter <strong>2011</strong>60-61 Banking and Credit Agencies (continued)6021 04/01/11 Mybank Ltd. 164.0%6021 04/01/11 Sumitomo Trust & Banking Co. Ltd. -10.5%*6021 12/29/10 Northeast Bancorp -0.9%*6021 11/26/10 Bilbao Bizkaia Kutxa SA / Caja de Ahorros de -63.6%*Guipúzcoa y San Sebastián (BancoGuipuzcoano SA)6021 11/26/10 Finibanco Holding SGPS SA 54.8%6022 07/28/11 Sterling Bancshares, Inc. 0.3%6022 07/21/11 Legacy Bancorp, Inc. 63.2%6022 05/31/11 Omni Bancshares, Inc. 27.9%6022 05/16/11 Wilmington Trust Corp. -37.6%*6022 03/04/11 Cadence Financial Corp. 53.4%6022 01/03/11 California Oaks State Bank 89.2%6022 01/28/11 Capital Bank Corp. 55.5%6022 03/01/11 First Ipswich Bancorp 224.0%6022 01/01/11 American Community Bancorp, Inc. 65.9%6022 11/30/10 Central Jersey Bancorp 130.6%6022 12/01/10 Smithtown Bancorp, Inc. 3.4%6022 10/01/10 The South Financial Group, Inc. -57.5%*6029 06/30/11 Cascade Financial Corp. -18.2%*6029 04/15/11 IXE Grupo Financiero SA 45.5%6029 04/15/11 NewAlliance Bancshares, Inc. 34.3%6029 03/29/11 Allied Irish Banks PLC (Bank Zachodni WBK 15.2%SA)6029 12/27/10 Mass Financial Corp. -12.5%*6029 12/22/10 Gifu Bank Ltd. -28.8%*6029 10/04/10 Atlas Bank Ltd. 29.0%6035 07/01/11 Danvers Bancorp, Inc. 30.2%6035 04/01/11 Rome Bancorp, Inc. 22.7%6035 12/01/10 LSB Corp. 51.8%6036 07/15/11 GS Financial Corp. 21.7%6036 05/31/11 North Penn Bancorp, Inc. 70.2%6036 03/16/11 First Franklin Corp. 78.8%6141 09/22/11 Siam Industrial Credit Public Co. Ltd. 60.2%6141 02/25/11 United PanAm Financial Corp. 41.0%6141 12/31/10 Citigroup, Inc. (The Student Loan Corp.) 41.8%6141 12/14/10 Rewards Network, Inc. 0.6%6141 10/01/10 AmeriCredit Corp. 24.4%6153 01/05/11 Oriental City Group PLC (Oriental City Group -80.4%*Holdings Ltd.)6159 03/01/11 Siam Commercial Bank Public Co. Ltd.15.4%(Dhanamitr Factoring PCL)6163 05/10/11 Next SRL (Tuscany) (Toscana Finanza SpA) 20.8%6163 12/17/10 Crédit Foncier et Communal d'Alsace et de 27.0%Lorraine SA6197 07/15/11 Yash Trading & Finance Ltd. 2.2%Copyright © 2012, FactSet Mergerstat, LLC. All rights reserved. 20
Mergerstat Control Premium Study3rd Quarter <strong>2011</strong>62 Security and Commodity Brokers and Related ServicesRange = 13.8% to 54.6% Median = 23.6% Average = 26.8%6211 06/10/11 TradeStation Group, Inc. 36.2%6211 05/10/11 Yuanta Securities Asia Financial Services Ltd. 14.8%(Kim Eng Holdings Ltd.)6211 08/31/11 United Securities Public Co., Ltd. 36.1%6211 08/17/11 ATR Holdings, Inc. (Philippines) (ATR KimEng 13.8%Financial Corp.)6211 04/08/11 Hudson Holding Corp. -31.0%*6211 06/28/11 LaBranche & Co., Inc. -5.6%*6211 01/04/11 Barnard Jacobs Mellet Holdings Ltd. 18.1%6211 09/01/11 optionsXpress Holdings, Inc. -17.8%*6211 11/30/10 American Physicians Service Group, Inc. 23.6%6282 04/04/11 Gartmore Group Ltd. 16.9%6282 02/01/11 DundeeWealth, Inc. -1.7%*6282 12/14/10 RISA Partners, Inc. 26.9%6282 10/14/10 GLG Partners, Inc. 54.6%63-64 Insurance Companies and AgentsRange = 5.6% to 81.8% Median = 46.7% Average = 41.5%6311 05/11/11 TOWER Australia Group Ltd. 46.5%6311 08/24/11 Scottish Re Group Ltd. 81.8%6311 03/31/11 Tong Yang Securities, Inc. / Tong Yang Capital 48.1%Co. / Tong Yang Financial Services Corp.(Tong Yang Life Insurance Co. Ltd.)6311 03/30/11 AXA SA (AXA Asia Pacific Holdings Ltd.) 52.5%6321 02/14/11 BNP Paribas SA (Fortis Bank AS) 69.8%6324 10/22/10 American Physicians Capital, Inc. 30.7%6331 08/01/11 Fremont Michigan InsuraCorp, Inc. 35.1%6331 11/23/10 NYMAGIC, Inc. 23.5%6331 10/01/10 PMA Capital Corp. 24.7%6411 09/15/11 CBG Group PLC 54.2%6411 02/09/11 First Mercury Financial Corp. 46.9%6411 04/26/11 Glenrand MIB Ltd. 11.1%6411 03/28/11 Mercer Insurance Group, Inc. 50.9%6411 07/01/11 Chaucer Holdings PLC 5.6%65 Real EstateRange = 3.1% to 55.8% Median = 20.4% Average = 26.6%6531 09/19/11 Minerva PLC 53.5%6531 08/26/11 Valad Property Group 55.8%6531 02/08/11 Realex Properties Corp. 3.1%6531 06/23/11 SonomaWest Holdings, Inc. 20.4%Copyright © 2012, FactSet Mergerstat, LLC. All rights reserved. 21
Mergerstat Control Premium Study3rd Quarter <strong>2011</strong>65 Real Estate (continued)6531 04/05/11 Pangbourne Properties Ltd. -7.4%*6552 08/18/11 Sunway City Bhd. 13.6%6552 07/20/11 OSK Property Holdings Bhd. 9.4%6552 01/07/11 Parkbridge Lifestyle Communities, Inc. 30.4%6552 07/06/11 SIIC Shanghai Holding Co. Ltd. (ShanghaiIndustrial Development Co. Ltd.)-8.5%*67 Holding Companies and Other Investment OfficesRange = 2.7% to 168.7% Median = 33.7% Average = 43.6%6712 04/11/11 Fort Orange Financial Corp. 81.5%6712 05/09/11 Union National Financial Corp. 46.1%6712 08/30/11 Orange Community Bancorp 51.0%6712 01/03/11 Comm Bancorp, Inc. 83.1%6712 07/01/11 MidCarolina Financial Corp. 112.9%6712 01/01/11 Monroe Bancorp 168.7%6712 11/17/10 Atlantic Bancgroup, Inc. -49.1%*6712 12/10/10 First Chester County Corp. 81.5%6719 05/13/11 Watford Leisure PLC 42.9%6719 11/18/10 Welsh, Carson, Anderson & Stowe (AGA41.4%Medical Holdings, Inc.)6722 12/17/10 Pantera Drilling Income Trust 115.8%6726 05/12/11 White Funds Management Pty Ltd. (Sylvastate -3.6%*Ltd.)6726 05/18/11 APG Algemene Pensioen Groep NV (ProLogis 7.8%European Properties)6726 05/18/11 Brompton Equity Split Corp. 6.7%6726 03/29/11 ING Groep NV (ING Industrial Fund) 17.0%6726 06/02/11 SVM UK Active Fund PLC 8.9%6726 02/02/11 Asset Management Investment Co. PLC 9.8%6726 12/17/10 Hyflux Water Trust 13.9%6726 12/16/10 Choiseul Investments Ltd. 2.7%6726 11/16/10 Drive Products Income Fund 92.3%6771 07/26/11 EDT Retail Trust 28.6%6771 08/04/11 OFI Private Equity Capital SCA -13.4%*6771 11/30/10 Intoll Group 36.3%6798 01/07/11 BM Invest SAS (Duc Lamothe Participations SA) 14.6%6798 06/27/11 Rabinov Property Trust 81.3%6798 06/15/11 Nexity SA / Natixis SA / BPCE SA (Eurosic SA) 3.8%6798 06/03/11 ProLogis 3.5%6798 07/01/11 Nationwide Health Properties, Inc. 6.4%6798 10/01/10 Japan Single-residence REIT, Inc. 83.8%6799 09/30/11 Impera Total Return AG 46.5%6799 09/21/11 Pulai Springs Bhd. 31.1%6799 02/09/11 ASTRA Capital Ltd. 47.1%6799 06/22/11 Transfield Services Infrastructure Fund Ltd. 38.2%Copyright © 2012, FactSet Mergerstat, LLC. All rights reserved. 22
Mergerstat Control Premium Study3rd Quarter <strong>2011</strong>67 Holding Companies and Other Investment Offices (continued)6799 07/06/11 SäkI AB 4.4%6799 02/18/11 AH Medical Properties PLC 22.2%6799 12/31/10 Zuni Holdings, Inc. 100.0%6799 12/21/10 Mounteverest Trading & Investment Ltd. 53.4%6799 12/17/10 BlueBay Asset Management PLC 31.1%6799 10/12/10 Natixis SA (Initiative et Finance SA) 4.2%6799 11/16/10 Auximines SA 21.0%6799 11/15/10 PSG Group Ltd. (CIC Holdings Ltd.) 14.8%70-99 Services and OtherRange = 0.0% to 1,532.5% Median = 37.6% Average = 60.4%70 Hotels and Lodging PlacesRange = 17.9% to 100.0% Median = 72.4% Average = 63.4%7011 06/20/11 Oaks Hotels & Resorts Ltd. 100.0%7011 05/16/11 Silverleaf Resorts, Inc. 72.4%7011 12/30/10 The MAC Services Group Ltd. 17.9%7011 12/22/10 Giant Mauritius Holdings / Hotel & PropertyDevelopment Co. Ltd. (Grande Asset Hotels &Property Public Co. Ltd.)-65.5%*73-78 Business ServicesRange = 0.0% to 1,532.5% Median = 37.6% Average = 67.8%7311 05/10/11 Burst Media Corp. PLC 569.5%7311 07/26/11 MediaMind Technologies, Inc. 38.0%7311 03/18/11 Chemistry Communications Group PLC 134.9%7311 11/29/10 IREP Co., Ltd. 38.9%7352 04/01/11 Emergent Group, Inc. 39.6%7361 05/26/11 Fullcast Holdings Co. Ltd. (Fullcast Technology 81.1%Co. Ltd.)7361 03/02/11 Ross Human Directions Ltd. 82.9%7361 12/29/10 COMFORCE Corp. 54.3%7361 10/13/10 Fujistaff Holdings, Inc. 61.7%7361 10/05/10 VSN, Inc. 39.6%7361 10/01/10 Hewitt Associates, Inc. 42.6%7363 03/23/11 American Surgical Holdings, Inc. 122.3%7363 09/02/11 SFN Group, Inc. 52.7%7363 01/31/11 Nestor Healthcare Group PLC 43.8%7371 07/19/11 Mamut ASA 9.1%7371 05/31/11 MKS, Inc. 38.3%7371 04/04/11 Global Defense Technology & Systems, Inc. 50.8%7371 12/22/10 IDS Scheer AG 21.4%Copyright © 2012, FactSet Mergerstat, LLC. All rights reserved. 23
Mergerstat Control Premium Study3rd Quarter <strong>2011</strong>73-78 Business Services (continued)7371 10/01/10 SHARP Corp. / Nikkei, Inc. / Nippon Telegraph -12.6%*& Telephone East Corp. (TV TokyoBroadband Entertainment, Inc.)7372 09/23/11 eFront SA 62.2%7372 06/09/11 smartFOCUS Group PLC 61.3%7372 08/17/11 Bridgewater Systems Corp. 29.5%7372 04/08/11 Metrologic Group SA 0.0%7372 02/08/11 ADAM, Inc. 142.1%7372 07/31/11 iSOFT Group Ltd. 226.9%7372 07/26/11 L-1 Identity Solutions, Inc. 23.7%7372 07/14/11 Chartwell Technology, Inc. 50.1%7372 07/13/11 Gerako Oy (Tekla Oyj) 51.5%7372 01/07/11 iseemedia, Inc. 1,532.5%7372 06/29/11 IBS AB -7.9%*7372 06/28/11 Entraction Holding AB 33.8%7372 06/16/11 Vital Images, Inc. 31.5%7372 05/06/11 System C Healthcare PLC 50.5%7372 05/16/11 Epicor Software Corp. 11.2%7372 07/05/11 Lawson Software, Inc. -2.2%*7372 07/05/11 Synergi Solutions AS 54.3%7372 01/05/11 Art Technology Group, Inc. 46.3%7372 04/27/11 Novell, Inc. 9.1%7372 04/18/11 Business Trust Co., Ltd. 46.1%7372 04/13/11 SomaFlex Holdings, Inc. (Flexsystem Holdings 23.3%Ltd.)7372 03/15/11 Works Applications Co., Ltd. 34.1%7372 02/28/11 McAfee, Inc. 60.4%7372 02/17/11 Sonic Solutions, Inc. 27.1%7372 01/18/11 BakBone Software, Inc. 32.0%7372 01/18/11 InfoLogix, Inc. 171.4%7372 04/01/11 Cytiva Software, Inc. 20.0%7372 12/31/10 Trintech Group PLC 42.7%7372 12/21/10 Isilon Systems, Inc. 26.4%7372 12/16/10 ActivIdentity Corp. 43.2%7372 11/30/10 Intec Telecom Systems PLC 30.3%7372 11/29/10 Teta SA 33.5%7372 11/23/10 Phoenix Technologies Ltd. 37.3%7372 11/11/10 Netezza Corp. 9.8%7372 10/22/10 ArcSight, Inc. 23.9%7372 12/10/10 Kale Consultants Ltd. 20.5%7372 10/08/10 DivX, Inc. 38.9%7372 10/06/10 Unica Corp. 119.9%7372 12/03/10 Comverse Technology, Inc. (Ulticom, Inc.) 4.9%7372 10/01/10 Salary.com, Inc. 42.3%7373 09/22/11 Proservia SA 30.8%7373 08/30/11 Telvent GIT SA 40.2%7373 07/28/11 Integral Systems, Inc. (Maryland) -11.8%*Copyright © 2012, FactSet Mergerstat, LLC. All rights reserved. 24
Mergerstat Control Premium Study3rd Quarter <strong>2011</strong>73-78 Business Services (continued)7373 07/20/11 SRA International, Inc. 10.2%7373 08/05/11 BT Group PLC (Accel Frontline Ltd.) 2.4%7373 01/17/11 Patni Computer Systems Ltd. 9.4%7373 09/01/11 Tohken Co., Ltd. 29.9%7373 12/14/10 Dimension Data Holdings PLC 18.1%7374 08/01/11 SBI VeriTrans Co., Ltd. -30.5%*7375 07/11/11 ITOCHU Corp. (NANO Media Inc.) 12.7%7375 08/29/11 IntraPower Ltd. 114.3%7375 06/16/11 iWeb Groupe, Inc. 25.0%7375 04/29/11 RP Data Ltd. 64.3%7375 04/14/11 Answers Corp. 18.0%7375 04/04/11 JCA Holding ApS / Soeren Alminde Holding ApS 35.1%(Euroinvestor.com A/S)7375 03/31/11 bwin Interactive Entertainment AG -24.3%*7375 03/23/11 SeLoger.com SA 31.2%7375 01/31/11 BV! Media, Inc. 110.5%7375 12/17/10 Internet Brands, Inc. 46.5%7375 10/29/10 Day Software Holding AG 32.4%7375 11/09/10 Alloy, Inc. 14.1%7375 10/07/10 Health Grades, Inc. 29.3%7379 04/11/11 Terremark Worldwide, Inc. 38.7%7379 09/13/11 Quintec SA 47.1%7379 02/07/11 Voltaire Ltd. 36.1%7379 04/21/11 NaviSite, Inc. 97.1%7379 12/13/10 TechTeam Global, Inc. 16.8%7379 12/03/10 Modul 1 Data AB 30.0%7382 09/09/11 Niscayah Group AB 46.9%7382 12/16/10 Henry Bros. Electronics, Inc. 78.3%7383 09/28/11 Global Traffic Network, Inc. 20.0%7389 07/11/11 WebMoney Corp. 19.5%7389 09/21/11 KH Investment Holdings Ltd. 4.2%7389 04/15/11 ToLuna PLC 30.6%7389 12/03/10 E-xact Transactions Ltd. 14.1%7521 02/07/11 Yamashin Ltd. (Nihon Parking Corp.) 29.0%7699 02/23/11 Allis-Chalmers Energy, Inc. 161.0%7819 07/11/11 Crystal Amber Fund Ltd. (Pinewood Shepperton 22.1%PLC)7819 10/13/10 Shed Media PLC 47.4%79 Amusement and Recreation ServicesRange = 1.6% to 142.5% Median = 22.2% Average = 36.1%7922 06/21/11 CKx, Inc. 23.6%7941 06/10/11 DF Nominees Ltd. (Arsenal Holdings PLC) 1.6%7941 08/18/11 A.S. Roma SpA -41.3%*7948 03/30/11 SNAI SpA -10.4%*Copyright © 2012, FactSet Mergerstat, LLC. All rights reserved. 25
Mergerstat Control Premium Study3rd Quarter <strong>2011</strong>79 Amusement and Recreation Services (continued)7993 08/31/11 Centrebet International Ltd. 25.8%7993 07/25/11 Praesepe PLC 20.9%7993 07/18/11 Rank Group PLC 2.1%7999 06/26/11 Odyssey Gaming Ltd. 142.5%80-82 Health ServicesRange = 3.4% to 140.0% Median = 44.0% Average = 48.9%8011 05/04/11 NovaMed, Inc. 40.4%8059 11/15/10 Aevum Ltd. 65.1%8062 01/18/11 Thomson Medical Centre Ltd. 62.0%8062 09/01/11 AIM Health Group, Inc. 48.8%8062 06/01/11 RehabCare Group, Inc. 47.6%8062 12/15/10 Prospect Medical Holdings, Inc. 38.9%8062 11/24/10 Fortis Healthcare Ltd. (Parkway Holdings Ltd.) 30.8%8063 11/15/10 Psychiatric Solutions, Inc. 3.4%8071 05/17/11 Celera Corp. 27.6%8071 02/24/11 BMP Sunstone Corp. 30.5%8071 12/22/10 NightHawk Radiology Holdings, Inc. 100.0%8082 06/03/11 America Service Group, Inc. 48.7%8082 12/22/10 ResCare, Inc. 30.7%8093 12/24/10 The Center for Wound Healing, Inc. 140.0%8111 06/30/11 Pre-Paid Legal Services, Inc. 18.5%8299 09/21/11 Daiwa Securities Group Inc. (GABA Corp.) 49.0%8299 08/09/11 Nobel Learning Communities, Inc. 36.0%8299 07/13/11 Education Development International PLC 61.3%86 Membership Organizations8641 04/19/11 VCG Holding Corp. 36.4%87 Engineering , Accounting, Research and ManagementRange = 0.7% to 89.2% Median = 37.5% Average = 40.3%8711 08/29/11 Servidyne, Inc. 54.7%8711 10/22/10 ATC Technology Corp. 43.4%8711 10/01/10 Commuture Corp. -22.7%*8721 10/22/10 DataCash Group PLC 53.8%8731 07/12/11 Kendle International, Inc. 53.9%8731 09/06/11 Ondine Biomedical, Inc. 65.0%8731 04/21/11 ProStrakan Group PLC 19.4%8731 01/27/11 Biocompatibles International PLC 31.6%8731 12/23/10 Biolin Scientific AB 25.7%8742 03/17/11 Pareto Corp. 0.7%8742 11/02/10 Diamond Management & Technology 31.0%Copyright © 2012, FactSet Mergerstat, LLC. All rights reserved. 26
Mergerstat Control Premium Study3rd Quarter <strong>2011</strong>Consultants, Inc.87 Engineering , Accounting, Research and Management (continued)8743 11/01/10 Mitchell Communication Group Ltd. 15.4%8744 12/02/10 Spice Ltd. 89.2%88-89 Private Households and Miscellaneous ServicesRange = 11.9% to 40.3% Median = 26.1% Average = 26.1%8811 12/23/10 Santa Maria (France) (Merci + Groupe SA) 40.3%8999 07/20/11 Warner Music Group Corp. 11.9%8999 06/24/11 Marsulex, Inc. -0.4%*Copyright © 2012, FactSet Mergerstat, LLC. All rights reserved. 27
Mergerstat Control Premium Study3rd Quarter <strong>2011</strong>Target Name and SIC Number (Domestic)Target NameTargetSICAcquirer NameAcquirerSICBJ's Wholesale Club, Inc. 5399 LGP Management, Inc. (Leonard Green &Partners LP / CVC Capital Partners Ltd.)Blackstone Group LP (Graham Packaging Co., Inc.) 2821 The Reynolds Group, Inc. (Reynolds GroupHoldings Ltd.)Bucyrus International, Inc. 3532 Caterpillar, Inc. 3531California Pizza Kitchen, Inc. 5812 Golden Gate Capital 6771Citadel Broadcasting Corp. 4832 Cumulus Media, Inc. 4832Danvers Bancorp, Inc. 6035 People's United Financial, Inc. 6021EMS Technologies, Inc. 3663 Honeywell International, Inc. 3724EnergyConnect Group, Inc. 1731 Johnson Controls, Inc. 3714Fremont Michigan InsuraCorp, Inc. 6331 The American Automobile Association, Inc. (AutoClub Insurance Association)Frontier Oil Corp. 2911 Holly Corp. 2911Gerber Scientific, Inc. 3559 Vector Capital Corp. 6771Global Traffic Network, Inc. 7383 GTCR Golder Rauner LLC 6771GS Financial Corp. 6036 Home Bancorp, Inc. 6035Hypercom Corp. 3571 VeriFone Systems, Inc. 3578Immucor, Inc. 2835 TPG Capital LP 6771Integral Systems, Inc. (Maryland) 7373 Kratos Defense & Security Solutions, Inc. 7382K-Sea Transportation Partners LP 4491 Kirby Corp. 4449Kendle International, Inc. 8731 INC Research LLC 8731KKR & Co. LP (PRIMEDIA, Inc.) 2721 TPG Capital LP 6771L-1 Identity Solutions, Inc. 7372 Safran SA 3724Lawson Software, Inc. 7372 Golden Gate Capital (Infor Global Solutions) 6771Legacy Bancorp, Inc. 6022 Berkshire Hills Bancorp, Inc. 6022M. D. Sass Investors Services, Inc. (Sterling Chemicals,Inc.)6722874275492911 Eastman Chemical Co. 2821Marshall & Ilsley Corp. 6021 Bank of Montreal 6021MediaMind Technologies, Inc. 7311 DG FastChannel, Inc. 7822MidCarolina Financial Corp. 6712 American National Bankshares, Inc. 6021National Semiconductor Corp. 3674 Texas Instruments, Incorporated. 3674Nationwide Health Properties, Inc. 6798 Ventas, Inc. 6798Nobel Learning Communities, Inc. 8299 Leeds Equity Partners LLC 6771Ophthalmic Imaging Systems, Inc. 3845 Merge Healthcare, Inc. 7372optionsXpress Holdings, Inc. 6211 Charles Schwab Corp. 6211Orange Community Bancorp 6712 Grandpoint Capital, Inc. 6022Copyright © 2012, FactSet Mergerstat, LLC. All rights reserved. 28
Mergerstat Control Premium Study3rd Quarter <strong>2011</strong>Target NameTargetSICAcquirer NameAcquirerSICPetrohawk Energy Corp. 1311 BHP Billiton Ltd. 1011Radiant Systems, Inc. 3578 NCR Corp. 7371SAVVIS, Inc. 4822 CenturyLink, Inc. 4813Servidyne, Inc. 8711 SCIenergy, Inc. 7372SFN Group, Inc. 7363 Randstad Holding NV 7361SMART Modular Technologies (WWH), Inc. 3674 Silver Lake Group LLC (Silver Lake Partners /Silver Lake Sumeru)SRA International, Inc. 7373 Providence Equity Partners, Inc. 6771Sterling Bancshares, Inc. 6022 Comerica, Inc. 6021The Lubrizol Corp. 2992 Berkshire Hathaway, Inc. 6411Timberland Co. 2389 VF Corp. 2325Vaughan Foods, Inc. 0179 Reser's Fine Foods, Inc. 2096Warner Music Group Corp. 8999 Access Industries, Inc. (New York) 6771Zoran Corp. 3674 CSR PLC 3674Sonic Solutions, Inc. 7372 Rovi Corp. 7375Syniverse Holdings, Inc. 4899 The Carlyle Group LLC 6771T-3 Energy Services, Inc. 3533 Robbins & Myers, Inc. 3561The Cypress Group LLC (CPI International, Inc.(California))67713669 Veritas Capital LLC 6771Todd Shipyards Corp. 1629 Vigor Industrial LLC 7623United PanAm Financial Corp. 6141 United Panam Financial Corp. /Private Group/ 6799Copyright © 2012, FactSet Mergerstat, LLC. All rights reserved. 29
Mergerstat Control Premium Study3rd Quarter <strong>2011</strong>Target Name and SIC Number (International)Target NameTargetSICAcquirer NameAcquirerSICA.S. Roma SpA 7941 UniCredit SpA / DiBenedetto AS Roma LLC 6799AB Invalda / Baltic Pharma Ltd. (Sanitas AB) 2834 Valeant Pharmaceuticals International, Inc. 2834AIM Health Group, Inc. 8062 AIM Health Group, Inc. /Private Group/ 6799ATR Holdings, Inc. (Philippines) (ATR KimEngFinancial Corp.)6211 Malayan Banking Bhd. (Kim Eng Holdings Ltd.) 6211Bridgewater Systems Corp. 7372 Amdocs Ltd. 7373BT Group PLC (Accel Frontline Ltd.) 7373 Accel Ltd. 7379Caledon Resources PLC 1222 Guangdong State-Owned Assets Supervision &Administration (Guangdong Rising AssetsManagement Co. Ltd.)6799Camlin Ltd. 2678 KOKUYO Co., Ltd. (Kokuyo S&T Co., Ltd.) 2678CAS Capital, Inc. (Kazokutei Co., Ltd.) 5812 H2O Retailing Corp. 5311CBG Group PLC 6411 Charterhouse Capital Partners LLP (Giles InsuranceBrokers Ltd.)6771Cellestis Ltd. 2836 QIAGEN NV 3826Centrebet International Ltd. 7993 Sportingbet PLC 7999Charlie's Group Ltd. 2037 Asahi Group Holdings Ltd. (Asahi Beverages NewZealand Ltd.)2082Chartwell Technology, Inc. 7372 Amaya Gaming Group, Inc. 3944Chaucer Holdings PLC 6411 Hanover Insurance Group, Inc. 6331China Security & Surveillance Technology, Inc. 3663 Intelligent One Ltd. (Rightmark Holdings Ltd.) 6799Cinch Energy Corp. 1381 Tourmaline Oil Corp. 1389Crude Carriers Corp. 4412 Capital Product Partners LP 4412Crystal Amber Fund Ltd. (Pinewood Shepperton PLC) 7819 Peel Acquisitions Ltd. (Peel Holdings Ltd.) 6531Culane Energy Corp. 1382 Killam Acquisition Co. Ltd. 6799Daiwa Securities Group Inc. (GABA Corp.) 8299 Nichii Gakkan Co. 8741Dawson Holdings PLC 5192 Smiths News PLC 5192Delachaux SA 3743 Ande Investissement SA / Financière Danube SARL 6799Demag Cranes AG 3531 TEREX Corp. (Terex Industrial Holding AG) 3531Dundee Corp. (Breakwater Resources Ltd.) 1411 Nyrstar NV 1031ECT Industries SA 3812 NSE Holding SA 8711EDT Retail Trust 6771 Elbit Imaging Ltd. / Eastgate Property LLC (EPN GPLLC)6799Education Development International PLC 8299 Pearson PLC 2731Copyright © 2012, FactSet Mergerstat, LLC. All rights reserved. 30
Mergerstat Control Premium Study3rd Quarter <strong>2011</strong>Target NameTargetSICAcquirer NameAcquirerSICeFront SA 7372 Francisco Partners Management LLC 6771ElektronikGruppen BK AB 3679 KAMIC AB (KAMIC Electronics AB) 3679elexis AG 3625 SIEMAG Weiss GmbH & Co. KG (SMS GmbH) 3547Equinox Minerals Ltd. 1499 Barrick Gold Corp. 1041Forever Prosperous Pte Ltd. (PT Royal OakDevelopment Asia Tbk)1522 Pikko Land Corp. 6531Forzani Group Ltd. 5611 Canadian Tire Corp. Ltd. 5014Frankland River Olive Co. Ltd. 2076 Toscana (WA) Pty Ltd. 6799Gerako Oy (Tekla Oyj) 7372 Trimble Navigation Ltd. (Trimble Finland Oy) 3812Goldstone Resources, Inc. 1041 Premier Gold Mines Ltd. 1041Goto Co., Ltd. 5611 G Planning KK 6799Government of Serbia (Paracinka AD) 2064 Silbo doo 5153Henkel AG & Co. KGaA (Henkel India Ltd.) 2841 Jyothy Laboratories Ltd. 2844Holidaybreak PLC 4725 Cox & Kings (India) Ltd. 4724HPI Resources Bhd. 2653 Oji Paper Co., Ltd. (Oji Paper Asia Sdn. Bhd.) 2621Icron Technologies Corp. 5045 Icron Technologies Corp. /Private Group/ 6799Ignis ASA 3674 Finisar Corp. 3674Impera Total Return AG 6799 Concilium AG 6799Indian Energy Ltd. 4911 Infrastructure India PLC 6726IntraPower Ltd. 7375 TPG Telecom Ltd. 4813iSOFT Group Ltd. 7372 Computer Sciences Corp. 7379ITOCHU Corp. (NANO Media Inc.) 7375 Wellnet Corp. 7389Japan Fine Arts KK (Kojitu Co., Ltd.) 5941 DRC Capital Ltd. 6771Kawashima Selkon Textiles Co., Ltd. 2221 JS Group Corp. 3442KH Investment Holdings Ltd. 7389 Century City International Holdings Ltd. (SplendorGlow Ltd.)7011Korea Value Asset Management Co., Ltd. (HyundaiDSF Co., Ltd.)5311 Hyundai Department Store Co., Ltd. 5311KS Energy Ltd. 1389 Rija Holdings Ltd. (Pacific One Energy Ltd.) 6799Liquidation World, Inc. 5999 Big Lots, Inc. 5399MagIndustries Corp. 3313 Evergreen Industries Holding Group 6719Mamut ASA 7371 KKR & Co. LP (Visma AS) 6282Maspro Denkoh Corp. 3663 Hashiyama KK 6799Minerva PLC 6531 DV4 Ltd. / Area Property Partners Ltd. 6531Copyright © 2012, FactSet Mergerstat, LLC. All rights reserved. 31
Mergerstat Control Premium Study3rd Quarter <strong>2011</strong>Target NameTargetSICAcquirer NameAcquirerSICMoria SA 3841 Banque Privée Edmond de Rothschild SA (FinancièreCronos SAS)6029Nippon Kagaku Yakin Co., Ltd. 2821 NTN Corp. 3562Niscayah Group AB 7382 Stanley Black & Decker, Inc. 3545Northern Energy Corp. Ltd. 1222 New Hope Corp. Ltd. 1222OFI Private Equity Capital SCA 6771 Eurazeo SA 6771Ondine Biomedical, Inc. 8731 0902337 BC Ltd. 6799Orient Garments Ltd. 2389 Orient Garments Ltd. /Private Group/ 6799OSK Property Holdings Bhd. 6552 OSK Property Holdings Bhd. /Private Group/ 6799Outremer Télécom SA 4813 Outremer Télécom SA /Private Group/ 6799Paradise Capital Holding Co. (Olympic Group forFinancial Investments Co.)3633 Electrolux AB 3631Parmalat SpA 2023 Défitrans SARL (Groupe Lactalis SA) 4213Portek International Ltd. 5088 Mitsui & Co., Ltd. 5085Praesepe PLC 7993 Marwyn Management Partners PLC 6799Proservia SA 7373 ManpowerGroup (Manpower France SAS) 7361Pulai Springs Bhd. 6799 Swift Redeem Sdn. Bhd. 6799Quintec SA 7379 Sonda SA (Sonda Filiales Chile Ltda.) 7372Rank Group PLC 7993 Guoco Group Ltd. 6211Rhodia SA 2819 Solvay SA 2899Russian Railways OJSC (TransCreditBank JSC) 6021 VneshTorgBank JSC 6021SäkI AB 6799 Investment AB Latour 6799Safari Industries (India) Ltd. 3161 Safari Industries (India) Ltd. /Jatia/ 6799Satair A/S 5088 European Aeronautic Defence & Space NV (AirbusDenmark Holding ApS)3721SBI VeriTrans Co., Ltd. 7374 SBI Holdings, Inc. 6211Schulthess Group AG 3633 NIBE Industrier AB 3634Scottish Re Group Ltd. 6311 Scottish Re Group Ltd. /Private Group/ 6799Shanghai Bailian Group Co. Ltd. 5311 Shanghai Friendship Group Co. Ltd. 5311Siam Industrial Credit Public Co. Ltd. 6141 Siam Commercial Bank Public Co. Ltd. 6021Sical Logistics Ltd. 4731 Amalgamated Bean Coffee Trading Co. Ltd. (TanglinRetail Reality Developments Pvt Ltd.)2095SIIC Shanghai Holding Co. Ltd. (Shanghai IndustrialDevelopment Co. Ltd.)6552 Shanghai Industrial Holdings Ltd. (SI PropertiesDevelopment Ltd.)silex technology, Inc. 3577 Murata Machinery Ltd. 35592111Copyright © 2012, FactSet Mergerstat, LLC. All rights reserved. 32
Mergerstat Control Premium Study3rd Quarter <strong>2011</strong>Target NameTargetSICAcquirer NameAcquirerSICSolvay SA (Solvay Pharma India Ltd.) 2834 Abbott Laboratories (Abbott India Ltd.) 2834Sunway City Bhd. 6552 Sunway Bhd. 6719Sunway Holdings Bhd. 1542 Sunway Bhd. 6719Synergi Solutions AS 7372 Det Norske Veritas AS 8742Telvent GIT SA 7373 Schneider Electric SA 3674Territory Resources Ltd. 1011 Noble Group Ltd. (Jonesville Ltd. (British VirginIslands))5085The Capital Pub Co. PLC 5813 Greene King PLC 5813Tognum AG 3621 Daimler AG / Rolls-Royce Group PLC (EngineHolding GmbH)3711Tohken Co., Ltd. 7373 Mars Engineering Corp. 3944Tong Yang Magic Co., Ltd. 3631 TONGYANG, Inc. 3241Torque Energy, Inc. 1311 Eurogas Corp. 1382Uniq PLC 5142 Greencore Group PLC 2087United Securities Public Co., Ltd. 6211 UOB Kay Hian Holdings Ltd. (UOB Kay HianSecurities (Thailand) Public Co., Ltd.)6211Valad Property Group 6531 Blackstone Group LP 6799Verigy Ltd. 3674 Advantest Corp. 3823WebMoney Corp. 7389 KDDI Corp. 4813Yash Trading & Finance Ltd. 6197 Yash Trading & Finance Ltd. /Sethy/ 6799Zuken, Inc. / Kenny B YK (Chip One Stop, Inc.) 3674 Arrow Electronics, Inc. 5065Copyright © 2012, FactSet Mergerstat, LLC. All rights reserved. 33
Mergerstat Control Premium Study3rd Quarter <strong>2011</strong>Announce & Closing Dates, Total Deal Value (Domestic)Target NameAnnounceDateClose DateTargetMarket Valueof Equity($Mil)CurrencyExchangeRatePctg. ofCommonPreviouslyHeld by Acq.Pctg. OfCommonHeld by Acq.After Trans.BJ's Wholesale Club, Inc. 06/29/11 09/30/11 2,548.2 1.00 9.5 100.0Blackstone Group LP (Graham PackagingCo., Inc.)06/14/11 09/08/11 1,675.2 1.00 0.0 100.0Bucyrus International, Inc. 11/15/10 07/08/11 7,493.9 1.00 0.0 100.0California Pizza Kitchen, Inc. 05/25/11 07/07/11 454.8 1.00 0.0 100.0Citadel Broadcasting Corp. 12/17/10 09/16/11 1,667.0 1.00 0.0 100.0Danvers Bancorp, Inc. 01/20/11 07/01/11 462.4 1.00 0.0 100.0EMS Technologies, Inc. 06/13/11 08/22/11 513.2 1.00 0.0 100.0EnergyConnect Group, Inc. 03/03/11 07/05/11 30.7 1.00 0.0 100.0Fremont Michigan InsuraCorp, Inc. 04/18/11 08/01/11 64.5 1.00 0.0 100.0Frontier Oil Corp. 02/22/11 07/01/11 3,554.4 1.00 0.0 100.0Gerber Scientific, Inc. 06/13/11 08/22/11 276.0 1.00 0.0 100.0Global Traffic Network, Inc. 08/03/11 09/28/11 266.8 1.00 0.0 100.0GS Financial Corp. 03/30/11 07/15/11 26.3 1.00 0.0 100.0Hypercom Corp. 09/29/10 08/04/11 589.2 1.00 0.0 100.0Immucor, Inc. 07/05/11 08/19/11 1,910.0 1.00 0.0 100.0Integral Systems, Inc. (Maryland) 05/16/11 07/28/11 204.0 1.00 0.0 100.0K-Sea Transportation Partners LP 03/13/11 07/01/11 157.8 1.00 0.0 100.0Kendle International, Inc. 05/04/11 07/12/11 228.3 1.00 0.0 100.0KKR & Co. LP (PRIMEDIA, Inc.) 05/16/11 07/13/11 316.4 1.00 0.0 100.0L-1 Identity Solutions, Inc. 09/20/10 07/26/11 1,085.2 1.00 0.0 100.0Lawson Software, Inc. 03/11/11 07/05/11 1,844.5 1.00 0.0 100.0Legacy Bancorp, Inc. 12/21/10 07/21/11 123.5 1.00 0.0 100.0M. D. Sass Investors Services, Inc. (SterlingChemicals, Inc.)06/22/11 08/09/11 7.1 1.00 0.0 100.0Marshall & Ilsley Corp. 12/17/10 07/05/11 4,291.3 1.00 0.0 100.0MediaMind Technologies, Inc. 06/16/11 07/26/11 429.6 1.00 0.0 100.0MidCarolina Financial Corp. 12/16/10 07/01/11 29.9 1.00 0.0 100.0National Semiconductor Corp. 04/04/11 09/23/11 6,331.8 1.00 0.0 100.0Nationwide Health Properties, Inc. 02/28/11 07/01/11 5,251.2 1.00 0.0 100.0Nobel Learning Communities, Inc. 05/18/11 08/09/11 124.7 1.00 0.0 100.0Ophthalmic Imaging Systems, Inc. 06/06/11 08/05/11 29.1 1.00 0.0 100.0optionsXpress Holdings, Inc. 03/21/11 09/01/11 724.8 1.00 0.0 100.0Orange Community Bancorp 03/10/11 08/30/11 30.0 1.00 0.0 100.0Copyright © 2012, FactSet Mergerstat, LLC. All rights reserved. 34
Mergerstat Control Premium Study3rd Quarter <strong>2011</strong>Target NameAnnounceDateClose DateTargetMarket Valueof Equity($Mil)CurrencyExchangeRatePctg. ofCommonPreviouslyHeld by Acq.Pctg. OfCommonHeld by Acq.After Trans.Petrohawk Energy Corp. 07/14/11 08/26/11 11,775.9 1.00 0.0 100.0Radiant Systems, Inc. 07/11/11 08/24/11 1,140.5 1.00 0.0 100.0SAVVIS, Inc. 04/27/11 07/15/11 2,276.1 1.00 0.0 100.0Servidyne, Inc. 06/27/11 08/29/11 12.9 1.00 0.0 100.0SFN Group, Inc. 07/20/11 09/02/11 686.4 1.00 0.0 100.0SMART Modular Technologies (WWH), Inc. 04/26/11 08/29/11 603.1 1.00 0.0 100.0SRA International, Inc. 04/01/11 07/20/11 1,800.6 1.00 0.0 100.0Sterling Bancshares, Inc. 01/18/11 07/28/11 789.3 1.00 0.0 100.0The Lubrizol Corp. 03/14/11 09/16/11 8,702.1 1.00 0.0 100.0Timberland Co. 06/13/11 09/13/11 2,186.1 1.00 0.0 100.0Vaughan Foods, Inc. 07/06/11 09/16/11 14.9 1.00 0.0 100.0Warner Music Group Corp. 05/06/11 07/20/11 1,278.6 1.00 0.0 100.0Zoran Corp. 02/20/11 08/31/11 420.4 1.00 0.0 100.0Sonic Solutions, Inc. 12/22/10 02/17/11 707.1 1.00 0.0 100.0Syniverse Holdings, Inc. 10/28/10 01/13/11 2,176.6 1.00 0.0 100.0T-3 Energy Services, Inc. 10/06/10 01/10/11 597.3 1.00 0.0 100.0The Cypress Group LLC (CPI International,Inc. (California))11/26/10 02/11/11 328.7 1.00 0.0 100.0Todd Shipyards Corp. 12/23/10 02/15/11 128.9 1.00 0.0 100.0United PanAm Financial Corp. 12/28/10 02/25/11 107.8 1.00 0.0 100.0Copyright © 2012, FactSet Mergerstat, LLC. All rights reserved. 35
Mergerstat Control Premium Study3rd Quarter <strong>2011</strong>Announce & Closing Dates, Total Deal Value (International) *Target NameAnnounceDateClose DateTargetMarket Valueof Equity($Mil)CurrencyExchangeRatePctg. OfCommonPreviouslyHeld by Acq.Pctg. OfCommonHeld by Acq.After Trans.A.S. Roma SpA 02/16/11 08/18/11 86.3 1.43 0.0 67.1AB Invalda / Baltic Pharma Ltd. (Sanitas AB) 05/24/11 08/19/11 398.1 0.42 0.0 87.2AIM Health Group, Inc. 07/06/11 09/01/11 27.8 1.02 0.0 100.0ATR Holdings, Inc. (Philippines) (ATRKimEng Financial Corp.)06/29/11 08/17/11 35.5 0.02 42.4 74.6Bridgewater Systems Corp. 06/17/11 08/17/11 208.4 1.02 0.0 100.0BT Group PLC (Accel Frontline Ltd.) 08/05/11 08/05/11 11.2 0.02 0.0 51.0Caledon Resources PLC 11/08/10 08/26/11 508.0 1.62 0.0 100.0Camlin Ltd. 05/30/11 09/28/11 31.3 0.02 33.6 53.6CAS Capital, Inc. (Kazokutei Co., Ltd.) 08/11/11 09/08/11 50.1 0.01 0.05 73.5CBG Group PLC 08/02/11 09/15/11 8.0 1.58 0.0 100.0Cellestis Ltd. 04/04/11 08/10/11 373.5 1.02 0.0 100.0Centrebet International Ltd. 05/26/11 08/31/11 187.6 1.07 0.0 100.0Charlie's Group Ltd. 07/04/11 08/19/11 106.8 0.83 0.0 100.0Chartwell Technology, Inc. 05/12/11 07/14/11 23.4 1.04 0.0 100.0Chaucer Holdings PLC 04/20/11 07/01/11 492.5 1.60 0.0 100.0China Security & Surveillance Technology,Inc.01/28/11 09/16/11 475.6 0.16 20.9 100.0Cinch Energy Corp. 05/24/11 07/12/11 209.2 1.03 0.0 100.0Crude Carriers Corp. 05/05/11 09/30/11 134.7 1.34 0.0 100.0Crystal Amber Fund Ltd. (PinewoodShepperton PLC)04/08/11 07/11/11 63.7 1.59 29.1 71.1Culane Energy Corp. 06/17/11 07/28/11 66.5 1.05 0.0 100.0Daiwa Securities Group Inc. (GABA Corp.) 08/05/11 09/21/11 113.4 0.01 0.0 99.1Dawson Holdings PLC 06/07/11 09/26/11 26.8 1.55 0.0 100.0Delachaux SA 05/23/11 09/07/11 968.1 1.40 0.0 63.7Demag Cranes AG 05/02/11 08/16/11 1,137.4 1.44 0.0 82.0Dundee Corp. (Breakwater Resources Ltd.) 06/15/11 08/31/11 658.6 1.02 0.0 100.0ECT Industries SA 08/31/11 08/31/11 10.8 1.44 0.0 51.5EDT Retail Trust 03/10/11 07/26/11 241.6 1.09 47.8 100.0Education Development International PLC 03/07/11 07/13/11 181.3 1.61 0.0 100.0* Values are in U.S. Dollars, see page 76-79 for currency denomination of exchange rates.Copyright © 2012, FactSet Mergerstat, LLC. All rights reserved. 36
Mergerstat Control Premium Study3rd Quarter <strong>2011</strong>Target NameAnnounceDateClose DateTargetMarket Valueof Equity($Mil)CurrencyExchangeRatePctg. OfCommonPreviouslyHeld by Acq.Pctg. OfCommonHeld by Acq.After Trans.eFront SA 09/23/11 09/23/11 55.3 1.35 0.0 74.2ElektronikGruppen BK AB 06/22/11 08/16/11 31.1 0.16 0.0 100.0elexis AG 05/09/11 08/04/11 237.5 1.42 0.0 89.0Equinox Minerals Ltd. 04/25/11 07/19/11 7,544.0 1.05 0.0 100.0Forever Prosperous Pte Ltd. (PT Royal OakDevelopment Asia Tbk)09/08/11 09/08/11 240.5 0.0001 0.0 68.0Forzani Group Ltd. 05/09/11 08/18/11 747.4 1.01 4.0 100.0Frankland River Olive Co. Ltd. 12/22/10 07/06/11 1.1 1.07 19.4 68.0Gerako Oy (Tekla Oyj) 05/09/11 07/13/11 479.8 1.42 0.0 100.0Goldstone Resources, Inc. 06/21/11 08/16/11 110.6 1.02 0.0 100.0Goto Co., Ltd. 07/08/11 08/22/11 28.6 0.01 19.3 79.7Government of Serbia (Paracinka AD) 08/16/11 09/07/11 1.5 0.01 0.0 80.0Henkel AG & Co. KGaA (Henkel India Ltd.) 05/05/11 08/22/11 26.0 0.02 14.9 65.9Holidaybreak PLC 07/27/11 09/27/11 479.0 1.57 0.0 100.0HPI Resources Bhd. 06/15/11 08/10/11 82.9 0.33 0.0 96.8Icron Technologies Corp. 06/21/11 08/29/11 12.0 1.02 0.0 100.0Ignis ASA 03/22/11 07/05/11 79.3 0.19 32.8 100.0Impera Total Return AG 09/30/11 09/30/11 4.7 1.34 0.0 50.0Indian Energy Ltd. 07/21/11 09/21/11 10.3 1.56 0.0 100.0IntraPower Ltd. 07/14/11 08/29/11 13.6 1.06 0.0 100.0iSOFT Group Ltd. 04/01/11 07/31/11 199.9 1.10 0.0 100.0ITOCHU Corp. (NANO Media Inc.) 06/07/11 07/11/11 11.6 0.01 0.0 59.7Japan Fine Arts KK (Kojitu Co., Ltd.) 07/22/11 09/15/11 16.3 0.01 17.5 78.2Kawashima Selkon Textiles Co., Ltd. 05/16/11 08/01/11 82.3 0.01 34.1 100.0KH Investment Holdings Ltd. 07/12/11 09/21/11 3.6 0.13 30.5 52.8Korea Value Asset Management Co., Ltd.(Hyundai DSF Co., Ltd.)04/06/11 07/18/11 69.3 0.0009 41.0 100.0KS Energy Ltd. 06/17/11 08/03/11 40.7 0.83 40.4 51.6Liquidation World, Inc. 05/26/11 07/18/11 1.9 1.04 0.0 100.0MagIndustries Corp. 04/20/11 07/29/11 119.7 1.05 0.0 100.0Mamut ASA 06/09/11 07/19/11 141.8 0.18 0.0 100.0Maspro Denkoh Corp. 07/29/11 09/12/11 206.9 0.01 14.6 93.6Minerva PLC 05/26/11 09/19/11 303.9 1.56 0.0 100.0* Values are in U.S. Dollars, see page 76-79 for currency denomination of exchange rates.Copyright © 2012, FactSet Mergerstat, LLC. All rights reserved. 37
Mergerstat Control Premium Study3rd Quarter <strong>2011</strong>Target NameAnnounceDateClose DateTargetMarket Valueof Equity($Mil)CurrencyExchangeRatePctg. OfCommonPreviouslyHeld by Acq.Pctg. OfCommonHeld by Acq.After Trans.Moria SA 07/27/11 09/13/11 109.5 1.37 0.0 68.9Nippon Kagaku Yakin Co., Ltd. 07/27/11 09/07/11 5.4 0.01 0.0 79.2Niscayah Group AB 06/27/11 09/09/11 1,014.9 0.15 0.0 100.0Northern Energy Corp. Ltd. 10/08/10 09/29/11 244.0 0.98 4.9 100.0OFI Private Equity Capital SCA 04/26/11 08/04/11 112.0 1.42 0.0 93.9Ondine Biomedical, Inc. 06/28/11 09/06/11 3.2 1.01 0.0 100.0Orient Garments Ltd. 08/01/11 08/01/11 5.7 0.009 0.0 52.6OSK Property Holdings Bhd. 05/27/11 07/20/11 14.5 0.33 26.7 53.4Outremer Télécom SA 06/27/11 07/28/11 190.1 1.43 0.0 52.3Paradise Capital Holding Co. (Olympic Groupfor Financial Investments Co.)10/11/10 09/09/11 212.1 0.17 0.0 52.0Parmalat SpA 04/26/11 07/08/11 3,500.9 1.43 29.0 83.3Portek International Ltd. 07/13/11 09/26/11 164.2 0.77 0.0 100.0Praesepe PLC 04/08/11 07/25/11 45.2 1.63 0.0 100.0Proservia SA 07/06/11 09/22/11 25.3 1.35 0.0 68.4Pulai Springs Bhd. 08/01/11 09/21/11 19.0 0.32 32.0 80.1Quintec SA 08/10/11 09/13/11 61.0 0.002 0.0 89.4Rank Group PLC 05/06/11 07/18/11 316.0 1.60 40.8 74.5Rhodia SA 04/04/11 09/13/11 4,520.2 1.37 0.0 100.0Russian Railways OJSC (TransCreditBankJSC)07/15/11 07/20/11 585.7 0.04 43.2 72.6SäkI AB 03/17/11 07/06/11 570.8 0.16 0.0 100.0Safari Industries (India) Ltd. 09/06/11 09/06/11 6.2 0.02 0.0 56.6Satair A/S 07/27/11 09/29/11 456.5 0.18 0.0 100.0SBI VeriTrans Co., Ltd. 02/24/11 08/01/11 42.5 0.01 43.3 100.0Schulthess Group AG 04/11/11 07/27/11 622.2 1.25 31.1 100.0Scottish Re Group Ltd. 04/15/11 08/24/11 20.5 1.00 0.0 100.0Shanghai Bailian Group Co. Ltd. 11/02/10 08/26/11 2,768.2 0.16 0.0 100.0Siam Industrial Credit Public Co. Ltd. 05/18/11 09/22/11 81.6 0.03 38.7 99.6Sical Logistics Ltd. 11/15/10 09/08/11 20.2 0.02 36.0 56.0SIIC Shanghai Holding Co. Ltd. (ShanghaiIndustrial Development Co. Ltd.)08/16/10 07/06/11 793.3 0.15 0.0 63.7silex technology, Inc. 08/10/11 09/26/11 22.3 0.01 0.003 86.9* Values are in U.S. Dollars, see page 76-79 for currency denomination of exchange rates.Copyright © 2012, FactSet Mergerstat, LLC. All rights reserved. 38
Mergerstat Control Premium Study3rd Quarter <strong>2011</strong>Target NameAnnounceDateClose DateTargetMarket Valueof Equity($Mil)CurrencyExchangeRatePctg. OfCommonPreviouslyHeld by Acq.Pctg. OfCommonHeld by Acq.After Trans.Solvay SA (Solvay Pharma India Ltd.) 11/24/10 08/10/11 244.4 0.02 0.0 100.0Sunway City Bhd. 11/24/10 08/18/11 802.3 0.33 0.0 100.0Sunway Holdings Bhd. 11/24/10 08/18/11 522.9 0.33 0.0 100.0Synergi Solutions AS 01/28/11 07/05/11 11.1 0.19 0.0 100.0Telvent GIT SA 06/01/11 08/30/11 1,369.2 1.44 0.0 100.0Territory Resources Ltd. 06/09/11 08/12/11 93.1 1.03 32.0 100.0The Capital Pub Co. PLC 07/19/11 08/22/11 104.2 1.64 0.0 100.0Tognum AG 03/09/11 08/26/11 4,904.8 1.44 0.0 100.0Tohken Co., Ltd. 07/04/11 09/01/11 10.4 0.01 32.1 100.0Tong Yang Magic Co., Ltd. 06/13/11 09/01/11 22.3 0.0009 46.4 100.0Torque Energy, Inc. 05/02/11 08/04/11 7.5 1.03 0.0 100.0Uniq PLC 07/12/11 09/23/11 173.7 1.54 0.0 100.0United Securities Public Co., Ltd. 05/24/11 08/31/11 29.4 0.03 0.0 93.5Valad Property Group 04/29/11 08/26/11 218.2 1.05 0.0 100.0Verigy Ltd. 12/06/10 07/04/11 964.5 0.82 0.0 100.0WebMoney Corp. 06/10/11 07/11/11 229.9 0.01 0.0 97.1Yash Trading & Finance Ltd. 07/15/11 07/15/11 0.6 0.02 0.0 70.0Zuken, Inc. / Kenny B YK (Chip One Stop,Inc.)08/08/11 09/20/11 85.6 0.01 0.0 97.2* Values are in U.S. Dollars, see page 76-79 for currency denomination of exchange rates.Copyright © 2012, FactSet Mergerstat, LLC. All rights reserved. 39
Mergerstat Control Premium Study3rd Quarter <strong>2011</strong>Purchase Price/Share – Mergerstat Unaffected Price (Domestic) *Target NamePurchasePrice PerShareMergerstatUnaffectedPricePrice1 DayPrice1 WeekPrice1 MonthPrice2 MonthsBJ's Wholesale Club, Inc. 51.25 47.74 48.08 47.27 50.21 51.32Blackstone Group LP (Graham Packaging Co., Inc.) 25.50 16.71 25.63 22.27 22.15 22.62Bucyrus International, Inc. 92.00 69.62 69.62 72.03 74.29 68.50California Pizza Kitchen, Inc. 18.50 16.71 16.71 16.16 15.99 16.47Citadel Broadcasting Corp. 34.13 27.45 29.38 29.38 27.38 23.30Danvers Bancorp, Inc. 22.36 17.17 17.17 17.37 16.49 14.84EMS Technologies, Inc. 33.00 24.80 24.80 25.32 24.27 20.07EnergyConnect Group, Inc. 0.23 0.13 0.13 0.13 0.12 0.13Fremont Michigan InsuraCorp, Inc. 36.15 26.75 26.75 27.08 25.70 27.20Frontier Oil Corp. 33.39 28.12 28.12 26.02 17.50 17.65Gerber Scientific, Inc. 11.00 8.12 8.12 8.46 9.01 8.87Global Traffic Network, Inc. 14.00 11.67 11.67 11.48 11.61 10.77GS Financial Corp. 21.00 17.25 17.25 14.50 11.50 9.64Hypercom Corp. 9.43 4.17 4.17 3.95 3.29 4.38Immucor, Inc. 27.00 20.73 20.73 20.06 20.05 20.89Integral Systems, Inc. (Maryland) 11.47 13.01 13.01 13.06 12.40 12.24K-Sea Transportation Partners LP 4.16 6.47 6.35 6.34 5.33 5.74Kendle International, Inc. 15.25 9.91 9.91 10.03 10.72 9.07KKR & Co. LP (PRIMEDIA, Inc.) 7.10 4.38 4.38 4.47 4.77 4.26L-1 Identity Solutions, Inc. 12.00 9.70 9.70 9.60 9.02 8.10Lawson Software, Inc. 11.25 11.50 11.50 10.06 10.03 8.84Legacy Bancorp, Inc. 14.00 8.58 8.58 8.08 7.85 7.76M. D. Sass Investors Services, Inc. (SterlingChemicals, Inc.)2.50 1.53 1.53 1.70 1.50 2.30Marshall & Ilsley Corp. 8.09 5.79 5.79 5.90 4.96 7.03MediaMind Technologies, Inc. 22.00 15.94 15.94 16.25 14.98 13.80MidCarolina Financial Corp. 6.07 2.85 2.85 3.05 3.15 2.93National Semiconductor Corp. 25.00 14.23 14.23 14.34 15.51 15.56Nationwide Health Properties, Inc. 41.46 38.96 38.96 38.31 36.86 35.75Nobel Learning Communities, Inc. 11.75 8.64 8.64 9.92 9.86 9.55Ophthalmic Imaging Systems, Inc. 0.96 0.85 0.85 1.04 1.00 0.75* All stock prices are in U.S. Dollars..www.mergerstat.com 40
Mergerstat Control Premium Study3rd Quarter <strong>2011</strong>Target NamePurchasePrice PerShareMergerstatUnaffectedPricePrice1 DayPrice1 WeekPrice1 MonthPrice2 MonthsoptionsXpress Holdings, Inc. 12.60 15.33 15.33 15.43 16.23 14.41Orange Community Bancorp 11.70 7.75 7.75 7.75 7.75 4.85Petrohawk Energy Corp. 38.75 23.93 23.93 25.12 24.15 24.33Radiant Systems, Inc. 28.00 21.95 21.95 21.53 19.02 19.89SAVVIS, Inc. 39.55 36.02 36.02 36.54 35.49 33.14Servidyne, Inc. 3.50 2.26 2.26 2.46 2.35 2.40SFN Group, Inc. 14.00 9.17 9.17 9.72 8.77 9.85SMART Modular Technologies (WWH), Inc. 9.25 8.18 8.18 7.81 7.53 7.05SRA International, Inc. 31.25 28.36 28.36 28.09 26.52 26.85Sterling Bancshares, Inc. 7.73 7.70 7.70 7.24 6.55 6.19The Lubrizol Corp. 135.00 105.44 105.44 105.18 113.36 106.35Timberland Co. 43.00 29.99 29.99 29.50 33.70 42.86Vaughan Foods, Inc. 1.58 0.40 0.40 0.38 0.40 0.42Warner Music Group Corp. 8.25 7.37 7.90 7.47 6.92 6.04Zoran Corp. 8.37 9.32 9.36 9.29 8.74 7.94Sonic Solutions, Inc. 14.49 11.40 11.40 10.77 9.27 10.83Syniverse Holdings, Inc. 31.00 23.79 23.79 23.42 24.04 21.11T-3 Energy Services, Inc. 44.77 27.15 27.15 25.88 25.03 26.41The Cypress Group LLC (CPI International, Inc.(California))19.50 14.47 14.47 14.69 14.00 14.09Todd Shipyards Corp. 22.27 21.00 21.00 20.25 18.08 16.19United PanAm Financial Corp. 7.05 5.00 5.00 5.05 5.20 4.65* All stock prices are in U.S. Dollars..www.mergerstat.com 41
Mergerstat Control Premium Study3rd Quarter <strong>2011</strong>Purchase Price/Share – Mergerstat Unaffected Price (International) *Target NamePurchasePrice PerShareMergerstatUnaffectedPricePrice1 DayPrice1 WeekPrice1 MonthPrice2 MonthsA.S. Roma SpA 0.68 1.16 1.16 1.16 1.09 1.06AB Invalda / Baltic Pharma Ltd. (Sanitas AB) 35.15 19.16 19.16 19.30 19.68 17.61AIM Health Group, Inc. 0.25 0.17 0.17 0.17 0.15 0.13ATR Holdings, Inc. (Philippines) (ATR KimEngFinancial Corp.)4.38 3.85 3.85 3.85 3.80 3.85Bridgewater Systems Corp. 8.20 6.33 6.33 6.10 6.20 8.70BT Group PLC (Accel Frontline Ltd.) 43.50 42.50 42.50 44.15 41.50 44.75Caledon Resources PLC 1.12 0.84 0.84 0.71 0.60 0.53Camlin Ltd. 110.00 80.15 79.15 75.20 69.65 55.25CAS Capital, Inc. (Kazokutei Co., Ltd.) 750.00 513.00 513.00 517.00 520.00 535.00CBG Group PLC 0.32 0.21 0.28 0.29 0.21 0.21Cellestis Ltd. 3.80 3.00 3.00 2.85 2.75 2.39Centrebet International Ltd. 2.00 1.59 1.80 1.81 1.66 1.49Charlie's Group Ltd. 0.44 0.28 0.28 0.27 0.28 0.30Chartwell Technology, Inc. 1.23 0.82 0.82 0.79 0.74 0.72Chaucer Holdings PLC 0.56 0.53 0.54 0.54 0.53 0.59China Security & Surveillance Technology, Inc. 42.78 32.12 32.12 31.73 34.32 34.54Cinch Energy Corp. 2.12 1.29 1.29 1.28 1.15 1.10Crude Carriers Corp. 7.22 8.73 8.73 8.67 10.66 10.93Crystal Amber Fund Ltd. (Pinewood Shepperton PLC) 2.03 1.66 1.66 1.59 1.53 1.33Culane Energy Corp. 2.32 1.71 1.71 1.69 1.69 1.74Daiwa Securities Group Inc. (GABA Corp.) 200,000.00 134,200.00 134,200.00 133,300.00 126,300.00 99,600.00Dawson Holdings PLC 0.18 0.08 0.14 0.10 0.08 0.08Delachaux SA 83.00 66.99 66.18 66.99 63.80 56.57Demag Cranes AG 45.50 29.65 36.30 35.77 36.20 35.36Dundee Corp. (Breakwater Resources Ltd.) 7.50 5.20 5.20 5.09 5.08 5.95ECT Industries SA 12.00 8.29 8.29 8.30 8.89 9.01EDT Retail Trust 0.09 0.07 0.07 0.07 0.07 0.07Education Development International PLC 2.00 1.24 1.24 1.28 1.31 1.05eFront SA 18.00 11.10 11.10 10.00 10.40 11.50ElektronikGruppen BK AB 38.00 29.00 29.00 29.00 29.00 33.40elexis AG 20.50 17.00 17.00 17.10 14.02 13.81Equinox Minerals Ltd. 8.15 5.71 7.50 7.50 5.46 6.27* All stock prices are in home currency, See page 76-79 for currency denomination of stock prices.Copyright © 2012, FactSet Mergerstat, LLC. All rights reserved. 42
Mergerstat Control Premium Study3rd Quarter <strong>2011</strong>Target NamePurchasePrice PerShareMergerstatUnaffectedPricePrice1 DayPrice1 WeekPrice1 MonthPrice2 MonthsForever Prosperous Pte Ltd. (PT Royal OakDevelopment Asia Tbk)225.00 225.00 225.00 225.00 225.00 225.00Forzani Group Ltd. 26.50 17.61 17.61 18.43 17.22 17.71Frankland River Olive Co. Ltd. 0.01 0.008 0.008 0.008 0.008 0.01Gerako Oy (Tekla Oyj) 15.00 9.90 9.90 10.04 10.04 9.45Goldstone Resources, Inc. 1.04 0.69 0.69 0.71 0.75 0.86Goto Co., Ltd. 395.00 223.00 223.00 222.00 215.00 225.00Government of Serbia (Paracinka AD) 950.00 620.00 700.00 620.00 620.00 800.00Henkel AG & Co. KGaA (Henkel India Ltd.) 20.00 42.45 33.95 36.30 42.45 36.35Holidaybreak PLC 4.32 3.19 4.12 3.00 2.90 2.73HPI Resources Bhd. 4.40 3.93 3.93 3.16 3.31 3.50Icron Technologies Corp. 0.53 0.37 0.36 0.40 0.34 0.45Ignis ASA 8.00 5.05 5.05 4.88 5.00 4.88Impera Total Return AG 1.10 0.75 0.75 0.81 1.00 1.19Indian Energy Ltd. 0.26 0.25 0.26 0.25 0.26 0.25IntraPower Ltd. 0.30 0.14 0.14 0.14 0.15 0.15iSOFT Group Ltd. 0.17 0.05 0.05 0.05 0.06 0.07ITOCHU Corp. (NANO Media Inc.) 26,000.00 23,070.00 23,070.00 26,000.00 27,560.00 20,700.00Japan Fine Arts KK (Kojitu Co., Ltd.) 130.00 111.00 111.00 112.00 89.00 91.00Kawashima Selkon Textiles Co., Ltd. 67.45 59.00 59.00 62.00 65.00 52.00KH Investment Holdings Ltd. 0.25 0.24 0.24 0.25 0.25 0.24Korea Value Asset Management Co., Ltd. (HyundaiDSF Co., Ltd.)13,852.76 11,200.00 11,200.00 10,600.00 10,100.00 10,600.00KS Energy Ltd. 1.07 0.97 0.97 0.97 0.93 1.04Liquidation World, Inc. 0.06 0.11 0.11 0.21 0.43 0.49MagIndustries Corp. 0.25 0.16 0.16 0.16 0.16 0.23Mamut ASA 12.00 11.00 11.00 6.82 7.00 8.30Maspro Denkoh Corp. 1,070.00 655.00 655.00 657.00 628.00 638.00Minerva PLC 1.21 0.79 0.99 0.95 0.89 0.90Moria SA 51.02 45.00 45.00 45.00 39.17 44.99Nippon Kagaku Yakin Co., Ltd. 100.00 70.00 70.00 71.00 72.00 75.00Niscayah Group AB 18.00 12.25 15.70 16.00 16.80 12.15Northern Energy Corp. Ltd. 2.00 1.05 1.12 0.99 0.88 1.08OFI Private Equity Capital SCA 7.98 9.22 9.22 9.22 9.00 9.01* All stock prices are in U.S. Dollars..www.mergerstat.com 43
Mergerstat Control Premium Study3rd Quarter <strong>2011</strong>Target NamePurchasePrice PerShareMergerstatUnaffectedPricePrice1 DayPrice1 WeekPrice1 MonthPrice2 MonthsOndine Biomedical, Inc. 0.33 0.20 0.20 0.23 0.26 0.37Orient Garments Ltd. 21.56 34.20 34.60 34.10 NA NAOSK Property Holdings Bhd. 0.87 0.80 0.80 0.75 0.76 0.68Outremer Télécom SA 12.00 11.15 11.15 11.10 10.94 10.04Paradise Capital Holding Co. (Olympic Group forFinancial Investments Co.)40.60 30.06 30.06 28.51 26.58 25.49Parmalat SpA 2.60 2.31 2.31 2.26 2.38 2.19Portek International Ltd. 1.40 1.32 1.32 1.21 1.21 0.67Praesepe PLC 0.07 0.06 0.06 0.06 0.07 0.07Proservia SA 14.39 11.00 10.90 10.80 10.00 11.95Pulai Springs Bhd. 1.18 0.90 0.90 0.91 0.50 0.35Quintec SA 206.00 140.00 140.00 140.00 144.00 151.00Rank Group PLC 1.50 1.47 1.47 1.51 1.49 1.30Rhodia SA 31.60 21.07 21.07 20.17 20.42 21.82Russian Railways OJSC (TransCreditBank JSC) 24.40 23.40 23.40 22.00 20.64 20.35SäkI AB 72.56 69.50 72.75 72.50 69.00 76.00Safari Industries (India) Ltd. 170.00 131.05 131.05 126.40 117.45 90.95Satair A/S 580.00 470.00 470.00 440.00 435.00 426.12SBI VeriTrans Co., Ltd. 35,579.00 51,200.00 51,200.00 52,000.00 52,400.00 50,900.00Schulthess Group AG 68.10 52.85 52.85 53.00 48.75 46.40Scottish Re Group Ltd. 0.30 0.17 0.17 0.17 0.16 0.15Shanghai Bailian Group Co. Ltd. 16.06 13.80 13.80 13.80 13.80 13.80Siam Industrial Credit Public Co. Ltd. 6.89 4.30 4.30 4.30 4.62 4.20Sical Logistics Ltd. 79.50 88.00 88.00 75.90 64.90 65.95SIIC Shanghai Holding Co. Ltd. (Shanghai IndustrialDevelopment Co. Ltd.)7.44 8.13 8.13 8.13 8.13 8.50silex technology, Inc. 58,000.00 33,500.00 33,500.00 33,500.00 32,500.00 35,350.00Solvay SA (Solvay Pharma India Ltd.) 2,190.00 2,656.60 2,656.60 2,760.00 2,877.90 2,710.00Sunway City Bhd. 5.10 4.49 4.49 4.05 4.00 3.90Sunway Holdings Bhd. 2.60 2.25 2.25 2.00 1.98 1.79Synergi Solutions AS 5.40 3.50 3.50 3.50 3.50 3.50Telvent GIT SA 27.82 19.85 23.96 22.42 20.77 20.47Territory Resources Ltd. 0.50 0.17 0.47 0.46 0.24 0.30The Capital Pub Co. PLC 2.35 1.31 2.11 2.01 1.92 1.60* All stock prices are in U.S. Dollars..www.mergerstat.com 44
Mergerstat Control Premium Study3rd Quarter <strong>2011</strong>Target NamePurchasePrice PerShareMergerstatUnaffectedPricePrice1 DayPrice1 WeekPrice1 MonthPrice2 MonthsTognum AG 26.00 18.50 23.22 18.26 18.59 19.48Tohken Co., Ltd. 106.48 82.00 82.00 75.00 77.00 90.00Tong Yang Magic Co., Ltd. 6,294.71 4,800.00 4,800.00 5,020.00 5,090.00 5,180.00Torque Energy, Inc. 0.50 0.32 0.32 0.29 0.27 0.32Uniq PLC 0.96 0.75 0.77 0.77 0.76 0.75United Securities Public Co., Ltd. 5.58 4.10 4.10 4.20 4.10 3.70Valad Property Group 1.80 1.16 1.16 1.16 1.18 1.17Verigy Ltd. 19.53 11.60 11.90 11.31 12.26 10.34WebMoney Corp. 327,000.00 273,600.00 273,600.00 287,400.00 271,400.00 210,000.00Yash Trading & Finance Ltd. 156.42 153.00 153.00 153.00 153.00 153.00Zuken, Inc. / Kenny B YK (Chip One Stop, Inc.) 220,000.00 79,900.00 79,900.00 73,100.00 70,800.00 72,900.00* All stock prices are in U.S. Dollars..www.mergerstat.com 45
Mergerstat Control Premium Study3rd Quarter <strong>2011</strong>Mergerstat Unaffected Control Premium (Domestic)Target NameMergerstatUnaffectedControlPremiumPremium1 DayPremium1 WeekPremium1 MonthPremium2 MonthsBJ's Wholesale Club, Inc. 7.4% 6.6% 8.4% 2.1% -0.1%Blackstone Group LP (Graham Packaging Co., Inc.) 52.6% -0.5% 14.5% 15.1% 12.7%Bucyrus International, Inc. 32.1% 32.1% 27.7% 23.8% 34.3%California Pizza Kitchen, Inc. 10.7% 10.7% 14.5% 15.7% 12.3%Citadel Broadcasting Corp. 24.3% 16.2% 16.2% 24.7% 46.5%Danvers Bancorp, Inc. 30.2% 30.2% 28.7% 35.6% 50.6%EMS Technologies, Inc. 33.1% 33.1% 30.3% 36.0% 64.4%EnergyConnect Group, Inc. 74.4% 74.4% 71.8% 84.4% 74.4%Fremont Michigan InsuraCorp, Inc. 35.1% 35.1% 33.5% 40.7% 32.9%Frontier Oil Corp. 18.7% 18.7% 28.3% 90.8% 89.2%Gerber Scientific, Inc. 35.5% 35.5% 30.0% 22.1% 24.0%Global Traffic Network, Inc. 20.0% 20.0% 22.0% 20.6% 30.0%GS Financial Corp. 21.7% 21.7% 44.8% 82.6% 117.8%Hypercom Corp. 126.1% 126.1% 138.7% 186.6% 115.3%Immucor, Inc. 30.2% 30.2% 34.6% 34.7% 29.2%Integral Systems, Inc. (Maryland) -11.8% * -11.8% -12.1% -7.5% -6.2%K-Sea Transportation Partners LP -35.7% * -34.5% -34.4% -22.0% -27.5%Kendle International, Inc. 53.9% 53.9% 52.0% 42.3% 68.1%KKR & Co. LP (PRIMEDIA, Inc.) 62.1% 62.1% 58.8% 48.8% 66.7%L-1 Identity Solutions, Inc. 23.7% 23.7% 25.0% 33.0% 48.1%Lawson Software, Inc. -2.2% * -2.2% 11.8% 12.2% 27.3%Legacy Bancorp, Inc. 63.2% 63.2% 73.3% 78.4% 80.4%M. D. Sass Investors Services, Inc. (SterlingChemicals, Inc.)63.4% 63.4% 47.1% 66.7% 8.7%Marshall & Ilsley Corp. 39.7% 39.7% 37.1% 63.1% 15.0%MediaMind Technologies, Inc. 38.0% 38.0% 35.4% 46.9% 59.4%MidCarolina Financial Corp. 112.9% 112.9% 99.0% 92.7% 107.5%National Semiconductor Corp. 75.7% 75.7% 74.3% 61.2% 60.7%Nationwide Health Properties, Inc. 6.4% 6.4% 8.2% 12.5% 16.0%Nobel Learning Communities, Inc. 36.0% 36.0% 18.4% 19.2% 23.0%Ophthalmic Imaging Systems, Inc. 13.2% 13.2% -7.1% -3.8% 28.3%optionsXpress Holdings, Inc. -17.8% * -17.8% -18.4% -22.4% -12.6%* Not used in average or median calculations.Copyright © 2012, FactSet Mergerstat, LLC. All rights reserved. 46
Mergerstat Control Premium Study3rd Quarter <strong>2011</strong>Target NameMergerstatUnaffectedControlPremiumPremium1 DayPremium1 WeekPremium1 MonthPremium2 MonthsOrange Community Bancorp 51.0% 51.0% 51.0% 51.0% 141.2%Petrohawk Energy Corp. 61.9% 61.9% 54.3% 60.5% 59.3%Radiant Systems, Inc. 27.6% 27.6% 30.1% 47.2% 40.8%SAVVIS, Inc. 9.8% 9.8% 8.2% 11.5% 19.4%Servidyne, Inc. 54.7% 54.7% 42.3% 48.9% 45.8%SFN Group, Inc. 52.7% 52.7% 44.0% 59.6% 42.1%SMART Modular Technologies (WWH), Inc. 13.1% 13.1% 18.4% 22.8% 31.2%SRA International, Inc. 10.2% 10.2% 11.2% 17.8% 16.4%Sterling Bancshares, Inc. 0.3% 0.3% 6.7% 18.0% 24.8%The Lubrizol Corp. 28.0% 28.0% 28.4% 19.1% 26.9%Timberland Co. 43.4% 43.4% 45.8% 27.6% 0.3%Vaughan Foods, Inc. 295.0% 295.0% 321.3% 295.0% 280.7%Warner Music Group Corp. 11.9% 4.4% 10.4% 19.2% 36.6%Zoran Corp. -10.2% * -10.5% -9.9% -4.2% 5.5%Allegheny Energy, Inc. 21.1% 21.1% 24.2% 10.5% 10.8%Allis-Chalmers Energy, Inc. 295.0% 295.0% 321.3% 295.0% 280.7%American Community Bancorp, Inc. -35.7% -34.5% -34.4% -22.4% -27.5%American Surgical Holdings, Inc. 122.3% 122.3% 99.3% 221.1% 280.3%Applied Signal Technology, Inc. 34.1% 30.2% 28.7% 33.0% 32.9%Arbinet Corp. 45.0% 36.7% 37.2% 42.9% 45.9%Art Technology Group, Inc. 46.3% 46.3% 36.7% 46.0% 63.9%Atlas Energy, Inc. 20.6% 20.6% 26.3% 25.7% 34.5%BakBone Software, Inc. 32.0% 32.0% 135.7% 120.0% 135.7%Baldor Electric Co. 39.3% 40.8% 44.1% 51.1% 57.2%BMP Sunstone Corp. 30.5% 30.5% 28.2% 26.4% 52.2%Cadence Financial Corp. 53.4% 20.2% 25.6% 100.2% 46.2%California Oaks State Bank 89.2% 89.2% 81.6% 48.4% 56.0%Capital Bank Corp. 55.5% 55.5% 59.4% 56.4% 46.6%Comm Bancorp, Inc. 83.1% 83.1% 95.1% 153.7% 108.7%CommScope, Inc. 36.2% 4.2% 39.7% 35.7% 63.5%Compellent Technologies, Inc. -17.5% * -3.3% -3.0% 19.5% 52.5%Cypress Bioscience, Inc. 160.0% 160.0% 200.9% 49.8% 53.7%Del Monte Foods Co. 20.9% 11.4% 20.9% 32.1% 46.7%* Not used in average or median calculations.www.mergerstat.com 47
Mergerstat Control Premium Study3rd Quarter <strong>2011</strong>Target NameMergerstatUnaffectedControlPremiumPremium1 DayPremium1 WeekPremium1 MonthPremium2 MonthsDynamex, Inc. 63.9% -0.8% 3.1% 18.6% 18.6%First Franklin Corp. 78.8% 78.8% 78.8% 141.7% 97.5%First Ipswich Bancorp 224.0% 224.0% 224.0% 170.0% 362.9%First Mercury Financial Corp. 46.9% 46.9% 51.7% 67.3% 76.7%Genoptix, Inc. 26.5% 26.5% 23.0% 28.0% 40.8%Herley Industries, Inc. 15.7% 15.7% 15.6% 11.6% 14.9%InfoLogix, Inc. 171.4% 171.4% 171.4% 143.6% 7.5%J. Crew Group, Inc. 15.5% 15.5% 23.1% 37.3% 34.6%Jo-Ann Stores, Inc. 33.7% 33.7% 32.6% 33.7% 48.1%King Pharmaceuticals, Inc. 40.4% 40.4% 40.3% 52.1% 65.7%LaserCard Corp. 37.7% 37.7% 39.8% 35.3% 34.4%Martek Biosciences Corp. 34.8% 34.8% 39.6% 42.7% 36.3%MatlinPatterson Global Advisers LLC (PolymerGroup, Inc.)-19.3% * -19.3% -15.5% -15.5% -9.2%Matrixx Initiatives, Inc. 70.9% 70.9% 68.6% 64.8% 69.2%McAfee, Inc. 60.4% 60.4% 60.2% 57.9% 45.8%Mediacom Communications Corp. 27.6% 27.6% 25.9% 21.0% 35.9%Mercer Insurance Group, Inc. 50.9% 50.9% 49.9% 54.0% 58.7%Microfluidics International Corp. 58.8% 58.8% 58.8% 68.8% 58.8%Monroe Bancorp 168.7% 168.7% 213.6% 221.3% 216.4%Nu Horizons Electronics Corp. 105.3% 105.3% 115.4% 116.7% 105.3%Occam Networks, Inc. 74.4% 74.4% 108.3% 65.7% 55.9%Optelecom-NKF, Inc. 54.7% 54.7% 87.0% 81.5% 69.0%Penn Virginia GP Holdings LP 9.4% 9.4% 11.1% 27.0% 25.9%Pinnacle Gas Resources, Inc. 28.3% 28.3% 17.2% 3.3% 3.0%Rock of Ages Corp. 55.6% 55.6% 50.4% 65.9% 68.3%Sonic Solutions, Inc. 27.1% 27.1% 34.5% 56.3% 33.8%Syniverse Holdings, Inc. 30.3% 30.3% 32.4% 29.0% 46.8%T-3 Energy Services, Inc. 64.9% 64.9% 73.0% 78.8% 69.5%The Cypress Group LLC (CPI International, Inc.(California))34.8% 34.8% 32.7% 39.3% 38.4%Todd Shipyards Corp. 6.0% 6.0% 10.0% 23.2% 37.6%United PanAm Financial Corp. 41.0% 41.0% 39.6% 35.6% 51.6%* Not used in average or median calculations.www.mergerstat.com 48
Mergerstat Control Premium Study3rd Quarter <strong>2011</strong>Target NameMergerstatUnaffectedControlPremiumPremium1 DayPremium1 WeekPremium1 MonthPremium2 MonthsRange: High 224.0% 224.0% 224.0% 221.3% 362.9%Low -19.3% -19.3% -15.5% -15.5% -9.2%Median: 46.3% 40.4% 40.3% 49.8% 52.2%Average: 60.8% 55.3% 61.2% 65.2% 68.1%* Not used in average or median calculations.www.mergerstat.com 49
Mergerstat Control Premium Study3rd Quarter <strong>2011</strong>Mergerstat Unaffected Control Premium (International)Target NameMergerstatUnaffectedControlPremiumPremium1 DayPremium1 WeekPremium1 MonthPremium2 MonthsA.S. Roma SpA -41.3% * -41.3% -41.7% -38.0% -36.2%AB Invalda / Baltic Pharma Ltd. (Sanitas AB) 83.4% 83.4% 82.1% 78.6% 99.6%AIM Health Group, Inc. 48.8% 48.8% 47.1% 66.7% 92.3%ATR Holdings, Inc. (Philippines) (ATR KimEngFinancial Corp.)13.8% 13.8% 13.8% 15.3% 13.8%Bridgewater Systems Corp. 29.5% 29.5% 34.4% 32.3% -5.7%BT Group PLC (Accel Frontline Ltd.) 2.4% 2.4% -1.5% 4.8% -2.8%Caledon Resources PLC 33.3% 33.3% 58.9% 86.7% 113.3%Camlin Ltd. 37.2% 39.0% 46.3% 57.9% 99.1%CAS Capital, Inc. (Kazokutei Co., Ltd.) 46.2% 46.2% 45.1% 44.2% 40.2%CBG Group PLC 54.2% 14.3% 12.3% 52.4% 52.4%Cellestis Ltd. 26.7% 26.7% 33.3% 38.2% 59.0%Centrebet International Ltd. 25.8% 11.4% 10.5% 20.5% 34.2%Charlie's Group Ltd. 57.1% 57.1% 63.0% 57.1% 46.7%Chartwell Technology, Inc. 50.1% 50.1% 55.8% 66.4% 71.0%Chaucer Holdings PLC 5.6% 3.1% 3.1% 4.6% -5.2%China Security & Surveillance Technology, Inc. 33.2% 33.2% 34.8% 24.7% 23.9%Cinch Energy Corp. 64.0% 64.0% 65.2% 83.9% 92.3%Crude Carriers Corp. -17.2% * -17.2% -16.7% -32.2% -33.9%Crystal Amber Fund Ltd. (Pinewood SheppertonPLC)22.1% 22.1% 27.8% 32.4% 52.5%Culane Energy Corp. 35.7% 35.7% 37.3% 37.3% 33.3%Daiwa Securities Group Inc. (GABA Corp.) 49.0% 49.0% 50.0% 58.4% 100.8%Dawson Holdings PLC 109.5% 24.2% 74.8% 111.3% 124.8%Delachaux SA 23.9% 25.4% 23.9% 30.1% 46.7%Demag Cranes AG 53.5% 25.4% 27.2% 25.7% 28.7%Dundee Corp. (Breakwater Resources Ltd.) 44.2% 44.2% 47.3% 47.6% 26.1%ECT Industries SA 44.8% 44.8% 44.6% 35.0% 33.2%EDT Retail Trust 28.6% 28.6% 26.8% 21.6% 28.6%Education Development International PLC 61.3% 61.3% 56.3% 53.3% 91.4%eFront SA 62.2% 62.2% 80.0% 73.1% 56.5%ElektronikGruppen BK AB 31.0% 31.0% 31.0% 31.0% 13.8%elexis AG 20.6% 20.6% 19.9% 46.2% 48.4%* Not used in average or median calculations.Copyright © 2012, FactSet Mergerstat, LLC. All rights reserved. 50
Mergerstat Control Premium Study3rd Quarter <strong>2011</strong>Target NameMergerstatUnaffectedControlPremiumPremium1 DayPremium1 WeekPremium1 MonthPremium2 MonthsEquinox Minerals Ltd. 42.7% 8.7% 8.7% 49.3% 30.0%Forever Prosperous Pte Ltd. (PT Royal OakDevelopment Asia Tbk)0.0% 0.0% 0.0% 0.0% 0.0%Forzani Group Ltd. 50.5% 50.5% 43.8% 53.9% 49.6%Frankland River Olive Co. Ltd. 50.0% 50.0% 50.0% 50.0% 9.1%Gerako Oy (Tekla Oyj) 51.5% 51.5% 49.4% 49.4% 58.7%Goldstone Resources, Inc. 50.3% 50.3% 46.1% 38.3% 20.6%Goto Co., Ltd. 77.1% 77.1% 77.9% 83.7% 75.6%Government of Serbia (Paracinka AD) 53.2% 35.7% 53.2% 53.2% 18.8%Henkel AG & Co. KGaA (Henkel India Ltd.) -52.9% * -41.1% -44.9% -52.9% -45.0%Holidaybreak PLC 35.5% 5.0% 44.0% 49.0% 58.3%HPI Resources Bhd. 12.0% 12.0% 39.2% 32.9% 25.7%Icron Technologies Corp. 42.1% 49.3% 32.5% 54.5% 17.8%Ignis ASA 58.4% 58.4% 63.9% 60.0% 63.9%Impera Total Return AG 46.5% 46.5% 35.6% 10.0% -7.6%Indian Energy Ltd. 5.3% 1.2% 5.3% 1.2% 3.2%IntraPower Ltd. 114.3% 114.3% 114.3% 100.0% 100.0%iSOFT Group Ltd. 226.9% 226.9% 226.9% 203.6% 136.1%ITOCHU Corp. (NANO Media Inc.) 12.7% 12.7% 0.0% -5.7% 25.6%Japan Fine Arts KK (Kojitu Co., Ltd.) 17.1% 17.1% 16.1% 46.1% 42.9%Kawashima Selkon Textiles Co., Ltd. 14.3% 14.3% 8.8% 3.8% 29.7%KH Investment Holdings Ltd. 4.2% 4.2% 0.0% 2.0% 3.7%Korea Value Asset Management Co., Ltd. (HyundaiDSF Co., Ltd.)23.7% 23.7% 30.7% 37.2% 30.7%KS Energy Ltd. 10.9% 10.9% 10.3% 15.1% 2.9%Liquidation World, Inc. -45.5% * -45.5% -71.4% -85.9% -87.8%MagIndustries Corp. 53.4% 53.4% 53.0% 54.0% 7.2%Mamut ASA 9.1% 9.1% 76.0% 71.4% 44.6%Maspro Denkoh Corp. 63.4% 63.4% 62.9% 70.4% 67.7%Minerva PLC 53.5% 21.4% 26.8% 36.2% 34.6%Moria SA 13.4% 13.4% 13.4% 30.3% 13.4%Nippon Kagaku Yakin Co., Ltd. 42.9% 42.9% 40.8% 38.9% 33.3%Niscayah Group AB 46.9% 14.6% 12.5% 7.1% 48.1%Northern Energy Corp. Ltd. 90.5% 79.4% 102.0% 127.3% 86.0%* Not used in average or median calculations.www.mergerstat.com 51
Mergerstat Control Premium Study3rd Quarter <strong>2011</strong>Target NameMergerstatUnaffectedControlPremiumPremium1 DayPremium1 WeekPremium1 MonthPremium2 MonthsOFI Private Equity Capital SCA -13.4% * -13.4% -13.4% -11.3% -11.4%Ondine Biomedical, Inc. 65.0% 65.0% 43.5% 26.9% -10.8%Orient Garments Ltd. -37.0% * -37.7% -36.8% NA NAOSK Property Holdings Bhd. 9.4% 9.4% 16.8% 15.2% 28.9%Outremer Télécom SA 7.6% 7.6% 8.1% 9.7% 19.5%Paradise Capital Holding Co. (Olympic Group forFinancial Investments Co.)35.1% 35.1% 42.4% 52.7% 59.3%Parmalat SpA 12.5% 12.5% 14.9% 9.2% 18.5%Portek International Ltd. 6.1% 6.1% 16.2% 15.7% 110.5%Praesepe PLC 20.9% 20.9% 13.3% 2.6% -4.6%Proservia SA 30.8% 32.0% 33.2% 43.9% 20.4%Pulai Springs Bhd. 31.1% 31.1% 29.7% 136.0% 237.1%Quintec SA 47.1% 47.1% 47.1% 43.1% 36.4%Rank Group PLC 2.1% 2.1% -0.5% 0.9% 15.1%Rhodia SA 50.0% 50.0% 56.7% 54.8% 44.9%Russian Railways OJSC (TransCreditBank JSC) 4.3% 4.3% 10.9% 18.2% 19.9%SäkI AB 4.4% -0.3% 0.1% 5.2% -4.5%Safari Industries (India) Ltd. 29.7% 29.7% 34.5% 44.7% 86.9%Satair A/S 23.4% 23.4% 31.8% 33.3% 36.1%SBI VeriTrans Co., Ltd. -30.5% * -30.5% -31.6% -32.1% -30.1%Schulthess Group AG 28.9% 28.9% 28.5% 39.7% 46.8%Scottish Re Group Ltd. 81.8% 81.8% 76.5% 87.5% 100.0%Shanghai Bailian Group Co. Ltd. 16.4% 16.4% 16.4% 16.4% 16.4%Siam Industrial Credit Public Co. Ltd. 60.2% 60.2% 60.2% 49.1% 64.0%Sical Logistics Ltd. -9.7% * -9.7% 4.7% 22.5% 20.5%SIIC Shanghai Holding Co. Ltd. (Shanghai IndustrialDevelopment Co. Ltd.)-8.5% * -8.5% -8.5% -8.5% -12.5%silex technology, Inc. 73.1% 73.1% 73.1% 78.5% 64.1%Solvay SA (Solvay Pharma India Ltd.) -17.6% * -17.6% -20.7% -23.9% -19.2%Sunway City Bhd. 13.6% 13.6% 25.9% 27.5% 30.8%Sunway Holdings Bhd. 15.6% 15.6% 30.0% 31.3% 45.3%Synergi Solutions AS 54.3% 54.3% 54.3% 54.3% 54.3%Telvent GIT SA 40.2% 16.1% 24.1% 34.0% 36.0%Territory Resources Ltd. 203.0% 6.4% 8.7% 112.8% 66.7%* Not used in average or median calculations.www.mergerstat.com 52
Mergerstat Control Premium Study3rd Quarter <strong>2011</strong>Target NameMergerstatUnaffectedControlPremiumPremium1 DayPremium1 WeekPremium1 MonthPremium2 MonthsThe Capital Pub Co. PLC 80.1% 11.6% 17.2% 22.7% 47.3%Tognum AG 40.5% 12.0% 42.4% 39.9% 33.5%Tohken Co., Ltd. 29.9% 29.9% 42.0% 38.3% 18.3%Tong Yang Magic Co., Ltd. 31.1% 31.1% 25.4% 23.7% 21.5%Torque Energy, Inc. 56.3% 56.3% 75.4% 85.2% 56.3%Uniq PLC 28.0% 25.5% 24.5% 26.3% 28.9%United Securities Public Co., Ltd. 36.1% 36.1% 32.9% 36.1% 50.8%Valad Property Group 55.8% 55.8% 55.2% 52.5% 53.8%Verigy Ltd. 68.4% 64.1% 72.8% 59.3% 89.0%WebMoney Corp. 19.5% 19.5% 13.8% 20.5% 55.7%Yash Trading & Finance Ltd. 2.2% 2.2% 2.2% 2.2% 2.2%Zuken, Inc. / Kenny B YK (Chip One Stop, Inc.) 175.3% 175.3% 201.0% 210.7% 201.8%Actiease Assets Ltd. (Sam Woo Holdings Ltd.) -26.1% * -26.1% -23.9% -22.7% -30.1%AH Medical Properties PLC 226.9% 226.9% 226.9% 210.7% 237.1%AI Jaber Transport & General Contracting LLC(United Bank Ltd.)-52.9% -45.5% -71.4% -85.9% -87.8%Allied Irish Banks PLC (Bank Zachodni WBK SA) 15.2% 15.2% 19.5% 24.7% 15.5%Aloka Co., Ltd. 36.1% 25.5% 31.8% 37.2% 33.8%Amtek India Ltd. 42.9% 30.4% 33.8% 39.2% 40.4%ASA Group Holdings Ltd. 92.1% 92.1% 94.0% 92.1% 90.2%Asset Management Investment Co. PLC 9.8% 9.8% 9.8% 8.1% 11.5%ASTRA Capital Ltd. 47.1% 45.6% 36.4% 33.9% 13.6%Atlan Holdings Bhd. (DFZ Capital Bhd.) -8.3% * -8.3% -11.8% -26.7% -30.2%Avoca Resources Ltd. -0.7% * -0.7% 4.7% 17.9% 28.5%AXA SA (AXA Asia Pacific Holdings Ltd.) 52.5% 13.5% 18.2% 27.1% 26.6%Barnard Jacobs Mellet Holdings Ltd. 18.1% 18.1% 12.5% 23.3% 25.0%Biocompatibles International PLC 31.6% 28.1% 29.4% 41.3% 39.9%BM Invest SAS (Duc Lamothe Participations SA) 14.6% 14.6% 14.6% 14.6% 14.6%BNP Paribas SA (Fortis Bank AS) 69.8% 12.6% 15.1% -0.9% 6.8%Brío de Colombia SA 16.6% 16.6% 16.6% 80.5% 80.5%BV! Media, Inc. 110.5% 110.5% 112.8% 90.5% 95.1%bwin Interactive Entertainment AG -24.3% * -24.3% -25.0% -25.6% -28.5%Chemistry Communications Group PLC 134.9% 134.9% 159.6% 190.2% 190.2%* Not used in average or median calculations.www.mergerstat.com 53
Mergerstat Control Premium Study3rd Quarter <strong>2011</strong>Target NameMergerstatUnaffectedControlPremiumPremium1 DayPremium1 WeekPremium1 MonthPremium2 MonthsCHRYSALIS PLC 1.1% 1.1% 0.0% 45.5% 56.1%Citadel Resource Group Ltd. 27.1% 27.1% 30.1% 40.3% 74.2%Clapham House Group PLC 31.0% 8.0% 8.0% 4.2% 29.8%Clever Communications Australia Ltd. 29.4% 29.4% 25.7% 31.3% 49.2%Clyde Process Solutions PLC 14.3% 14.3% 10.5% 29.5% 59.4%Crucell NV 57.7% 57.7% 58.6% 57.0% 64.6%Culture Convenience Club Co., Ltd. 32.7% 32.7% 27.1% 25.5% 47.1%Dalsa Corp. 25.9% 25.9% 26.7% 33.2% 52.0%Dominion Mining Ltd. 9.0% 9.0% 7.1% 18.6% 44.5%Draka Holding NV 23.0% 22.1% 22.0% 21.5% 60.0%DundeeWealth, Inc. -1.7% * -1.7% 4.6% 19.8% 39.2%Eastern Asia Technology Ltd. 31.4% 31.4% 45.3% 53.3% 45.3%Enoteca Co., Ltd. 47.1% 47.1% 43.9% 84.9% 100.7%Essa Australia Ltd. 32.7% 32.7% 37.7% 30.4% 94.7%Eurand NV 9.4% 9.4% 10.5% 16.5% 26.6%F-One Ltd. 30.4% 30.4% 27.7% 30.4% 27.7%Farallon Mining Ltd. 23.1% 23.1% 21.2% 42.9% 95.1%Galaxy Far East Corp. 0.9% 0.9% 0.6% -1.2% 22.7%Giralia Resources NL 93.1% 93.1% 95.1% 95.8% 108.5%Gold Pak Co., Ltd. 40.3% 40.3% 41.6% 62.6% 59.3%Hebei Taihang Cement Co. Ltd. 24.0% 24.0% 24.0% 24.0% 23.4%Hing Yiap Group Bhd. -14.8% * -15.3% -13.3% -11.8% -6.8%Honda Motor Co. Ltd. (Hero Honda Motors Ltd.) -54.4% * -54.4% -57.7% -59.2% -58.9%HSBC Holdings PLC (Arnhold Holdings Ltd.) -51.9% * -51.9% -53.8% -44.4% -17.7%Iberia Líneas Aéreas de España SA 71.5% 71.5% 78.3% 53.6% 74.3%Impress Energy Ltd. 9.0% 9.0% 3.7% 51.8% 73.5%ING Groep NV (ING Industrial Fund) 17.0% 17.0% 12.1% 12.1% 15.7%Interlink Petroleum Ltd. -15.3% * -15.3% -7.2% 12.9% 19.8%International Power PLC -69.0% * -67.7% -67.8% -69.5% -67.9%Invoice, Inc. 19.0% 19.0% 36.6% 53.1% 38.2%iseemedia, Inc. 1,532.5% 1,532.5% 1,633.6% 1,406.9% 1,765.7%Jaya Holdings Ltd. -27.3% * -26.7% -28.4% -34.2% -33.3%Justice KK (Image Holdings Co., Ltd.) 10.2% 10.2% 17.2% 23.6% 34.2%* Not used in average or median calculations.www.mergerstat.com 54
Mergerstat Control Premium Study3rd Quarter <strong>2011</strong>Target NameMergerstatUnaffectedControlPremiumPremium1 DayPremium1 WeekPremium1 MonthPremium2 MonthsKuraki Co., Ltd. 70.0% 70.0% 77.1% 78.9% 82.8%Laguna Resources NL 26.7% 26.7% 26.7% 72.7% 90.0%LE Lundbergföretagen AB (Cardo AB) 48.4% 48.4% 44.8% 60.3% 54.7%Michael Hill International Ltd. -1.1% * -1.1% 2.3% 9.8% 12.5%Nestor Healthcare Group PLC 43.8% 39.8% 57.9% 89.9% 99.1%O-M Ltd. 46.7% 46.7% 53.4% 65.6% 93.5%Oriental City Group PLC (Oriental City GroupHoldings Ltd.)* Not used in average or median calculations.-80.4% * -80.4% -80.4% -83.6% -90.9%Pareto Corp. 0.7% 0.7% 8.8% 13.8% 17.7%Parkbridge Lifestyle Communities, Inc. 30.4% 30.4% 32.0% 39.8% 42.0%Patni Computer Systems Ltd. 9.4% 9.4% 7.2% 11.1% 5.2%Petrolifera Petroleum Ltd. 34.4% 32.6% 53.7% 58.7% 64.1%Pharmaniaga Bhd. 12.7% 12.7% 7.5% 10.6% 20.0%Provet Holdings Ltd. 35.4% 35.4% 33.8% 33.8% 50.7%PT AKR Corporindo Tbk (PT Sorini Agro Asia Corp.Tbk)6.9% 6.9% 11.1% 12.9% 21.7%Q-Med AB 19.2% 19.2% 18.4% 35.6% 5.3%Qinghai Salt Lake Industry Group Co. Ltd. -35.7% * -35.7% -35.7% -35.7% -35.7%Quadra FNX Mining Ltd. (Gold Wheaton GoldCorp.)19.4% 19.4% 11.5% 36.5% 60.9%Realex Properties Corp. 3.1% 3.1% 4.6% 6.2% 13.7%Ross Human Directions Ltd. 82.9% 10.3% 8.7% 4.2% 11.9%S.P. Suzuki Public Co. Ltd. 1.9% 1.9% 1.9% 1.9% 220.8%Sazaby League Ltd. 44.0% 44.0% 43.6% 36.7% 47.6%SeLoger.com SA 31.2% 26.8% 27.3% 26.4% 26.8%Siam Commercial Bank Public Co. Ltd. (DhanamitrFactoring PCL)15.4% 15.4% 15.4% 27.7% 42.9%Siemens AG (Siemens Healthcare Diagnostics Ltd.) 44.4% 44.4% 39.7% 66.7% 46.8%SNAI SpA -10.4% * -10.2% -11.8% -12.4% -7.4%Spescom Ltd. (South Africa) 2.5% 2.5% 2.5% -3.2% 10.6%Stellar Group Co., Ltd. 50.0% 50.0% 50.0% 50.0% 50.0%Straits Resources Ltd. /Old/ -11.3% * -11.3% -10.9% -7.0% 0.9%Subsea 7, Inc. 66.8% 66.8% 70.0% 82.1% 31.3%Tanaka Galvanizing Co., Ltd. 41.8% 41.8% 42.9% 48.1% 29.9%Thomson Medical Centre Ltd. 62.0% 62.0% 73.3% 81.3% 108.3%www.mergerstat.com 55
Mergerstat Control Premium Study3rd Quarter <strong>2011</strong>Target NameMergerstatUnaffectedControlPremiumPremium1 DayPremium1 WeekPremium1 MonthPremium2 MonthsTinci Holdings Ltd. 126.3% 126.3% 101.5% 112.4% 103.7%Tong Yang Securities, Inc. / Tong Yang Capital Co. /Tong Yang Financial Services Corp. (Tong YangLife Insurance Co. Ltd.)48.1% 40.6% 45.7% 49.4% 47.5%Voltaire Ltd. 36.1% 36.1% 40.6% 30.9% 47.6%Wellstream Holdings PLC 29.1% 0.8% 4.0% 41.4% 51.6%Wimm-Bill-Dann Foods OJSC 79.9% 79.9% 99.4% 116.8% 167.5%Wonder Star Securities Ltd. / Top Source SecuritiesLtd. (KTP Holdings Ltd.)-36.1% * -36.1% -37.0% 9.7% 22.3%Works Applications Co., Ltd. 34.1% 34.1% 35.0% 30.2% 37.5%Yamashin Ltd. (Nihon Parking Corp.) 29.0% 29.0% 30.2% 39.7% 35.7%Yokogawa Electric Corp. (Kokusai Chart Corp.) -4.6% * -4.6% -6.0% -2.9% -2.7%Range: High 1,532.5% 1,532.5% 1,633.6% 1,406.9% 1,765.7%Low -80.4% -80.4% -80.4% -83.6% -90.9%Median: 30.4% 19.1% 18.9% 29.9% 37.9%Average: 56.4% 37.8% 40.4% 45.1% 58.2%* Not used in average or median calculations.www.mergerstat.com 56
Mergerstat Control Premium Study3rd Quarter <strong>2011</strong>Target Financials (Domestic)($ in Millions)Target NameTargetTICTargetSalesTargetIncomeTargetBook ValueTargetEBITTargetEBITDABJ's Wholesale Club, Inc. 3,879.1 11,134.4 157.3 1,191.1 245.3 375.2Blackstone Group LP (Graham Packaging Co., Inc.) 4,504.3 2,683.7 142.6 -1,357.3 289.3 474.8Bucyrus International, Inc. 8,981.9 3,059.2 267.3 446.2 442.5 540.4California Pizza Kitchen, Inc. 454.8 641.5 25.3 187.7 21.0 57.9Citadel Broadcasting Corp. 10,812.6 740.9 68.7 507.0 176.6 217.6Danvers Bancorp, Inc. 889.2 132.4 18.2 252.2 56.7 58.6EMS Technologies, Inc. 545.6 357.4 16.2 163.8 18.9 38.2EnergyConnect Group, Inc. 30.7 31.6 -0.3 3.4 1.3 2.4Fremont Michigan InsuraCorp, Inc. 64.5 66.8 2.7 50.9 3.8 4.8Frontier Oil Corp. 4,752.9 5,884.9 37.8 985.5 86.2 191.0Gerber Scientific, Inc. 302.7 462.5 7.9 83.6 9.9 17.6Global Traffic Network, Inc. 266.7 117.4 8.9 51.7 13.5 19.5GS Financial Corp. 107.6 15.7 0.4 27.7 4.9 5.2Hypercom Corp. 575.4 421.2 0.3 12.5 10.1 29.1Immucor, Inc. 1,899.9 333.1 89.3 421.0 130.7 148.9Integral Systems, Inc. (Maryland) 239.7 197.7 -9.8 21.6 -13.8 -4.3K-Sea Transportation Partners LP 343.2 261.6 -30.1 329.6 -5.5 54.5Kendle International, Inc. 362.8 434.6 4.7 -14.8 10.1 27.9KKR & Co. LP (PRIMEDIA, Inc.) 523.6 227.0 23.0 -235.8 48.0 66.1L-1 Identity Solutions, Inc. 1,587.8 645.0 -5.6 -255.6 4.8 44.0Lawson Software, Inc. 2,074.9 755.2 51.3 -54.5 83.0 138.8Legacy Bancorp, Inc. 125.3 42.2 -7.2 102.2 5.0 7.3M. D. Sass Investors Services, Inc. (Sterling Chemicals,Inc.)111.5 99.0 3.2 -151.2 13.6 26.0Marshall & Ilsley Corp. 9,661.3 2,255.4 -640.6 5,851.9 -432.2 -381.8MediaMind Technologies, Inc. 415.9 83.7 10.0 129.8 13.7 16.2MidCarolina Financial Corp. 53.7 26.4 1.1 42.0 10.0 10.5National Semiconductor Corp. 7,113.5 399.6 342.7 581.4 507.0 591.8Nationwide Health Properties, Inc. 6,772.9 439.3 137.1 2,169.9 232.9 369.8Nobel Learning Communities, Inc. 125.2 238.6 3.3 -20.3 6.8 16.1Ophthalmic Imaging Systems, Inc. 32.4 13.5 -2.5 -0.7 -2.3 -2.0optionsXpress Holdings, Inc. 844.0 195.8 52.0 14.9 80.3 89.2Orange Community Bancorp 30.0 11.9 1.0 22.2 3.0 3.0Petrohawk Energy Corp. 15,557.9 1,895.8 -2.0 2,652.0 416.1 1,020.7Radiant Systems, Inc. 1,150.0 182.9 28.1 140.3 39.0 57.2Copyright © 2012, FactSet Mergerstat, LLC. All rights reserved. 57
Mergerstat Control Premium Study3rd Quarter <strong>2011</strong>($ in Millions)Target NameTargetTICTargetSalesTargetIncomeTargetBook ValueTargetEBITTargetEBITDASAVVIS, Inc. 3,035.1 973.4 -35.7 106.8 36.8 227.6Servidyne, Inc. 18.9 25.7 -2.0 4.4 -2.5 -1.6SFN Group, Inc. 919.3 2,088.9 33.2 272.1 47.8 69.9SMART Modular Technologies (WWH), Inc. 641.4 806.8 50.4 318.6 76.6 97.6SRA International, Inc. 1,794.9 1,740.7 81.4 292.3 128.3 156.4Sterling Bancshares, Inc. 949.2 238.9 0.7 439.2 34.6 43.9The Lubrizol Corp. 9,996.7 5,417.8 773.6 1,128.5 1,101.4 1,270.4Timberland Co. 3,337.4 1,461.4 91.2 597.2 134.6 159.6Vaughan Foods, Inc. 26.5 97.7 -1.3 7.7 -1.3 0.9Warner Music Group Corp. 3,236.0 2,869.0 -157.0 -2,591.0 61.0 320.0Zoran Corp. 448.6 357.3 -47.6 347.7Sonic Solutions, Inc. 448.0 103.5 -2.9 41.0 -3.8 -1.8Syniverse Holdings, Inc. 2,673.2 618.6 83.2 -196.4 167.9 244.2T-3 Energy Services, Inc. 597.1 200.0 13.1 137.2 18.9 28.2The Cypress Group LLC (CPI International, Inc.(California))522.8 360.4 26.7 -50.8 47.5 56.9Todd Shipyards Corp. 128.9 249.3 14.5 82.7 22.1 26.6United PanAm Financial Corp. 118.1 63.5 -5.6 130.6 9.7 9.7www.mergerstat.com 58
Mergerstat Control Premium Study3rd Quarter <strong>2011</strong>Target Financials (International)($ in Millions)Target NameTargetTICTargetSalesTargetIncomeTargetBook ValueTargetEBITTargetEBITDAA.S. Roma SpA 171.0 211.5 -48.7 -134.2 -40.9 -6.3AB Invalda / Baltic Pharma Ltd. (Sanitas AB) 524.9 145.7 22.5 37.7 36.8 49.5AIM Health Group, Inc. 38.4 60.9 2.0 3.4 1.6 2.5ATR Holdings, Inc. (Philippines) (ATR KimEngFinancial Corp.)121.4 33.9 8.3 68.7 11.0 11.7Bridgewater Systems Corp. 208.4 89.8 19.8 96.2 27.7 29.0BT Group PLC (Accel Frontline Ltd.) 15.7 0.1 2.3 0.0 0.0 0.0Caledon Resources PLC 445.9 77.6 -12.5 96.0 -17.1 -11.3Camlin Ltd. 52.6 732.7 17.6 12.5 39.7 53.0CAS Capital, Inc. (Kazokutei Co., Ltd.) 88.4 115.0 -0.3 51.8 0.6 6.9CBG Group PLC 14.4 12.2 0.4 -4.0 -0.1 1.2Cellestis Ltd. 373.5 45.7 9.4 28.0 12.3 12.8Centrebet International Ltd. 198.6 77.1 10.9 8.4 15.4 19.1Charlie's Group Ltd. 109.7 28.8 1.4 6.9 2.4 3.2Chartwell Technology, Inc. 23.5 10.4 -9.4 18.4 -9.3 -8.4Chaucer Holdings PLC 555.3 1,250.6 36.1 458.6 59.7 63.1China Security & Surveillance Technology, Inc. 924.2 706.8 79.9 553.3 109.5 123.0Cinch Energy Corp. 234.0 27.7 -7.5 130.4 -9.6 11.0Crude Carriers Corp. 269.3 55.9 9.9 277.7 13.6 14.2Crystal Amber Fund Ltd. (Pinewood Shepperton PLC) 217.4 69.0 6.7 110.4 14.4 20.4Culane Energy Corp. 88.9 20.0 -3.2 51.9 -4.1 5.5Daiwa Securities Group Inc. (GABA Corp.) 114.6 107.4 10.0 12.2 18.5 20.7Dawson Holdings PLC 27.9 121.7 1.2 -4.8 2.2 3.4Delachaux SA 1,713.8 1,009.0 92.5 232.4 144.1 157.4Demag Cranes AG 1,547.6 1,412.6 41.9 185.8 83.4 115.4Dundee Corp. (Breakwater Resources Ltd.) 614.3 346.6 96.7 431.8 96.2 123.0ECT Industries SA 23.6 4.7 2.0 13.0 2.6 2.6EDT Retail Trust 1,365.4 184.8 49.2 543.0 105.2 113.6Education Development International PLC 182.7 47.4 11.7 15.5 15.0 16.6eFront SA 74.6 32.3 3.9 21.3 5.3 6.3ElektronikGruppen BK AB 47.3 151.0 2.7 10.9 4.3 7.4elexis AG 299.6 209.8 17.7 64.1 22.2 37.3Equinox Minerals Ltd. 7,950.5 996.6 294.7 1,976.9 486.8 577.3Copyright © 2012, FactSet Mergerstat, LLC. All rights reserved. 59
Mergerstat Control Premium Study3rd Quarter <strong>2011</strong>($ in Millions)Target NameTargetTICTargetSalesTargetIncomeTargetBook ValueTargetEBITTargetEBITDAForever Prosperous Pte Ltd. (PT Royal OakDevelopment Asia Tbk)354.7 4.3 -1.2 153.1 -0.9 -0.9Forzani Group Ltd. 868.5 1,463.1 34.2 214.4 54.3 106.5Frankland River Olive Co. Ltd. 9.3 4.9 -2.0 22.6 -1.5 -0.9Gerako Oy (Tekla Oyj) 477.9 86.1 2.9 46.8 18.0 20.5Goldstone Resources, Inc. 110.5 0.0 -0.9 43.2 -2.7 -2.6Goto Co., Ltd. 56.4 141.7 2.0 129.6 3.6 5.9Government of Serbia (Paracinka AD) 1.9 4.6 -0.4 3.7 -0.2 -0.1Henkel AG & Co. KGaA (Henkel India Ltd.) 26.9 116.4 -12.4 0.0 -5.2 -3.8Holidaybreak PLC 789.4 708.2 -11.9 -111.0 3.6 32.0HPI Resources Bhd. 129.1 143.0 9.0 57.5 12.6 17.2Icron Technologies Corp. 12.0 12.0 1.2 6.1 1.2 1.2Ignis ASA 133.0 51.4 -1.4 17.8 -0.4 2.7Impera Total Return AG 9.5 1.6 -2.1 10.9 -2.1 -2.1Indian Energy Ltd. 40.8 4.8 -2.9 20.1 -0.7 1.0IntraPower Ltd. 15.5 27.5 0.3 0.7 0.7 0.7iSOFT Group Ltd. 682.0 412.4 -507.9 -217.6 -465.2 -12.1ITOCHU Corp. (NANO Media Inc.) 19.4 28.8 -3.1 35.6 -3.1 -2.6Japan Fine Arts KK (Kojitu Co., Ltd.) 48.8 129.8 0.9 0.0 1.5 4.4Kawashima Selkon Textiles Co., Ltd. 230.0 533.1 -18.1 63.5 -14.3 -3.2KH Investment Holdings Ltd. 16,230.7 4.7 -16.7 13.0 -16.4 -16.2Korea Value Asset Management Co., Ltd. (HyundaiDSF Co., Ltd.)118.9 90.7 19.5 147.8 25.9 31.6KS Energy Ltd. 599.0 395.6 -47.0 263.0 -34.1 -2.0Liquidation World, Inc. 13.5 150.6 -31.4 -2.3 -29.5 -24.3MagIndustries Corp. 150.7 22.9 -42.6 106.0 -37.6 -30.8Mamut ASA 169.5 90.6 3.1 11.7 4.7 4.7Maspro Denkoh Corp. 1,120.1 498.2 45.0 385.7 75.2 88.5Minerva PLC 1,712.8 23.6 47.5 54.5 115.1 115.2Moria SA 162.5 67.6 8.2 29.4 14.6 16.6Nippon Kagaku Yakin Co., Ltd. 13.9 16.1 -2.9 9.9 -2.6 -2.2Niscayah Group AB 1,198.7 996.6 39.2 -89.1 77.8 104.1Northern Energy Corp. Ltd. 252.2 0.6 -1.0 53.4 -1.0 -1.0www.mergerstat.com 60
Mergerstat Control Premium Study3rd Quarter <strong>2011</strong>($ in Millions)Target NameTargetTICTargetSalesTargetIncomeTargetBook ValueTargetEBITTargetEBITDAOFI Private Equity Capital SCA 119.2 480.2 -23.4 138.7 16.4 16.4Ondine Biomedical, Inc. 4.4 0.4 -4.0 -1.1 -4.0 -3.7Orient Garments Ltd. 20.0 30.4 0.8 5.0 1.7 2.1OSK Property Holdings Bhd. 93.0 58.2 8.5 108.7 12.4 12.6Outremer Télécom SA 435.2 269.0 20.2 35.4 28.0 65.3Paradise Capital Holding Co. (Olympic Group forFinancial Investments Co.)599.0 458.7 33.0 154.7 48.7 48.7Parmalat SpA 6,487.7 6,345.7 407.1 3,442.3 543.1 754.7Portek International Ltd. 176.4 96.6 11.3 41.3 18.7 25.9Praesepe PLC 119.7 35.6 -1.0 -48.1 1.3 4.2Proservia SA 42.1 64.4 1.5 21.5 3.5 5.5Pulai Springs Bhd. 23.5 16.0 -0.9 42.8 0.6 2.5Quintec SA 125.5 197.9 0.9 37.0 3.7 13.1Rank Group PLC 1,254.6 872.2 61.2 -143.7 95.6 144.2Rhodia SA 7,390.0 8,090.5 480.1 -1,243.3 1,123.0 1,503.2Russian Railways OJSC (TransCreditBank JSC) 4,070.2 1,172.4 277.8 1,079.2 925.8 925.8SäkI AB 712.4 24.1 29.5 397.6 37.9 0.0Safari Industries (India) Ltd. 11.0 17.6 0.4 0.0 1.4 1.4Satair A/S 512.4 380.3 19.1 93.5 29.7 63.8SBI VeriTrans Co., Ltd. 85.3 76.2 9.0 29.1 15.4 18.1Schulthess Group AG 908.5 365.4 22.5 159.3 32.8 48.7Scottish Re Group Ltd. 311.7 819.0 158.9 161.7 161.7 162.1Shanghai Bailian Group Co. Ltd. 3,083.0 1,868.9 111.0 675.7 166.2 166.2Siam Industrial Credit Public Co. Ltd. 133.9 40.3 14.0 137.4 26.8 28.1Sical Logistics Ltd. 68.0 122.5 3.3 72.6 6.7 6.9SIIC Shanghai Holding Co. Ltd. (Shanghai IndustrialDevelopment Co. Ltd.)2,020.0 351.4 42.9 390.5 71.2 0.0silex technology, Inc. 32.5 49.6 -1.7 23.3 -1.4 1.9Solvay SA (Solvay Pharma India Ltd.) 244.4 63.1 7.1 0.0 18.0 19.0Sunway City Bhd. 1,020.8 707.0 496.3 768.9 533.5 533.5Sunway Holdings Bhd. 737.1 686.5 33.9 256.9 55.1 55.1Synergi Solutions AS 120.6 9.0 0.7 3.0 1.1 1.2Telvent GIT SA 1,798.0 1,044.8 62.0 -153.8 92.6 143.8www.mergerstat.com 61
Mergerstat Control Premium Study3rd Quarter <strong>2011</strong>($ in Millions)Target NameTargetTICTargetSalesTargetIncomeTargetBook ValueTargetEBITTargetEBITDATerritory Resources Ltd. 164.0 188.4 33.5 59.8 36.6 52.9The Capital Pub Co. PLC 146.9 44.7 4.3 66.8 8.7 10.4Tognum AG 5,441.9 3,681.2 91.2 430.5 171.7 421.2Tohken Co., Ltd. 40.4 50.8 -1.3 16.9 -0.4 0.8Tong Yang Magic Co., Ltd. 139.8 313.7 -19.9 102.9 -14.0 2.0Torque Energy, Inc. 8.4 3.0 0.6 8.8 0.7 1.3Uniq PLC 193.6 474.6 -3.4 121.0 -2.5 12.7United Securities Public Co., Ltd. 31.4 7.7 0.6 47.7 1.0 1.4Valad Property Group 752.3 184.2 -100.7 281.0 -56.5 -46.1Verigy Ltd. 1,110.2 569.1 23.2 438.2 34.8 56.0WebMoney Corp. 236.8 935.2 11.6 37.5 17.7 18.2Yash Trading & Finance Ltd. 0.9 0.0 0.0 0.0 0.0 0.0Zuken, Inc. / Kenny B YK (Chip One Stop, Inc.) 88.1 41.2 2.7 0.0 4.7 5.6www.mergerstat.com 62
Mergerstat Control Premium Study3rd Quarter <strong>2011</strong>Target Multiples (Domestic)Target NameTargetP/SalesTargetP/IncomeTargetP/Book ValueTargetTIC/EBIT (1)TargetTIC/EBITDA (1)BJ's Wholesale Club, Inc. 0.3 24.2 3.2 * 15.8 10.3Blackstone Group LP (Graham Packaging Co., Inc.) 0.6 11.7 -1.2 * 15.6 9.5Bucyrus International, Inc. 2.4 28.0 16.7 * 20.3 16.6California Pizza Kitchen, Inc. 0.7 18.0 2.4 21.6 7.9Citadel Broadcasting Corp. 13.5 * 146.0 * 19.8 * 61.2 * 49.7 *Danvers Bancorp, Inc. 3.4 24.6 1.8 NMF * NMF *EMS Technologies, Inc. 1.4 31.2 3.1 28.9 14.3EnergyConnect Group, Inc. 1.0 -99.6 * 8.9 23.2 12.7Fremont Michigan InsuraCorp, Inc. 1.0 24.1 1.3 NMF * NMF *Frontier Oil Corp. 0.7 116.5 * 4.5 55.2 * 24.9Gerber Scientific, Inc. 0.6 35.8 3.4 30.5 17.2Global Traffic Network, Inc. 2.3 29.8 5.2 19.7 13.7GS Financial Corp. 4.6 177.4 * 2.6 NMF * NMF *Hypercom Corp. 1.2 1,728.1 * 41.1 * 57.0 * 19.8Immucor, Inc. 5.7 21.3 4.5 14.5 12.8Integral Systems, Inc. (Maryland) 1.0 -20.9 * 9.4 -17.4 * -55.9 *K-Sea Transportation Partners LP 0.3 -2.6 * 0.2 -62.7 * 6.3Kendle International, Inc. 0.5 48.5 * -15.4 * 36.1 * 13.0KKR & Co. LP (PRIMEDIA, Inc.) 1.4 13.8 -1.3 * 10.9 7.9L-1 Identity Solutions, Inc. 1.7 -201.6 * -4.4 * 332.0 * 36.1 *Lawson Software, Inc. 2.4 35.9 -33.8 * 25.0 15.0Legacy Bancorp, Inc. 2.9 -16.8 * 1.2 NMF * NMF *M. D. Sass Investors Services, Inc. (Sterling Chemicals,Inc.)0.07 2.2 -0.05 * 8.2 4.3Marshall & Ilsley Corp. 1.9 -6.7 * 0.7 NMF * NMF *MediaMind Technologies, Inc. 5.0 41.8 * 3.2 30.4 25.6 *MidCarolina Financial Corp. 1.1 26.1 0.7 NMF * NMF *National Semiconductor Corp. 15.2 * 17.7 10.4 * 14.0 12.0Nationwide Health Properties, Inc. 11.9 * 38.2 2.4 NMF * NMF *Nobel Learning Communities, Inc. 0.5 38.2 -6.2 * 18.6 7.8Ophthalmic Imaging Systems, Inc. 2.2 -11.6 * -43.5 * -13.9 * -16.4 *optionsXpress Holdings, Inc. 3.7 13.9 48.6 * NMF * NMF *(1) EBIT and EBITDA multiples are not meaningful for financial institutions.* Not used in range, average or median calculations.NA = Not availableNMF = Not meaningfulCopyright © 2012, FactSet Mergerstat, LLC. All rights reserved. 63
Mergerstat Control Premium Study3rd Quarter <strong>2011</strong>Target NameTargetP/SalesTargetP/IncomeTargetP/Book ValueTargetTIC/EBIT (1)TargetTIC/EBITDA (1)Orange Community Bancorp 2.5 29.2 1.4 NMF * NMF *Petrohawk Energy Corp. 6.2 -5,953.5 * 4.4 37.4 * 15.2Radiant Systems, Inc. 6.2 40.4 * 8.1 29.5 20.1SAVVIS, Inc. 2.3 -63.0 * 21.1 * 82.4 * 13.3Servidyne, Inc. 0.5 -6.3 * 2.9 -7.5 * -12.0 *SFN Group, Inc. 0.4 27.5 3.4 19.2 13.1SMART Modular Technologies (WWH), Inc. 0.7 11.6 1.8 8.4 6.6SRA International, Inc. 1.0 22.0 6.1 14.0 11.5Sterling Bancshares, Inc. 3.3 1,120.0 * 1.8 NMF * NMF *The Lubrizol Corp. 1.6 11.2 7.7 9.1 7.9Timberland Co. 2.3 36.2 5.5 24.8 20.9Vaughan Foods, Inc. 0.2 -11.3 * 1.9 -20.5 * 28.3 *Warner Music Group Corp. 0.4 -8.2 * -0.5 * 53.0 * 10.1Zoran Corp. 1.1 -8.6 * 1.2 NMF * NMF *Allegheny Energy, Inc. 1.3 11.0 1.6 9.6 7.2Allis-Chalmers Energy, Inc. 6.2 38.2 * 9.4 30.5 24.9American Community Bancorp, Inc. 0.07 2.2 0.2 8.2 * 4.3 *American Surgical Holdings, Inc. 1.5 13.4 6.0 8.8 8.7Applied Signal Technology, Inc. 1.3 24.4 3.0 19.2 12.8Arbinet Corp. 1.9 23.9 * 3.5 19.2 * 12.8 *Art Technology Group, Inc. 5.1 62.1 * 6.1 59.8 * 35.5 *Atlas Energy, Inc. 1.7 -44.1 * 2.5 25.2 11.2BakBone Software, Inc. 0.5 6.7 -0.3 * 16.9 11.1Baldor Electric Co. 1.8 44.9 * -4.5 * 19.2 14.4BMP Sunstone Corp. 2.5 200.1 * 8.5 49.3 * 36.1 *Cadence Financial Corp. 0.3 -3.2 * 0.3 NMF * NMF *California Oaks State Bank 22.2 * -242.8 * 10.0 NMF * NMF *Capital Bank Corp. 0.4 -0.9 * 0.3 NMF * NMF *Comm Bancorp, Inc. 2.3 19.4 1.4 NMF * NMF *CommScope, Inc. 0.9 18.4 93.5 * 14.3 8.5Compellent Technologies, Inc. 6.0 243.1 * 6.9 216.5 * 118.8 *Cypress Bioscience, Inc. 10.7 * 21.9 2.2 22.1 21.0Del Monte Foods Co. 1.0 14.1 -5.8 * 10.3 8.6(1) EBIT and EBITDA multiples are not meaningful for financial institutions.* Not used in range, average or median calculations.NA = Not availableNMF = Not meaningfulwww.mergerstat.com 64
Mergerstat Control Premium Study3rd Quarter <strong>2011</strong>Target NameTargetP/SalesTargetP/IncomeTargetP/Book ValueTargetTIC/EBIT (1)TargetTIC/EBITDA (1)Dynamex, Inc. 0.6 22.0 4.2 14.5 11.6First Franklin Corp. 1.6 -14.8 * 1.4 NMF * NMF *First Ipswich Bancorp 1.5 -30.0 * 0.9 NMF * NMF *First Mercury Financial Corp. 1.4 13.7 1.2 NMF * NMF *Genoptix, Inc. 2.2 19.4 2.1 10.0 9.2Herley Industries, Inc. 1.4 11.7 2.3 10.4 8.3InfoLogix, Inc. 0.5 -2.7 * -1.5 * -8.7 * -13.8 *J. Crew Group, Inc. 1.6 17.6 5.5 10.4 8.8Jo-Ann Stores, Inc. 0.9 19.9 3.2 12.6 9.2King Pharmaceuticals, Inc. 2.3 44.9 * 2.8 20.8 10.1LaserCard Corp. 1.5 22.2 2.5 19.3 11.6Martek Biosciences Corp. 2.3 16.8 3.1 12.4 8.8MatlinPatterson Global Advisers LLC (Polymer Group,Inc.)0.3 -206.6 * 2.8 18.7 8.3Matrixx Initiatives, Inc. 1.4 -27.7 * 1.5 -17.7 * -23.8 *McAfee, Inc. 3.6 36.9 17.5 * 28.9 17.1Mediacom Communications Corp. 0.2 0.5 -0.2 * 17.7 8.3Mercer Insurance Group, Inc. 1.4 13.4 1.1 NMF * NMF *Microfluidics International Corp. 0.8 163.7 * 9.4 27.3 22.8Monroe Bancorp 2.0 -79.9 * 1.6 NMF * NMF *Nu Horizons Electronics Corp. 0.2 22.5 0.9 12.5 11.0Occam Networks, Inc. 2.2 -71.7 * 3.6 -67.3 * 601.7 *Optelecom-NKF, Inc. 0.2 -1.9 * -2.4 * -4.5 * -6.4 *Penn Virginia GP Holdings LP 1.3 12.2 1.5 15.1 9.0Pinnacle Gas Resources, Inc. 0.7 -1.3 * 0.3 -2.3 * -8.8 *Rock of Ages Corp. 0.3 9.2 0.6 9.9 5.4Sonic Solutions, Inc. 4.3 -154.3 * 10.9 * -116.5 * -247.0 *Syniverse Holdings, Inc. 3.5 26.1 -11.0 * 15.9 10.9T-3 Energy Services, Inc. 3.0 45.4 * 4.4 31.6 21.2The Cypress Group LLC (CPI International, Inc.(California))0.9 12.3 -6.5 * 11.0 9.2Todd Shipyards Corp. 0.5 8.9 1.6 5.8 4.8United PanAm Financial Corp. 1.7 -19.3 * 0.8 NMF * NMF *(1) EBIT and EBITDA multiples are not meaningful for financial institutions.* Not used in range, average or median calculations.NA = Not availableNMF = Not meaningfulwww.mergerstat.com 65
Mergerstat Control Premium Study3rd Quarter <strong>2011</strong>Target NameTargetP/SalesTargetP/IncomeTargetP/Book ValueTargetTIC/EBIT (1)TargetTIC/EBITDA (1)Range High 6.0 39.7 10.0 31.9 22.8Low 0.2 0.5 0.3 5.8 4.8Median: 1.4 17.6 2.1 15.5 9.2Average: 1.6 18.1 2.9 16.9 11.1(1) EBIT and EBITDA multiples are not meaningful for financial institutions.* Not used in range, average or median calculations.NA = Not availableNMF = Not meaningfulwww.mergerstat.com 66
Mergerstat Control Premium Study3rd Quarter <strong>2011</strong>Target Multiples (International)Target NameTargetP/SalesTargetP/IncomeTargetP/Book ValueTargetTIC/EBIT (1)TargetTIC/EBITDA (1)A.S. Roma SpA 0.6 -2.6 * -1.0 * -4.2 * -27.0 *AB Invalda / Baltic Pharma Ltd. (Sanitas AB) 3.1 20.3 12.1 * 14.2 10.6AIM Health Group, Inc. 0.5 14.2 8.3 23.9 15.2ATR Holdings, Inc. (Philippines) (ATR KimEngFinancial Corp.)3.3 13.3 1.6 NMF * NMF *Bridgewater Systems Corp. 2.3 10.5 2.2 7.5 7.2BT Group PLC (Accel Frontline Ltd.) 177.6 * 6.9 NMF * NMF * NMF *Caledon Resources PLC 5.3 -32.6 * 4.3 -26.1 * -39.3 *Camlin Ltd. 0.07 3.0 4.2 1.3 1.0CAS Capital, Inc. (Kazokutei Co., Ltd.) 0.6 -229.0 * 1.3 149.5 * 12.8CBG Group PLC 0.8 22.6 -2.5 * NMF * NMF *Cellestis Ltd. 8.2 39.7 13.3 * 30.4 29.1 *Centrebet International Ltd. 2.4 17.3 22.5 * 12.9 10.4Charlie's Group Ltd. 3.7 76.9 * 15.5 * 46.0 * 34.4 *Chartwell Technology, Inc. 2.3 -2.5 * 1.3 -2.5 * -2.8 *Chaucer Holdings PLC 0.4 13.6 1.1 NMF * NMF *China Security & Surveillance Technology, Inc. 0.8 7.5 1.1 8.4 7.5Cinch Energy Corp. 7.6 -28.2 * 1.6 -24.4 * 21.2Crude Carriers Corp. 2.4 13.6 0.5 19.8 19.0Crystal Amber Fund Ltd. (Pinewood Shepperton PLC) 2.2 22.1 1.3 15.1 10.7Culane Energy Corp. 3.3 -20.6 * 1.3 -21.6 * 16.0Daiwa Securities Group Inc. (GABA Corp.) 1.1 11.5 9.4 6.2 5.5Dawson Holdings PLC 0.2 21.5 -5.6 * 12.8 8.2Delachaux SA 1.5 16.4 6.5 11.9 10.9Demag Cranes AG 1.0 33.1 7.5 18.5 13.4Dundee Corp. (Breakwater Resources Ltd.) 1.8 6.3 1.4 6.4 5.0ECT Industries SA 4.4 10.4 1.6 9.1 NMF *EDT Retail Trust 2.5 9.4 0.9 NMF * NMF *Education Development International PLC 3.9 15.6 11.8 * 12.2 11.0eFront SA 2.3 18.9 3.5 14.0 11.9ElektronikGruppen BK AB 0.2 11.6 2.9 11.1 6.4elexis AG 1.3 15.1 4.2 13.5 8.0(1) EBIT and EBITDA multiples are not meaningful for financial institutions.* Not used in range, average or median calculations.NA = Not availableNMF = Not meaningfulCopyright © 2012, FactSet Mergerstat, LLC. All rights reserved. 67
Mergerstat Control Premium Study3rd Quarter <strong>2011</strong>Target NameTargetP/SalesTargetP/IncomeTargetP/Book ValueTargetTIC/EBIT (1)TargetTIC/EBITDA (1)Equinox Minerals Ltd. 7.6 25.6 3.8 16.3 13.8Forever Prosperous Pte Ltd. (PT Royal OakDevelopment Asia Tbk)83.1 * -290.0 * 2.3 -411.0 * NMF *Forzani Group Ltd. 0.5 22.3 3.6 16.0 8.2Frankland River Olive Co. Ltd. 0.5 -1.2 * 0.1 -6.2 * -10.9 *Gerako Oy (Tekla Oyj) 5.6 167.0 * 10.2 * 26.5 23.3Goldstone Resources, Inc. 2,522.2 * -126.8 * 2.6 -41.5 * -41.7 *Goto Co., Ltd. 0.3 23.5 0.4 15.8 9.6Government of Serbia (Paracinka AD) 0.4 -4.9 * 0.5 -9.8 * -38.2 *Henkel AG & Co. KGaA (Henkel India Ltd.) 0.2 -2.2 * NMF * -5.2 * -7.0 *Holidaybreak PLC 0.7 -39.9 * -4.3 * 218.6 * 24.6HPI Resources Bhd. 0.6 9.5 1.5 10.2 7.5Icron Technologies Corp. 1.0 10.0 2.0 10.0 10.0Ignis ASA 2.3 -86.0 * 6.6 -307.9 * 49.2 *Impera Total Return AG 5.9 -4.5 * 0.9 NMF * NMF *Indian Energy Ltd. 2.1 -3.5 * 0.5 -60.1 * 40.9 *IntraPower Ltd. 0.5 43.2 * 19.1 * 21.4 NMF *iSOFT Group Ltd. 0.5 -0.4 * -0.9 * -1.5 * -56.3 *ITOCHU Corp. (NANO Media Inc.) 0.7 -6.2 * 0.5 -6.3 * -7.5 *Japan Fine Arts KK (Kojitu Co., Ltd.) 0.4 56.0 * 1,761.6 * 32.2 11.2Kawashima Selkon Textiles Co., Ltd. 0.2 -6.9 * 2.0 -16.1 * -71.9 *KH Investment Holdings Ltd. 3,444.7 * -969.5 * 1,247.9 * -988.2 * -1,002.2 *Korea Value Asset Management Co., Ltd. (HyundaiDSF Co., Ltd.)1.3 6.0 0.8 4.6 3.8KS Energy Ltd. 0.9 -7.7 * 1.4 -17.6 * -301.2 *Liquidation World, Inc. 0.01 -0.06 * -0.8 * -0.5 * -0.6 *MagIndustries Corp. 5.2 -2.8 * 1.1 -4.0 * -4.9 *Mamut ASA 1.6 46.5 * 12.1 * 35.7 * 36.0 *Maspro Denkoh Corp. 0.5 5.8 0.7 14.9 12.7Minerva PLC 12.9 * 6.4 5.6 NMF * NMF *Moria SA 2.4 19.5 5.4 11.1 9.8Nippon Kagaku Yakin Co., Ltd. 0.4 -2.4 * 0.7 -5.3 * -6.2 *Niscayah Group AB 1.0 25.9 -11.4 * 15.4 11.5(1) EBIT and EBITDA multiples are not meaningful for financial institutions.* Not used in range, average or median calculations.NA = Not availableNMF = Not meaningfulwww.mergerstat.com 68
Mergerstat Control Premium Study3rd Quarter <strong>2011</strong>Target NameTargetP/SalesTargetP/IncomeTargetP/Book ValueTargetTIC/EBIT (1)TargetTIC/EBITDA (1)Northern Energy Corp. Ltd. 423.8 * -241.4 * 4.7 -241.4 * -251.8 *OFI Private Equity Capital SCA 0.2 -5.1 * 0.9 NMF * NMF *Ondine Biomedical, Inc. 8.4 -0.8 * -3.0 * -1.1 * -1.2 *Orient Garments Ltd. 0.4 13.0 2.2 12.1 9.6OSK Property Holdings Bhd. 0.9 6.4 0.5 NMF * NMF *Outremer Télécom SA 1.4 18.0 10.3 * 15.5 6.7Paradise Capital Holding Co. (Olympic Group forFinancial Investments Co.)0.9 12.3 2.6 12.3 NMF *Parmalat SpA 1.0 15.8 1.9 11.9 8.6Portek International Ltd. 1.6 14.0 3.8 9.5 6.8Praesepe PLC 1.1 -40.7 * -0.8 * 93.6 * 28.8 *Proservia SA 0.6 24.5 1.7 12.2 7.6Pulai Springs Bhd. 0.2 -4.4 * 0.09 NMF * NMF *Quintec SA 0.3 75.6 * 1.8 33.8 9.5Rank Group PLC 1.1 15.3 -6.5 * 13.1 8.7Rhodia SA 0.6 9.3 -3.6 * 6.6 4.9Russian Railways OJSC (TransCreditBank JSC) 1.7 7.2 1.8 NMF * NMF *SäkI AB 23.7 * 19.4 1.4 NMF * NMF *Safari Industries (India) Ltd. 0.6 29.1 NMF * 7.7 NMF *Satair A/S 1.2 23.9 4.9 17.3 8.0SBI VeriTrans Co., Ltd. 1.0 8.4 2.6 5.5 4.7Schulthess Group AG 2.5 40.2 * 5.7 27.7 18.7Scottish Re Group Ltd. 0.03 0.1 0.1 NMF * NMF *Shanghai Bailian Group Co. Ltd. 1.5 24.9 4.1 18.6 NMF *Siam Industrial Credit Public Co. Ltd. 3.3 9.6 1.0 NMF * NMF *Sical Logistics Ltd. 0.6 20.9 0.9 10.1 9.8SIIC Shanghai Holding Co. Ltd. (Shanghai IndustrialDevelopment Co. Ltd.)3.5 29.0 3.2 NMF * NMF *silex technology, Inc. 0.5 -14.7 * 1.1 -23.8 * 17.5Solvay SA (Solvay Pharma India Ltd.) 3.9 34.3 8,546.3 * 13.6 12.8Sunway City Bhd. 1.1 1.6 1.0 NMF * NMF *Sunway Holdings Bhd. 0.8 15.4 2.0 13.4 NMF *Synergi Solutions AS 1.2 16.8 3.7 110.8 * 101.9 *(1) EBIT and EBITDA multiples are not meaningful for financial institutions.* Not used in range, average or median calculations.NA = Not availableNMF = Not meaningfulwww.mergerstat.com 69
Mergerstat Control Premium Study3rd Quarter <strong>2011</strong>Target NameTargetP/SalesTargetP/IncomeTargetP/Book ValueTargetTIC/EBIT (1)TargetTIC/EBITDA (1)Telvent GIT SA 1.3 22.1 -8.9 * 19.4 12.5Territory Resources Ltd. 0.7 4.1 2.3 4.5 3.1The Capital Pub Co. PLC 2.3 24.0 1.6 16.9 14.2Tognum AG 1.3 53.8 * 11.4 * 31.7 12.9Tohken Co., Ltd. 0.3 -11.4 * 0.9 -95.3 * 53.0 *Tong Yang Magic Co., Ltd. 0.2 -2.5 * 0.5 -10.0 * 69.5 *Torque Energy, Inc. 2.5 12.9 0.8 12.8 6.5Uniq PLC 0.4 -51.1 * 1.4 -78.4 * 15.3United Securities Public Co., Ltd. 4.1 48.5 * 0.7 NMF * NMF *Valad Property Group 1.2 -2.2 * 0.8 NMF * NMF *Verigy Ltd. 1.7 41.5 * 2.2 31.9 19.8WebMoney Corp. 0.3 20.4 6.3 13.4 13.0Yash Trading & Finance Ltd. 19.1 * 31.5 NMF * NMF * NMF *Zuken, Inc. / Kenny B YK (Chip One Stop, Inc.) 2.1 32.0 2,789.8 * 18.9 15.8Actiease Assets Ltd. (Sam Woo Holdings Ltd.) 2.7 40.3 * 1.9 376.3 * 46.0 *AH Medical Properties PLC 8.4 39.7 9.4 33.8 * 24.6 *AI Jaber Transport & General Contracting LLC (UnitedBank Ltd.)0.01 0.1 0.09 1.3 * 1.0 *Allied Irish Banks PLC (Bank Zachodni WBK SA) 4.1 18.2 3.0 NMF * NMF *Aloka Co., Ltd. 1.1 15.4 * 1.6 13.4 10.4Amtek India Ltd. 1.8 16.3 2.4 14.9 11.0ASA Group Holdings Ltd. 0.5 -0.6 * 1.0 -0.9 * -1.3 *Asset Management Investment Co. PLC 6.4 -4.5 * 0.9 NMF * NMF *ASTRA Capital Ltd. 18.7 * -54.1 * 0.5 NMF * NMF *Atlan Holdings Bhd. (DFZ Capital Bhd.) 1.2 9.8 5.6 9.2 NMF *Avoca Resources Ltd. 3.3 18.6 3.5 14.9 NMF *AXA SA (AXA Asia Pacific Holdings Ltd.) 2.3 23.0 5.7 NMF * NMF *Barnard Jacobs Mellet Holdings Ltd. 1.3 80.3 * 1.0 NMF * NMF *Biocompatibles International PLC 5.7 -42.8 * 6.7 -33.8 * -262.3 *BM Invest SAS (Duc Lamothe Participations SA) 4.3 54.0 * 7.8 NMF * NMF *BNP Paribas SA (Fortis Bank AS) 1.3 20.8 1.1 NMF * NMF *Brío de Colombia SA 0.2 15.2 2.3 7.8 NMF *BV! Media, Inc. 1.8 25.0 9.2 16.4 12.8(1) EBIT and EBITDA multiples are not meaningful for financial institutions.* Not used in range, average or median calculations.NA = Not availableNMF = Not meaningfulwww.mergerstat.com 70
Mergerstat Control Premium Study3rd Quarter <strong>2011</strong>Target NameTargetP/SalesTargetP/IncomeTargetP/Book ValueTargetTIC/EBIT (1)TargetTIC/EBITDA (1)bwin Interactive Entertainment AG 2.5 22.4 14.2 * 26.9 13.8Chemistry Communications Group PLC 0.7 12.7 -5.3 * 8.8 7.9CHRYSALIS PLC 1.7 -53.3 * -6.9 * 57.6 * 50.0 *Citadel Resource Group Ltd. 1,207.7 * -66.6 * 3.5 -82.5 * -84.5 *Clapham House Group PLC 0.7 39.3 1.9 19.1 8.2Clever Communications Australia Ltd. 0.9 4.2 -2.6 * 4.3 3.2Clyde Process Solutions PLC 0.5 15.6 -1.5 * 19.4 13.9Crucell NV 5.5 69.6 * 3.0 36.3 * 23.6Culture Convenience Club Co., Ltd. 0.7 22.3 2.9 20.8 11.7Dalsa Corp. 1.6 18.6 3.0 14.1 10.1Dominion Mining Ltd. 3.1 111.2 * 2.5 68.0 * 11.7Draka Holding NV 0.4 -32.1 * 1.9 837.6 * 20.7DundeeWealth, Inc. 3.2 29.1 6.1 NMF * NMF *Eastern Asia Technology Ltd. 0.2 11.7 0.6 5.5 3.1Enoteca Co., Ltd. 0.5 45.9 * 1.2 25.5 19.4Essa Australia Ltd. 1.3 16.7 2.0 13.4 10.3Eurand NV 3.3 -307.4 * 5.4 764.7 * 54.5 *F-One Ltd. 0.7 -21.0 * 1.6 -27.7 * -30.5 *Farallon Mining Ltd. 2.7 35.6 6.7 31.1 15.7Galaxy Far East Corp. 0.6 17.2 1.1 14.4 13.4Giralia Resources NL 156.0 * 294.5 * 12.5 * 168.0 * 166.4 *Gold Pak Co., Ltd. 0.1 5.2 0.5 5.8 3.6Hebei Taihang Cement Co. Ltd. 2.4 50.8 * 6.0 32.5 20.0Hing Yiap Group Bhd. 0.5 4.5 0.7 3.6 3.1Honda Motor Co. Ltd. (Hero Honda Motors Ltd.) 0.9 6.9 3.3 5.6 5.2HSBC Holdings PLC (Arnhold Holdings Ltd.) 0.8 -251.7 * 1.3 2,821.4 * 54.8 *Iberia Líneas Aéreas de España SA 0.7 22.2 2.3 15.0 9.0Impress Energy Ltd. 9.1 67.2 * 3.2 52.3 * 51.4 *ING Groep NV (ING Industrial Fund) 5.2 -45.4 * 1.0 NMF * NMF *Interlink Petroleum Ltd. 6.0 58.0 * 1.6 58.0 * 54.7 *International Power PLC 0.4 6.0 0.4 9.0 6.0Invoice, Inc. 0.2 4.9 3.0 6.6 6.2iseemedia, Inc. 61.3 * -45.5 * 58.9 * -37.6 * -38.3 *(1) EBIT and EBITDA multiples are not meaningful for financial institutions.* Not used in range, average or median calculations.NA = Not availableNMF = Not meaningfulwww.mergerstat.com 71
Mergerstat Control Premium Study3rd Quarter <strong>2011</strong>Target NameTargetP/SalesTargetP/IncomeTargetP/Book ValueTargetTIC/EBIT (1)TargetTIC/EBITDA (1)Jaya Holdings Ltd. 1.2 5.4 0.7 8.1 6.4Justice KK (Image Holdings Co., Ltd.) 0.3 4.3 0.8 10.5 8.6Kuraki Co., Ltd. 0.7 -37.5 * 0.7 -97.1 * 21.1Laguna Resources NL 221.3 * -13.2 * 2.9 -13.2 * -13.2 *LE Lundbergföretagen AB (Cardo AB) 1.4 26.6 6.1 18.3 12.2Michael Hill International Ltd. 0.8 13.0 2.2 10.9 8.5Nestor Healthcare Group PLC 0.8 17.4 -6.7 * 12.2 10.9O-M Ltd. 1.9 31.1 1.5 18.2 11.7Oriental City Group PLC (Oriental City GroupHoldings Ltd.)156.1 * -177.3 * 2.9 NMF * NMF *Pareto Corp. 1.1 16.9 -20.5 * 11.7 10.4Parkbridge Lifestyle Communities, Inc. 4.1 40.5 * 2.3 NMF * NMF *Patni Computer Systems Ltd. 2.1 11.1 NMF * 9.6 NMF *Petrolifera Petroleum Ltd. 2.2 -9.8 * 0.6 -40.5 * 7.4Pharmaniaga Bhd. 0.5 9.8 -21.7 * 7.8 6.7Provet Holdings Ltd. 0.3 13.8 2.3 10.0 8.5PT AKR Corporindo Tbk (PT Sorini Agro Asia Corp.Tbk)1.9 26.2 4.6 21.0 21.0Q-Med AB 5.6 34.6 4.1 24.9 19.6Qinghai Salt Lake Industry Group Co. Ltd. 27.7 * 51.8 * 13.1 * 44.3 * NMF *Quadra FNX Mining Ltd. (Gold Wheaton Gold Corp.) 7.7 29.7 1.4 17.6 12.7Realex Properties Corp. 2.7 19.3 0.9 NMF * NMF *Ross Human Directions Ltd. 0.2 9.1 2.2 6.5 5.2S.P. Suzuki Public Co. Ltd. 1.3 -28.0 * 1.3 -49.5 * -86.5 *Sazaby League Ltd. 0.5 28.7 0.7 15.4 10.0SeLoger.com SA 8.7 35.8 -17.9 * 22.4 18.6Siam Commercial Bank Public Co. Ltd. (DhanamitrFactoring PCL)3.5 10.5 2.1 NMF * NMF *Siemens AG (Siemens Healthcare Diagnostics Ltd.) 1.6 50.6 * NMF * 26.5 NMF *SNAI SpA 0.5 -8.2 * -1.4 * -348.2 * 6.5Spescom Ltd. (South Africa) 0.2 5.5 0.8 3.5 3.0Stellar Group Co., Ltd. 0.06 0.6 0.2 1.6 1.6Straits Resources Ltd. /Old/ 1.5 -11.3 * 4.3 -10.3 * -21.2 *Subsea 7, Inc. 0.02 0.1 0.04 1.4 1.1(1) EBIT and EBITDA multiples are not meaningful for financial institutions.* Not used in range, average or median calculations.NA = Not availableNMF = Not meaningfulwww.mergerstat.com 72
Mergerstat Control Premium Study3rd Quarter <strong>2011</strong>Target NameTargetP/SalesTargetP/IncomeTargetP/Book ValueTargetTIC/EBIT (1)TargetTIC/EBITDA (1)Tanaka Galvanizing Co., Ltd. 0.2 5.3 0.4 27.8 7.9Thomson Medical Centre Ltd. 6.3 31.5 3.6 25.8 21.7Tinci Holdings Ltd. 0.7 -31.4 * 0.8 -52.4 * 723.8 *Tong Yang Securities, Inc. / Tong Yang Capital Co. /Tong Yang Financial Services Corp. (Tong YangLife Insurance Co. Ltd.)0.6 24.9 3.8 NMF * NMF *Voltaire Ltd. 2.7 -40.3 * 3.7 -50.1 * -559.7 *Wellstream Holdings PLC 2.5 33.6 5.0 23.2 17.8Wimm-Bill-Dann Foods OJSC 2.3 44.6 * 10.3 * 30.4 19.3Wonder Star Securities Ltd. / Top Source SecuritiesLtd. (KTP Holdings Ltd.)3.3 81.9 * 2.0 81.9 * 65.4 *Works Applications Co., Ltd. 2.4 21.0 3.4 17.1 13.4Yamashin Ltd. (Nihon Parking Corp.) 0.3 12.4 1.2 19.2 9.5Yokogawa Electric Corp. (Kokusai Chart Corp.) 0.7 16.6 1.7 19.2 9.5Range: High 9.1 39.3 9.2 32.5 23.6Low 0.02 0.1 0.04 1.4 1.1Median: 1.3 16.6 2.0 14.6 10.1Average: 2.0 16.9 2.5 14.8 10.9(1) EBIT and EBITDA multiples are not meaningful for financial institutions.* Not used in range, average or median calculations.NA = Not availableNMF = Not meaningfulwww.mergerstat.com 73
Mergerstat Control Premium Study3rd Quarter <strong>2011</strong>Target Demographics (Domestic)Target NameTargetTickerTargetExchangeTargetCountryAcquirerCountryConsiderationNature CurrencyBJ's Wholesale Club, Inc. BJ NYSE United States United States C F U.S. DollarBlackstone Group LP (Graham PackagingCo., Inc.) GRM NYSE United States United States C U.S. DollarBucyrus International, Inc. BUCY NASDAQ United States United States C U.S. DollarCalifornia Pizza Kitchen, Inc. CPKI NASDAQ United States United States C F U.S. DollarCitadel Broadcasting Corp. CDELB OTC United States United States C,S N U.S. DollarDanvers Bancorp, Inc. DNBK NASDAQ United States United States C,S U.S. DollarEMS Technologies, Inc. ELMG NASDAQ United States United States C F U.S. DollarEnergyConnect Group, Inc. ECNG OTC United States United States C U.S. DollarFremont Michigan InsuraCorp, Inc. FMMH OTC United States United States C U.S. DollarFrontier Oil Corp. FTO NYSE United States United States S U.S. DollarGerber Scientific, Inc. GRB NYSE United States United States C U.S. DollarGlobal Traffic Network, Inc. GNET NASDAQ United States United States C F U.S. DollarGS Financial Corp. GSLA NASDAQ United States United States C U.S. DollarHypercom Corp. HYC NYSE United States United States S U.S. DollarImmucor, Inc. BLUD NASDAQ United States United States C F U.S. DollarIntegral Systems, Inc. (Maryland) ISYS OTC United States United States C,S U.S. DollarK-Sea Transportation Partners LP KSP NYSE United States United States C,S U.S. DollarKendle International, Inc. KNDL NASDAQ United States United States C U.S. DollarKKR & Co. LP (PRIMEDIA, Inc.) PRM NYSE United States United States C U.S. DollarL-1 Identity Solutions, Inc. ID NYSE United States France C U.S. DollarLawson Software, Inc. LWSN NASDAQ United States United States C U.S. DollarLegacy Bancorp, Inc. LEGC NASDAQ United States United States C,S U.S. DollarM. D. Sass Investors Services, Inc. (SterlingChemicals, Inc.) SCHI OTC United States United States C,X U.S. DollarMarshall & Ilsley Corp. MI NYSE United States Canada S U.S. DollarMediaMind Technologies, Inc. MDMD NASDAQ United States United States C F U.S. DollarMidCarolina Financial Corp. MCFI OTC United States United States S U.S. DollarNational Semiconductor Corp. NSM NYSE United States United States C U.S. DollarNationwide Health Properties, Inc. NHP NYSE United States United States S U.S. DollarNobel Learning Communities, Inc. NLCI NASDAQ United States United States C U.S. DollarOphthalmic Imaging Systems, Inc. OISI OTC United States United States S U.S. DollaroptionsXpress Holdings, Inc. OXPS NASDAQ United States United States S U.S. DollarOrange Community Bancorp OCBN OTC United States United States C,X U.S. DollarPetrohawk Energy Corp. HK NYSE United States Australia C N U.S. DollarRadiant Systems, Inc. RADS NASDAQ United States United States C F U.S. DollarSAVVIS, Inc. SVVS NASDAQ United States United States C,S U.S. DollarServidyne, Inc. SERV NASDAQ United States United States C U.S. DollarCopyright © 2012, FactSet Mergerstat, LLC. All rights reserved. 74
Mergerstat Control Premium Study3rd Quarter <strong>2011</strong>Target NameTargetTickerTargetExchangeTargetCountryAcquirerCountryConsiderationNature CurrencySFN Group, Inc. SFN NYSE United States Netherlands C F U.S. DollarSMART Modular Technologies (WWH), Inc. SMOD NASDAQ United States United States C U.S. DollarSRA International, Inc. SRX NYSE United States United States C U.S. DollarSterling Bancshares, Inc. SBIB NASDAQ United States United States S U.S. DollarThe Lubrizol Corp. LZ NYSE United States United States C U.S. DollarTimberland Co. TBL NYSE United States United States C U.S. DollarVaughan Foods, Inc. FOOD OTC United States United States C U.S. DollarWarner Music Group Corp. WMG NYSE United States United States C U.S. DollarZoran Corp. ZRAN NASDAQ United StatesUnitedKingdom C,S U.S. DollarSonic Solutions, Inc. SNIC NASDAQ United States United States C,S F U.S. DollarSyniverse Holdings, Inc. SVR NYSE United States United States C U.S. DollarT-3 Energy Services, Inc. TTES NASDAQ United States United States C,S U.S. DollarThe Cypress Group LLC (CPI International,Inc. (California)) CPII NASDAQ United States United States C U.S. DollarTodd Shipyards Corp. TOD NYSE United States United States C F U.S. DollarUnited PanAm Financial Corp. UPFC OTC United States United States C U.S. Dollarwww.mergerstat.com 75
Mergerstat Control Premium Study3rd Quarter <strong>2011</strong>Target Demographics (International)Target NameTargetTickerTargetExchangeTargetCountryAcquirerCountryConsiderationNature CurrencyA.S. Roma SpA ASR Milan Italy United States C EuroAB Invalda / Baltic Pharma Ltd. (Sanitas AB) SAN1L Vilnius Lithuania United States C,L Lithuanian LitasAIM Health Group, Inc. AHG Canadian Venture Canada Canada C Canadian DollarATR Holdings, Inc. (Philippines) (ATR KimEngFinancial Corp.)ATRK Manila Philippines Malaysia C Philippine PesoBridgewater Systems Corp. BWC Toronto Canada United States C Canadian DollarBT Group PLC (Accel Frontline Ltd.) 532774 Bombay India India C Indian RupeeCaledon Resources PLC CDN London StockExchangeUnited Kingdom China C British PoundCamlin Ltd. 523207 Bombay India Japan C F Indian RupeeCAS Capital, Inc. (Kazokutei Co., Ltd.) 9931 JASDAQ Japan Japan C F Japanese YenCBG Group PLC CB London StockExchangeCellestis Ltd. CST AustralianSecuritiesExchangeCentrebet International Ltd. CIL AustralianSecuritiesExchangeUnited Kingdom United Kingdom C N British PoundAustralia Netherlands C Australian DollarAustralia United Kingdom C Australian DollarCharlie's Group Ltd. CHA Wellington New Zealand Japan C F New Zealand DollarChartwell Technology, Inc. CWH Toronto Canada Canada C,S Canadian DollarChaucer Holdings PLC CHU London StockExchangeUnited Kingdom United States C British PoundChina Security & Surveillance Technology, Inc. CSR NYSE China China C Chinese YuanRenminbiCinch Energy Corp. CNH Toronto Canada Canada S,L Canadian DollarCrude Carriers Corp. CRU NYSE Greece Greece S,L EuroCrystal Amber Fund Ltd. (Pinewood SheppertonPLC)PWSLondon StockExchangeUnited Kingdom United Kingdom C,X H British PoundCulane Energy Corp. CLN Canadian Venture Canada Canada C Canadian DollarDaiwa Securities Group Inc. (GABA Corp.) 2133 Tokyo Japan Japan C F Japanese YenDawson Holdings PLC DWN London StockExchangeUnited Kingdom United Kingdom C F British PoundDelachaux SA DCH Euronext Paris France France C EuroDemag Cranes AG D9C Frankfurt Germany United States C H EuroDundee Corp. (Breakwater Resources Ltd.) DC.A Toronto Canada United Kingdom C F Canadian DollarECT Industries SA ALECT Euronext Paris France France C EuroEDT Retail Trust EDT AustralianSecuritiesExchangeAustralia United States C H Australian DollarCopyright © 2012, FactSet Mergerstat, LLC. All rights reserved. 76
Mergerstat Control Premium Study3rd Quarter <strong>2011</strong>Target NameTargetTickerTargetExchangeTargetCountryAcquirerCountryConsiderationNature CurrencyEducation Development International PLC EDD London StockExchangeUnited Kingdom United Kingdom C F British PoundeFront SA ALEFT Euronext Paris France United States C EuroElektronikGruppen BK AB ELGR.B Stockholm Sweden Sweden C F Swedish Kronaelexis AG EEX Frankfurt Germany Germany C F EuroEquinox Minerals Ltd. EQN Toronto Canada Canada C Canadian DollarForever Prosperous Pte Ltd. (PT Royal OakDevelopment Asia Tbk)RODAIndonesian StockExchangeIndonesiaBritish VirginIslandsCIndonesian RupiahForzani Group Ltd. FGL Toronto Canada Canada C N Canadian DollarFrankland River Olive Co. Ltd. FLR AustralianSecuritiesExchangeAustralia Australia C F Australian DollarGerako Oy (Tekla Oyj) TLA1V Helsinki Finland United States C N EuroGoldstone Resources, Inc. GRC Toronto Canada Canada C,S Canadian DollarGoto Co., Ltd. 9817 JASDAQ Japan Japan C F Japanese YenGovernment of Serbia (Paracinka AD) PARP Belgrade Serbia Serbia C F Serbian DinarHenkel AG & Co. KGaA (Henkel India Ltd.) 532671 Bombay India India C,L Indian RupeeHolidaybreak PLC HBR London StockExchangeUnited Kingdom India C British PoundHPI Resources Bhd. 7919 Kuala Lumpur Malaysia Japan C N Malaysian RinggitIcron Technologies Corp. IT Canadian Venture Canada Canada S Canadian DollarIgnis ASA IGNIS Oslo Norway United States C,X F Norwegian KroneImpera Total Return AG IRP Frankfurt Germany Germany C EuroIndian Energy Ltd. IEL London StockExchangeIntraPower Ltd. IPX AustralianSecuritiesExchangeiSOFT Group Ltd. ISF AustralianSecuritiesExchangeUnited Kingdom United Kingdom S British PoundAustralia Australia C F Australian DollarAustralia United States C Australian DollarITOCHU Corp. (NANO Media Inc.) 3783 Tokyo Japan Japan C F Japanese YenJapan Fine Arts KK (Kojitu Co., Ltd.) 9905 JASDAQ Japan Japan C H Japanese YenKawashima Selkon Textiles Co., Ltd. 3009 Tokyo Japan Japan S Japanese YenKH Investment Holdings Ltd. 8172 Hong Kong Hong Kong Hong Kong C N Hong Kong DollarKorea Value Asset Management Co., Ltd.(Hyundai DSF Co., Ltd.)16510 Korea StockExchangeSouth Korea South Korea S N Korean WonKS Energy Ltd. 578 Singapore Singapore British VirginIslandsC N Singapore DollarLiquidation World, Inc. LQW Toronto Canada United States C,L Canadian DollarMagIndustries Corp. MAAFF OTC Canada China C F Canadian Dollarwww.mergerstat.com 77
Mergerstat Control Premium Study3rd Quarter <strong>2011</strong>Target NameTargetTickerTargetExchangeTargetCountryAcquirerCountryConsiderationNature CurrencyMamut ASA MAMUT Oslo Norway United States C F Norwegian KroneMaspro Denkoh Corp. 6749 Tokyo Japan Japan C F Japanese YenMinerva PLC MNR London StockExchangeUnited Kingdom United Kingdom C F British PoundMoria SA MLMOR Euronext Paris France Switzerland C EuroNippon Kagaku Yakin Co., Ltd. 5995 Osaka Japan Japan C F Japanese YenNiscayah Group AB NISC.B Stockholm Sweden United States C,L N Swedish KronaNorthern Energy Corp. Ltd. NEC AustralianSecuritiesExchangeAustralia Australia C F Australian DollarOFI Private Equity Capital SCA OPEC Euronext Paris France France S F EuroOndine Biomedical, Inc. OBP Toronto Canada Canada C Canadian DollarOrient Garments Ltd. OGL Colombo Sri Lanka Sri Lanka C Sri Lankan RupeeOSK Property Holdings Bhd. 6661 Kuala Lumpur Malaysia Malaysia C N Malaysian RinggitOutremer Télécom SA OMT Euronext Paris France France C EuroParadise Capital Holding Co. (Olympic Groupfor Financial Investments Co.)OLGR Cairo Egypt Sweden C Egyptian PoundParmalat SpA PLT Milan Italy France C H EuroPortek International Ltd. P09 Singapore Singapore Japan C N Singapore DollarPraesepe PLC PRA London StockExchangeUnited Kingdom United Kingdom S British PoundProservia SA ALPRV Euronext Paris France United States C N EuroPulai Springs Bhd. 5059 Kuala Lumpur Malaysia Malaysia C N Malaysian RinggitQuintec SA QUINTEC Santiago Chile Chile C N Chilean PesoRank Group PLC RNK London StockExchangeUnited Kingdom Hong Kong C H British PoundRhodia SA RHA Euronext Paris France Belgium C F EuroRussian Railways OJSC (TransCreditBank JSC) TCBN MICEX RussianFederationRussianFederationCRussian RubleSäkI AB SAEK Stockholm Sweden Sweden S Swedish KronaSafari Industries (India) Ltd. 523025 Bombay India India C Indian RupeeSatair A/S SAT Copenhagen Denmark Germany C F Danish KroneSBI VeriTrans Co., Ltd. 3749 JASDAQ Japan Japan S Japanese YenSchulthess Group AG SGRN Swiss SIXExchangeSwitzerland Sweden C,S F Swiss FrancScottish Re Group Ltd. SKRRF OTC Bermuda Bermuda C Bermudian DollarShanghai Bailian Group Co. Ltd. 600631 Shanghai China China S Chinese YuanRenminbiSiam Industrial Credit Public Co. Ltd. SICCO Bangkok Thailand Thailand C F Thai Bahtwww.mergerstat.com 78
Mergerstat Control Premium Study3rd Quarter <strong>2011</strong>Target NameTargetTickerTargetExchangeTargetCountryAcquirerCountryConsiderationNature CurrencySical Logistics Ltd. 520086 Bombay India India C N Indian RupeeSIIC Shanghai Holding Co. Ltd. (ShanghaiIndustrial Development Co. Ltd.)600748 Shanghai China Hong Kong C Chinese YuanRenminbisilex technology, Inc. 6679 JASDAQ Japan Japan C F Japanese YenSolvay SA (Solvay Pharma India Ltd.) 532447 Bombay India United States S Indian RupeeSunway City Bhd. 6289 Kuala Lumpur Malaysia Malaysia C,S N Malaysian RinggitSunway Holdings Bhd. 4308 Kuala Lumpur Malaysia Malaysia C,S N Malaysian RinggitSynergi Solutions AS PRID Oslo Norway Norway C Norwegian KroneTelvent GIT SA TLVTF OTC Spain France C,L F EuroTerritory Resources Ltd. TTY AustralianSecuritiesExchangeThe Capital Pub Co. PLC CPUB London StockExchangeAustralia Hong Kong C F Australian DollarUnited Kingdom United Kingdom C F British PoundTognum AG TGM Frankfurt Germany Germany C F EuroTohken Co., Ltd. 6738 JASDAQ Japan Japan S Japanese YenTong Yang Magic Co., Ltd. 023020 Korea StockExchangeSouth Korea South Korea S Korean WonTorque Energy, Inc. TQE Canadian Venture Canada Canada C,S Canadian DollarUniq PLC UNIQ London StockExchangeUnited Kingdom Ireland C N British PoundUnited Securities Public Co., Ltd. US Bangkok Thailand Singapore C N Thai BahtValad Property Group VPG AustralianSecuritiesExchangeAustralia United States C Australian DollarVerigy Ltd. VRGY NASDAQ Singapore Japan C Singapore DollarWebMoney Corp. 2167 JASDAQ Japan Japan C F Japanese YenYash Trading & Finance Ltd. 512345 Bombay India India C Indian RupeeZuken, Inc. / Kenny B YK (Chip One Stop, Inc.) 3343 Tokyo Japan United States C F Japanese Yenwww.mergerstat.com 79
Mergerstat Control Premium Study3rd Quarter <strong>2011</strong>Company Descriptions (Domestic)Target Name Target Business Description Acquirer Business DescriptionBJ's Wholesale Club, Inc. Operates warehouse clubs and superstores Manages an investment fundBlackstone Group LP (GrahamPackaging Co., Inc.)Bucyrus International, Inc.Manufactures and sells plastic containersDesigns and manufactures mining equipmentfor surface and underground miningProvides marketing servicesManufactures construction and miningequipment, diesel and natural gas engines, andindustrial gas turbinesCalifornia Pizza Kitchen, Inc. Owns and operates restaurants Alternative investment managerCitadel Broadcasting Corp. Owns and operates radio stations Owns and operates radio stationsDanvers Bancorp, Inc. Provides banking and financial services National commercial bankEMS Technologies, Inc.EnergyConnect Group, Inc.Provides wireless communications equipmentsfor various applicationsDesigns, constructs and installs electricalcontrol and telecommunications productsManufactures aerospace products, controltechnologies, automotive products, powergeneration systems, specialty chemicals,fibers, plastics, and electronic and advancedmaterialsManufactures automobile batteries, interiors,seating systems and building control systemsand provides facility management servicesFremont Michigan InsuraCorp, Inc. Provides property and casualty insurance. Provides automobile servicesFrontier Oil Corp.Gerber Scientific, Inc.Global Traffic Network, Inc.Operates petroleum refineries and distributespetroleum through its pipelinesProduces automated manufacturing systemsfor the sign making, specialty graphics andpackaging, apparel and flexible materials, andophthalmic lens processing industriesProvides news reports to radio and televisionstationsOperates petroleum refineriesAlternative investment managerAlternative investment managerGS Financial Corp. Provides community banking services Operates as the holding company for HomeBankHypercom Corp.Immucor, Inc.Integral Systems, Inc. (Maryland)Develops, manufactures and supplies point-ofsalepayment systems and networkingproductsManufactures reagents for hospitals and bloodbanksProvides system solutions for satellitecommand, control and integrationManufactures and distributes electronicpayment devicesAlternative investment managerProvides security systems integration servicesfor the federal government and for state andlocal agenciesK-Sea Transportation Partners LP Provides marine freight transportation services Operates inland tank barges and servicesdiesel enginesKendle International, Inc.KKR & Co. LP (PRIMEDIA, Inc.)Provides research solutions for pharmaceuticaland biotechnology industriesPublishes and distributes traditional and onlinebooks and magazinesProvides drug discovery and developmentservicesAlternative investment managerL-1 Identity Solutions, Inc. Provides technology identity solutions Designs, manufactures and markets aircraft,defense and communication equipmentCopyright © 2012, FactSet Mergerstat, LLC. All rights reserved. 80
Mergerstat Control Premium Study3rd Quarter <strong>2011</strong>Target Name Target Business Description Acquirer Business DescriptionLawson Software, Inc. Develops and sells software solutions Alternative investment managerLegacy Bancorp, Inc. State commercial bank Operates as the holding company of BerkshireBank which provides commercial bankingservicesM. D. Sass Investors Services, Inc.(Sterling Chemicals, Inc.)Produces petrochemicalsManufactures and distributes polyester plasticsused in soft drink containers, coatings andpaintMarshall & Ilsley Corp. Provides commercial banking services National Commercial bankMediaMind Technologies, Inc. Provides digital advertising solutions Provides digital distribution products andservicesMidCarolina Financial Corp. Operates as a bank holding company Provides banking services through its whollyowned subsidiaryNational Semiconductor Corp.Develops and manufactures analog intensiveand mixed-signal integrated circuitsDesigns, manufactures and sells integratedcircuit semiconductors and calculatorsNationwide Health Properties, Inc. Real estate investment trust Operates a healthcare real estate investmenttrustNobel Learning Communities, Inc.Ophthalmic Imaging Systems, Inc.Provides private pay education andeducational servicesManufactures ophthalmic digital imagingsystemsAlternative investment managerDevelops medical imaging, informationmanagement softwareoptionsXpress Holdings, Inc. Provides online securities brokerage services Provides securities brokerage and otherfinancial servicesOrange Community Bancorp State commercial bank Bank holding companyPetrohawk Energy Corp.Radiant Systems, Inc.Explores, develops and produces oil andnatural gas propertiesProvides hardware and software solutions tothe hospitality, retail, and entertainmentindustriesExplores for iron, copper, steel, oil and gas,silver, diamonds, zinc, and other naturalresourcesDesigns, manufactures, and installs financialtransaction management systemsSAVVIS, Inc. Provides on-line telecommunications services Provides wired telecommunications servicesServidyne, Inc.SFN Group, Inc.SMART Modular Technologies(WWH), Inc.SRA International, Inc.Sterling Bancshares, Inc.The Lubrizol Corp.Provides energy efficiency and demandresponse solutionsProvides temporary personnel services tobusinesses professional and health carefacilitiesDesigns, manufactures, and markets memorymodules, flash memory cards, andcommunication card productsProvides information technology services andsolutions to business and government agenciesOperates as a state commercial bank holdingcompanyDevelops and produces chemical additives forautomotive and industrial lubricantsProvides system optimization solutions for thecommercial building marketProvides staffing, recruitment and humanresources consulting servicesAlternative investment managerAlternative investment managerProvides commercial banking servicesProvides insurance and investment serviceswww.mergerstat.com 81
Mergerstat Control Premium Study3rd Quarter <strong>2011</strong>Target Name Target Business Description Acquirer Business DescriptionTimberland Co.Vaughan Foods, Inc.Designs and manufactures apparel andaccessoriesProduces and distributes fresh fruits,vegetables & saladsDesigns, manufactures, and sells jeans-wear,decorated knitwear, and intimate apparelProduce and sell potato saladsWarner Music Group Corp. Records and publishes music Alternative investment managerZoran Corp.Sonic Solutions, Inc.Syniverse Holdings, Inc.Develops and markets integrated circuits andrelated productsDevelops and markets computer softwarerelated to the multimedia and interactivefunctionsProvides wireless voice and data services fortelecommunications companiesT-3 Energy Services, Inc. Manufactures and distributes valves, chokes,actuators, and other high pressure products forthe oil and gas industryThe Cypress Group LLC (CPIInternational, Inc. (California))Manufactures and designs satellitecommunications amplifiers and medical x-raygeneratorsManufactures single chip wireless solutionsradio devicesProvides managing services for digital contentAlternative investment managerDesigns, makes, and sells fluid managementequipment for process industriesAlternative investment managerTodd Shipyards Corp. Builds and repairs ship Provides industrial repair servicesUnited PanAm Financial Corp. Provides automobile financing services A private group led by Guillermo Bron andPine Brook Road Partners LLCwww.mergerstat.com 82
Mergerstat Control Premium Study3rd Quarter <strong>2011</strong>Company Descriptions (International)Target Name Target Business Description Acquirer Business DescriptionA.S. Roma SpA Operates a professional football club Provides financial servicesAB Invalda / Baltic Pharma Ltd.(Sanitas AB)Manufactures pharmaceutical productsDevelops and manufactures pharmaceuticalproductsAIM Health Group, Inc. Provides healthcare services and solutions Led by the management of AIM Health GroupInc and Imperial Capital Group LtdATR Holdings, Inc. (Philippines)(ATR KimEng Financial Corp.)Bridgewater Systems Corp.BT Group PLC (Accel FrontlineLtd.)Operates as an investment holding companywith interests in securities brokerages,investment banking, financial advisory,insurance, and property developmentProvides mobile data services, content andcommerceProvides IT services, including infrastructuremanagement, ERP consulting, bankingsolutions and networkingProvides investment and commercial bankingand provides financial servicesProvides computer systems integration for thetelecommunications industryActs as a holding company for its ITsubsidiariesCaledon Resources PLC Explores coal mines Manages state owned assetsCamlin Ltd.CAS Capital, Inc. (Kazokutei Co.,Ltd.)CBG Group PLCCellestis Ltd.Centrebet International Ltd.Charlie's Group Ltd.Manufactures and distributes stationeryproductsOperates a chain of restaurantsProvides insurance and financial services tosmall businessesDevelops, manufactures and markets medicaldiagnostic productsProvides online wagering products to thedomestic and international sports and racebetting marketsManufactures and distributes juice andbeverage productsManufactures and markets office supplies andequipmentOperates department stores and supermarketsAlternative investment managerManufactures and distributes sample andassay technology products for preanalyticalsample preparationsOffers online gambling servicesProduces and distributes beer, liquor, softdrink and related productsChartwell Technology, Inc. Develops gaming software systems Designs, develops, manufactures, distributesand sells technology based gaming solutionsChaucer Holdings PLCChina Security & SurveillanceTechnology, Inc.Provides insurance and reinsuranceunderwriting servicesManufactures and distributes security andsurveillance systemsProvides insurance servicesProvides investment servicesCinch Energy Corp. Drills for oil and gas Explores oil and gasCrude Carriers Corp. Provides ship transportation services Ships oil, diesel and related productsCrystal Amber Fund Ltd. (PinewoodShepperton PLC)Provides studio and related services to filmand television industriesProvides real estate servicesCulane Energy Corp. Engages in oil and natural gas explorations Provides financial servicesDaiwa Securities Group Inc.(GABA Corp.)Operates English teaching schoolsProvides administrative work for medicalfacilities and health care serviceCopyright © 2012, FactSet Mergerstat, LLC. All rights reserved. 83
Mergerstat Control Premium Study3rd Quarter <strong>2011</strong>Target Name Target Business Description Acquirer Business DescriptionDawson Holdings PLCDelachaux SADemag Cranes AGDundee Corp. (BreakwaterResources Ltd.)ECT Industries SADistributes newspaper, magazine and othermarketing servicesManufactures railway equipment, electricpower and electronic transmission equipment,nickel and cobalt based super alloys,magnetism-based equipment and steel castingsManufactures and markets industrial cranes,crane components, harbor cranes and portautomation technology and other liftingequipmentsEngages in acquisition, exploration,development and mining of base metal andprecious metal depositsManufactures and distributes electronicsystems for the naval, aviation and transportindustriesDistributes newspapers and magazinesProvides investment servicesDesigns and manufactures constructionequipmentProduces zinc and lead oresProvides electronic engineering, integration,maintenance, IT support and repair servicesEDT Retail Trust Private Equity Fund Provides investment servicesEducation DevelopmentInternational PLCeFront SAElektronikGruppen BK ABelexis AGProvides vocational, professional accreditedqualifications and assessment servicesDevelops and markets software solutions forthe finance and insurance sectorsManufactures and supplies electroniccomponents for the data andtelecommunications industryManufactures and sells industrial automation,handling and precision systems and machineryProvides education and publishing servicesAlternative investment managerOperates as a holding company with interestsin electronics, lighting and safetyManufactures machinery for rolling mills andminesEquinox Minerals Ltd. Explores and mines for minerals Mines and explores for gold, copper andnickelForever Prosperous Pte Ltd. (PTRoyal Oak Development AsiaTbk)Provides housing construction servicesForzani Group Ltd. Retails athletic apparel Sells tiresFrankland River Olive Co. Ltd.Gerako Oy (Tekla Oyj)Produces and distributes olive oil and tableolivesDevelops and markets software products andrelated servicesOperates as an investment holding companywith interest in real propertiesProvides investment servicesDevelops, manufactures, and marketsadvanced positioning product solutionsGoldstone Resources, Inc. Explores and mines for gold Operates gold minesGoto Co., Ltd.Government of Serbia (ParacinkaAD)Henkel AG & Co. KGaA (HenkelIndia Ltd.)Owns and operates men's and kids wearstores, bookstores and compact disc rentalshopsProduces candy and other confectioneryproductsManufactures and markets detergents,cleansers, cosmetics and hair care productsAcquisition vehicle let by Mr. Yukihiro GotoWholesales grain, unmanufactured tobacco,seeds and animal feedsManufactures personal care and cleaningproductswww.mergerstat.com 84
Mergerstat Control Premium Study3rd Quarter <strong>2011</strong>Target Name Target Business Description Acquirer Business DescriptionHolidaybreak PLCHPI Resources Bhd.Provides outdoor education, hotel breaks andadventure travelsManufactures corrugated boards, corrugatedcartons and other paper productsOperates travel agenciesManufactures and distributes printing andwriting papers; packaging and wrappingpapers; carbonless papers; containerboardsand boxboardsIcron Technologies Corp. Offers video and USB extension solutions Led by Pender Financial Group Corp andexecutives and directors of IcronTechnologies CorpIgnis ASAImpera Total Return AGManufactures optical components forbroadband networksOperates as an exchange-traded holdingcompany with interest in investing in privateequity and corporate finance consultingDevelops fiber optic subsystems and networkperformance test systems for high speedcommunicationsAlternative investment managerIndian Energy Ltd. Owns and operates wind farms Operates a closed-ended investment companyIntraPower Ltd.iSOFT Group Ltd.Provides information technology, voice, datacommunication and infrastructure servicesDevelops software and provides IT solutionsfor the healthcare industryProvides telecommunications servicesProvides services related to informationtechnology and software developmentITOCHU Corp. (NANO Media Inc.) Develops and distributes mobile content Provides billing solution services, cell phoneauthentication solutions services, as well asonline pin distribution for digital contentsJapan Fine Arts KK (Kojitu Co.,Ltd.)Kawashima Selkon Textiles Co.,Ltd.KH Investment Holdings Ltd.Korea Value Asset ManagementCo., Ltd. (Hyundai DSF Co.,Ltd.)KS Energy Ltd.Liquidation World, Inc.MagIndustries Corp.Retails sporting goodsManufactures and markets interior fabrics andtextiles for the automotive industry and for theproduction of household productsOperates as an investment holding companywith interest in the provision of artistsmanagement services and distribution ofapparel and accessoriesOperates and manages department stores andoutlet mallsConstructs oil rigs and distributes oilfieldequipmentProvides consumer merchandise liquidationservicesEngages in magnesium alloy production forthe automotive industries, and petroleumrelatedproducts distributionAlternative investment managerProduces house construction materialsincluding window sashes, tiles, sanitaryequipments and related partsOperates as a holding company with interestsin the development and management of hotelsand other real estate activitiesOperates department stores and outlet mallsOperates as an investment holding companyOperates broad line close out retail storesOperates as a holding company with interestsin shipbuilding, marine engineering, miningand logisticsMamut ASA Provides information technology solutions Provides alternative asset and private equitymanagement serviceswww.mergerstat.com 85
Mergerstat Control Premium Study3rd Quarter <strong>2011</strong>Target Name Target Business Description Acquirer Business DescriptionMaspro Denkoh Corp.Minerva PLCMoria SANippon Kagaku Yakin Co., Ltd.Niscayah Group ABNorthern Energy Corp. Ltd.Manufactures and sells CATV systems,satellite systems, TV receiving, internet andaudio visual equipmentProvides property development andmanagement servicesManufactures surgical instruments for use inophthalmologyManufactures resin molded products and alloycontactsProvides security system analysis and design,implementation, management and operationsservices for the banking and finance, retail,transport and logistics, health care, defenseand industry sectorsProvides thermal coal mining, exploration andcoking servicesOperates an investment holding companyProvides real estate servicesProvides banking and financial servicesManufactures and sells bearings, constantvelocity joints and precision equipmentManufactures and markets industrial tools andsecurity solutionsExplores and mines for coalOFI Private Equity Capital SCA Private Equity Fund Alternative investment managementOndine Biomedical, Inc.Researches and develops treatment formicrobial infections of the oral cavityEngages in investment activitiesOrient Garments Ltd. Manufacturers and exports high-end apparel Private group led by PCH Holdings Pvt Ltdand Mr. S. H. M. RishanOSK Property Holdings Bhd. Develops and manages real estate properties Private group led by Ong Leong Huat andWong Joo Hwa, Executive Director of OskHoldings Bhd, and Land Management SdnBhdOutremer Télécom SAParadise Capital Holding Co.(Olympic Group for FinancialInvestments Co.)Parmalat SpAPortek International Ltd.Praesepe PLCProvides fixed and wirelesstelecommunications servicesManufactures household appliances, electricaltransformers and heaters.Produces milk, dairy, yogurt, cream, fruitjuices, desserts, tomato sauces, soups, snacks,bread, and other food productsProvides port equipment sales and leaseservices and its management servicesOperates family amusement centers, adultgaming centers, casino gaming and certainsports betting and bingo business operationsA private group led by OMT Invest AS,controlled by AXA Investment ManagersPrivate Equity Europe SA and JMH Sàrl, acompany controlled by Jean-MichelHégésippeManufactures household cooking appliancesand other equipmentProvides freight and logistics servicesEngages in the sale, import, export ofindustrial materials, raw iron, nonferrousmetal, chemical, energy and food; providesconsumer and related servicesOperates as an investment holding companyProservia SA Specializes in information technology services Provides employment services, includingtemporary and contract staffingPulai Springs Bhd. Engages in investment holdings Provides investment serviceswww.mergerstat.com 86
Mergerstat Control Premium Study3rd Quarter <strong>2011</strong>Target Name Target Business Description Acquirer Business DescriptionQuintec SAOperates as a holding company with interestsin high tech industryDevelops computer software and providescomputer related servicesRank Group PLC Operates gaming business Operates as an investment holding companywith interest in investment managementactivities & Property development servicesRhodia SA Produces specialty chemicals Manufactures chemicals, pharmaceuticals andplastic productsRussian Railways OJSC(TransCreditBank JSC)Provides commercial banking servicesInternational commercial bankSäkI AB Operates a general investment company Invests in companies and brokers securitiesSafari Industries (India) Ltd.Manufactures and markets travel goods andaccessoriesPrivate group led by Sudhir JatiaSatair A/S Supplies aircraft parts and service solutions Manufactures aerospace and defenseequipmentSBI VeriTrans Co., Ltd.Schulthess Group AGScottish Re Group Ltd.Provides Internet based bill settlementservices and credit card settlement services tofirms engage in electronic commerceManufactures and distributes washingmachines, tumble driers and pumpsProvides customized variable life insuranceproductsProvides securities brokerage and investmentservicesManufactures and wholesales heatingequipmentA private group led by SRGL Acquisition,LDC, and other affiliates of MassachusettsMutual Life Insurance CoShanghai Bailian Group Co. Ltd. Owns and operates department store chains Owns and operates department storesSiam Industrial Credit Public Co.Ltd.Provides financing and financial services tothe housing sectorInternational commercial bankSical Logistics Ltd. Provides logistics services Owns and operates a chain of coffee outletsSIIC Shanghai Holding Co. Ltd.(Shanghai IndustrialDevelopment Co. Ltd.)Develops and manages properties; providesproject contracting servicesManufactures and distributes cigarettes,Chinese medicines, health foods andautomotive parts; engages in real estatesdevelopmentsilex technology, Inc. Develops computer peripheral products Manufactures industrial machinery andcommunication equipmentSolvay SA (Solvay Pharma IndiaLtd.)Sunway City Bhd.Sunway Holdings Bhd.Manufactures and distributes pharmaceuticalsEngages in property development; owns andoperates hotels and resortsOperates as a holding company with interestsin building construction, civil construction,property development, and engineeringservicesManufactures and sells healthcare productsOperates as an investment holding companyOperates as an investment holding companySynergi Solutions AS Produces risk management software Provides risk management services thatincludes information technology servicesTelvent GIT SA Provides information technology services Manufactures electrical distribution andindustrial engineering equipment includingsemiconductor productswww.mergerstat.com 87
Mergerstat Control Premium Study3rd Quarter <strong>2011</strong>Target Name Target Business Description Acquirer Business DescriptionTerritory Resources Ltd. Explores and mines iron ore Supplies industrial raw materials and transportresourcesThe Capital Pub Co. PLC Operates a chain of pubs Brews and sells beer, wines, spirits, softdrinks and owns public houses and retail wineshopsTognum AGTohken Co., Ltd.Tong Yang Magic Co., Ltd.Manufactures and markets engines,propulsion, energy distribution systems to theautomobile industryProvides system integration services andmarkets barcode readers and relatedinspection equipmentManufactures home appliances and industrialmachinesManufactures cars, trucks, buses andautomobilesManufactures and wholesales game machineequipments and operates hotelsManufactures and distributes cement, steeland machineryTorque Energy, Inc. Explores for oil and gas properties Operates oil and natural gas explorationactivitiesUniq PLCUnited Securities Public Co., Ltd.Valad Property GroupVerigy Ltd.Wholesales chilled and frozen conveniencefood productsProvides securities brokerage andcommodities trading servicesProvides real estate brokerage and investmentmanagement servicesDesigns, develops, manufactures and sellsadvanced test systems and solutions to thesemiconductor industryManufactures, produces and suppliesconvenience foods and ingredientsProvides securities and futures broking andother related servicesProvides investment and fund managementservicesManufactures and sells electronic measuringinstruments, automatic test equipment andother electronic instrumentsWebMoney Corp. Issues electric money and prepaid card Provides telecommunications servicesYash Trading & Finance Ltd. Provides financing services Private group led by Mr. Pradeep KumarSethyZuken, Inc. / Kenny B YK (ChipOne Stop, Inc.)Manufactures and wholesales semiconductors,electric devices, and electronic partsDistributes electronic components andcomputer productswww.mergerstat.com 88
Mergerstat Control Premium Study3rd Quarter <strong>2011</strong>Standard Industrial Classification (SIC) Summary01-09 Agriculture and Forestry10-14 Mining10 Metal mining12 Coal mining13 Oil and gas extraction14 Mining and quarrying of nonmetallic minerals, except fuels15-17 Construction15 Building construction16 Heavy construction17 Construction – special trade contractors20-39 Manufacturing20 Food and kindred products21 Tobacco products22 Textile mill products23 Apparel24-26 Lumber, furniture and paper27 Printing, publishing and allied industries28 Chemicals and allied products29 Petroleum refining30 Rubber and miscellaneous plastics products31 Leather and leather products32-33 Stone, concrete products and primary metals34-35 Fabricated metal products, industrial machinery and computers36 Electrical and electronic machinery and equipment37 Transportation equipment38 Controlling instruments; photographic, medical and optical goods; and clocks39 Miscellaneous manufacturing40-47 Transportation40 Railroad transportation41 Local and suburban transit42 Motor freight transportation43 U.S. Postal Service44 Water transportation45 Air transportation46 Pipelines47 Transportation services48 Communications49 Electric, Gas, and Sanitary Services50-51 Wholesale Trade50 Durable goods51 Nondurable goodsCopyright © 2012, FactSet Mergerstat, LLC. All rights reserved. 89
Mergerstat Control Premium Study3rd Quarter <strong>2011</strong>52-59 Retail Trade52 Building materials and mobile home dealers53 General merchandise stores54 Food stores55 Automotive dealers and gasoline service stations56 Apparel stores57 Furniture and equipment stores58 Eating and drinking places59 Miscellaneous retail60-67 Finance, Insurance, and Real Estate60-61 Banking and credit agencies62 Security and commodity brokers and related services63-64 Insurance companies and agents65 Real estate67 Holding companies and other investment offices70-99 Services and Other70 Hotels and lodging places72 Personal services73-78 Business services79 Amusement and recreation services80-82 Health services83-84 Social services, museums and zoos86 Membership organizations87 Engineering, accounting, research and management88-89 Private households and miscellaneous services99 Nonclassifiable establishmentsCopyright © 2012, FactSet Mergerstat, LLC. All rights reserved. 90
Mergerstat Control Premium Study3rd Quarter <strong>2011</strong>Description of TermsConsideration CodesControl PremiumC = CashD = DebtL = LiabilitiesS = StockX = Other (warrants, contingent payments, etc.)Mergerstat’s control premium is computed by comparing the per share totalconsideration price for one share of the target company’s common stock to theMergerstat unaffected price. This pre-announcement price is selected byMergerstat and based on volume and price fluctuations during the period priorto the acquisition announcement.Guidelines for control premium calculation:• Determination of announcement data• Price and volume retrieval prior to announcement date• Analysis of data for significant fluctuations in price and volume• Selection of a price just prior to this point of change in representativenormal pricing activity• If no significant price and volume fluctuations occur, selection of the priceone day prior to the announcement date• Determination of the final price that the acquirer offers, per share, topurchase the target company's common stock, per terms of a tender offer• Computation of the control premium using the following equation:Purchase Price - Mergerstat Unaffected PriceMergerstat Unaffected PriceMergerstat Unaffected PricePercentage Common Held AfterMinority Discount FormulaPercentage Common Previously HeldPremium 1 DayPremium 1 WeekPremium 1 MonthPremium 2 MonthsTarget company’s common stock price per share unaffected by the acquisitionannouncement. Selected by Mergerstat after analyzing each transaction (seeTransaction Information).Percent of the target company’s common shares held by the acquiring companyfollowing the transaction.1-(1/(1+Control Premium))Percent of the target company’s common shares owned by the acquiringcompany prior to the transaction.Premium computed by comparing the price ultimately paid to the common stockprice one day prior to the announcement date.Premium computed by comparing the price ultimately paid to the common stockprice one week prior to the announcement date.Premium computed by comparing the price ultimately paid to the common stockprice one month prior to the announcement date.Premium computed by comparing the price ultimately paid to the common stockprice two months prior to the announcement date.Copyright © 2012, FactSet Mergerstat, LLC. All rights reserved. 91
Mergerstat Control Premium Study3rd Quarter <strong>2011</strong>Price 1 DayPrice 1 WeekPrice 1 MonthPrice 2 MonthsPurchase Price Per ShareTarget Book ValueTarget EBITTarget EBITDATarget IncomeTarget Market Value of EquityTarget Price/Book Value RatioTarget Price/Earnings RatioTarget Price/Sales RatioTarget company’s common stock price per share one day prior to the acquisitionannouncement date.Target company’s common stock price per share one week prior to theacquisition announcement date.Target company’s common stock price per share one month prior to theacquisition announcement date.Target company’s common stock price per share two months prior to theacquisition announcement date.The total consideration paid per share for the target company’s shares.Target company’s book value, sometimes referred to as shareholder’s equity ornet tangible assets, is based on the latest reported period prior to thetransaction’s closing date. Book value is reported in millions and rounded.Target company’s earnings before interest and taxes (“EBIT”) based on thelatest reported 12-month period prior to the transaction’s announcement date.EBIT is reported in millions of dollars and rounded.Target company’s earnings before interest, taxes, depreciation and amortization(“EBITDA”) based on the latest reported 12-month period prior to thetransaction’s announcement date. EBITDA is reported in millions of dollars androunded.Target company’s net income (loss), excluding extraordinary items, based onthe latest reported 12-month period prior to the transaction’s announcementdate. Income is reported in millions of dollars and rounded.Target market value of equity based on the purchase price per share times totalshares outstanding reported in the period prior to the transaction’sannouncement date. Market value of equity is reported in millions of dollars androunded.Purchase price-to-book value ratio for the target company based on the impliedmarket value of equity divided by book value of the target company.Purchase price-to-earnings ratio for the target company based on the impliedmarket value of equity divided by the latest reported 12-month net income priorto the announcement date.Purchase price-to-sales ratio for the target company based on the implied marketvalue equity divided by the latest reported 12-month sales prior to theannouncement date.Copyright © 2012, FactSet Mergerstat, LLC. All rights reserved. 92
Mergerstat Control Premium Study3rd Quarter <strong>2011</strong>Target SalesTarget TICTarget TIC/EBIT RatioTarget TIC/EBITDA RatioTotal Deal ValueTarget company’s sales based on the latest reported 12-month period prior tothe transaction’s announcement date. Sales are reported in millions of dollarsand rounded.Target company’s implied total invested capital (“TIC”) based on the sum ofimplied market value of equity plus the face value of total interest bearing debtand the book value of preferred stock outstanding prior to the announcementdate.Target TIC-to-EBIT ratio based on the target TIC divided by the latest reported12-month earnings before interest and taxes prior to the announcement date.Target TIC-to-EBITDA ratio based on the target TIC divided by the latestreported 12-month earnings before interest, taxes, depreciation and amortizationprior to the announcement date.The aggregate purchase price given to shareholders of the target company’scommon stock by the acquiring company. Shown in millions of dollars androunded.Copyright © 2012, FactSet Mergerstat, LLC. All rights reserved. 93