- Page 2 and 3:
FREQUENCY MODULATIONVolume IEdited
- Page 4:
1000-3000 watt FM transmitter—194
- Page 8 and 9:
:FREQUENCY MODULATIONVolume ICONTEN
- Page 10 and 11:
FREQUENCY MODULATION NOISECHARACTER
- Page 12 and 13:
NOISE CHARACTERISTICS 3w na - (u—
- Page 14 and 15:
NOISE CHARACTERISTICS 6to the ratio
- Page 16 and 17:
NOISE CHARACTERISTICS 7where C = ca
- Page 18 and 19:
•NOISE CHARACTERISTICS 9nF naF in
- Page 20 and 21:
NOISE CHARACTERISTICS 112G-)F1 aJ.
- Page 22 and 23:
ecurrent impulse. It isNOISE CHARAC
- Page 24 and 25:
NOISE CHARACTERISTICS 15constant sh
- Page 26 and 27:
NOISE CHARACTERISTICS 17/ 1 d(t)- (
- Page 28 and 29: NOISE CHARACTERISTICS 19modulation
- Page 30 and 31: .NOISE CHARACTERISTICS 21vary direc
- Page 32 and 33: NOISE CHARACTERISTICS 23and frequen
- Page 34 and 35: 1NOISE CHARACTERISTICS 25curves for
- Page 36 and 37: NOISE CHARACTERISTICS 27not conveni
- Page 38 and 39: NOISE CHARACTERISTICS 29lation rece
- Page 40 and 41: NOISE CHARACTERISTICS 31theoretical
- Page 42 and 43: NOISE CHARACTERISTICS 33sponding or
- Page 44 and 45: NOISE CHARACTERISTICS 35modulation
- Page 46 and 47: NOISE CHARACTERISTICS 37signal was
- Page 48 and 49: NC1SE CHARACTERISTICS .39Since the
- Page 50 and 51: NOISE CHARACTERISTICS 41tude modula
- Page 52 and 53: NOISE CHARACTERISTICS 43frequency m
- Page 54 and 55: phase modulation maintained constan
- Page 56 and 57: FREQUENCY MODULATION 47band pass of
- Page 58 and 59: FREQUENCY MODULATION 49IV.Interfere
- Page 60 and 61: FREQUENCY MODULATION 61frequency in
- Page 62 and 63: FREQUENCY MODULATION 53maximum perm
- Page 64 and 65: FREQUENCY MODULATION 55Frequency Mo
- Page 66 and 67: BAND WIDTH AND READABILITY INFREQUE
- Page 68 and 69: BAND WIDTH AND READABILITY 59The re
- Page 70 and 71: BAND WIDTH AND READABILITY 61Listen
- Page 72 and 73: BAND WIDTH AND READABILITY 63The cu
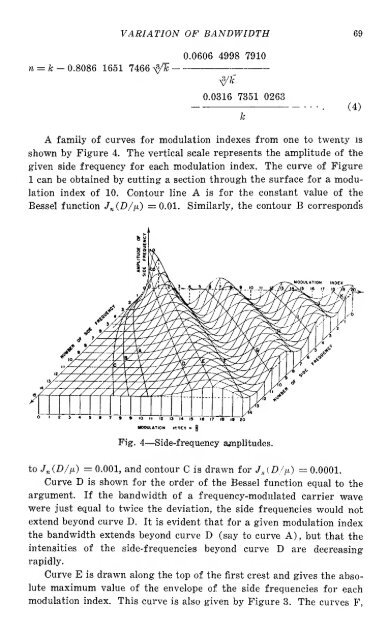
- Page 74 and 75: VARIATION OF BANDWIDTH WITH MODULAT
- Page 76 and 77: VARIATION OF BANDWIDTH 67
- Page 80 and 81: iVARIATION OF BANDWIDTH 71Example:
- Page 82 and 83: ItVARIATION OF BANDWIDTH 73where 6
- Page 84: whereVARIATION OF BANDWIDTHmEn=—
- Page 87 and 88: 78 FREQUENCY MODULATION, Volume I»
- Page 89 and 90: x80 FREQUENCY MODULATION, Volume IJ
- Page 91 and 92: 82 FREQUENCY MODULATION, Volume I
- Page 93 and 94: 84 FREQUENCY MODULATION, Volume IGE
- Page 95 and 96: 86 FREQUENCY MODULATION, Volume Imo
- Page 97 and 98: 88 FREQUENCY MODULATION, Volume Ico
- Page 99 and 100: 90 FREQUENCY MODULATION, Volume IFo
- Page 101 and 102: 92 FREQUENCY MODULATION, Volume Iau
- Page 103 and 104: 94 FREQUENCY MODULATION, Volume Ita
- Page 105 and 106: 96 FREQUENCY MODULATION, Volume Iwl
- Page 107 and 108: 98 FREQUENCY MODULATION, Volume Iwa
- Page 109 and 110: :100 FREQUENCY MODULATION, Volume I
- Page 111 and 112: 102 FREQUENCY MODULATION, Volume Id
- Page 113 and 114: 104 FREQUENCY MODULATION, Volume Ie
- Page 115 and 116: 106 FREQUENCY MODULATION, Volume Ia
- Page 117 and 118: 108 FREQUENCY MODULATION, Volume Ip
- Page 119 and 120: 110 FREQUENCY MODULATION, Volume It
- Page 121 and 122: 112 FREQUENCY MODULATION, Volume Io
- Page 123 and 124: :114 FREQUENCY MODULATION, Volume I
- Page 125 and 126: —110 FREQUENCY MODULATION, Volume
- Page 127 and 128: 118 FREQUENCY MODULATION, Volume If
- Page 129 and 130:
120 FREQUENCY MODULATION, Volume Ic
- Page 131 and 132:
122 FREQUENCY MODULATION, Volume Im
- Page 133 and 134:
124 FREQUENCY MODULATION, Volume IO
- Page 135 and 136:
126 FREQUENCY MODULATION, Volume II
- Page 137 and 138:
128 FREQUENCY MODULATION, Volume Ip
- Page 139 and 140:
130 FREQUENCY MODULATION, Volume Ie
- Page 141 and 142:
132 FREQUENCY MODULATION, Volume It
- Page 143 and 144:
134 FREQUENCY MODULATION, Volume Il
- Page 145 and 146:
136 FREQUENCY MODULATION, Volume 1n
- Page 147 and 148:
138 FREQUENCY MODULATION, Volume Ii
- Page 149 and 150:
140 FREQUENCY MODULATION, Volume IT
- Page 151 and 152:
142 FREQUENCY MODULATION, Volume Ip
- Page 153 and 154:
144 FREQUENCY MODULATION, Volume In
- Page 155 and 156:
146 FREQUENCY MODULATION, Volume It
- Page 157 and 158:
148 FREQUENCY MODULATION, Volume Ip
- Page 159 and 160:
150 FREQUENCY MODULATION, Volume Ia
- Page 161 and 162:
152 FREQUENCY MODULATION, Volume Ia
- Page 163 and 164:
154 FREQUENCY MODULATION, Volume Ic
- Page 165 and 166:
156 FREQUENCY MODULATION, Volume Iu
- Page 167 and 168:
158 FREQUENCY MODULATION, Volume IE
- Page 169 and 170:
IMODULATO*160 FREQUENCY MODULATION,
- Page 171 and 172:
162 FREQUENCY MODULATION, Volume IT
- Page 173 and 174:
cos164 FREQUENCY MODULATION, Volume
- Page 175 and 176:
'166 FREQUENCY MODULATION, Volume I
- Page 177 and 178:
168 FREQUENCY MODULATION, Volume Iu
- Page 179 and 180:
170 FREQUENCY MODULATION, Volume Ic
- Page 181 and 182:
172 FREQUENCY MODULATION, Volume IS
- Page 183 and 184:
174 FREQUENCY MODULATION, Volume IT
- Page 185 and 186:
176 FREQUENCY MODULATION, Volume Iw
- Page 187 and 188:
A PRETUNED TURNSTILE ANTENNA*tByGeo
- Page 189 and 190:
180 FREQUENCY MODULATION, Volume IF
- Page 191 and 192:
182 FREQUENCY MODULATION, Volume IT
- Page 193 and 194:
184 FREQUENCY MODULATION, Volume Is
- Page 195 and 196:
186 FREQUENCY MODULATION, Volume 1f
- Page 197 and 198:
188 FREQUENCY MODULATION, Volume 1M
- Page 199 and 200:
190 FREQUENCY MODULATION, Volume Is
- Page 201 and 202:
192 FREQUENCY MODULATION, Volume I1
- Page 203 and 204:
CHARACTERISTICS OF THE PYLON FM ANT
- Page 205 and 206:
196 FREQUENCY MODULATION, Volume IA
- Page 207 and 208:
198 FREQUENCY MODULATION, Volume Is
- Page 209 and 210:
1200 FREQUENCY MODULATION, Volume-A
- Page 211 and 212:
202 FREQUENCY MODULATION, Volume IR
- Page 213 and 214:
204 FREQUENCY MODULATION, Volume IF
- Page 215 and 216:
206 FREQUENCY MODULATION, Volume II
- Page 217 and 218:
::208 FREQUENCY MODULATION, Volume
- Page 219 and 220:
_.'___.._210 FREQUENCY MODULATION,
- Page 221 and 222:
212 FREQUENCY MODULATION, Volume Im
- Page 223 and 224:
:..=214 FREQUENCY MODULATION, Volum
- Page 225 and 226:
216 FREQUENCY MODULATION, Volume Io
- Page 227 and 228:
218 FREQUENCY MODULATION, Volume IT
- Page 229 and 230:
220 FREQUENCY MODULATION, Volume Jl
- Page 231 and 232:
222 FREQUENCY MODULATION, Volume Ii
- Page 233 and 234:
1224 FREQUENCY MODULATION, Volume I
- Page 235 and 236:
i226 FREQUENCY MODULATION, Volume I
- Page 237 and 238:
228 FREQUENCY MODULATION, Volume Ic
- Page 239 and 240:
IMPULSE NOISE IN F-M RECEPTIONSByVe
- Page 241 and 242:
232 FREQUENCY MODULATION, Volume 1o
- Page 243 and 244:
234 FREQUENCY MODULATION, Volume Ia
- Page 245 and 246:
236 FREQUENCY MODULATION, Volume Iv
- Page 247 and 248:
238 FREQUENCY MODULATION, Volume Is
- Page 249 and 250:
240 FREQUENCY MODULATION, Volume In
- Page 251 and 252:
:242 FREQUENCY MODULATION, Volume I
- Page 253 and 254:
244 FREQUENCY MODULATION, Volume IT
- Page 255 and 256:
246 FREQUENCY MODULATION, Volume It
- Page 257 and 258:
248 FREQUENCY MODULATION, Volume II
- Page 259 and 260:
250 FREQUENCY MODULATION, Volume Is
- Page 261 and 262:
252 FREQUENCY MODULATION, Volume Is
- Page 263 and 264:
254 FREQUENCY MODULATION, Volume IT
- Page 265 and 266:
256 FREQUENCY MODULATION, Volume It
- Page 267 and 268:
'United258 FREQUENCY MODULATION, Vo
- Page 269 and 270:
260 FREQUENCY MODULATION, Volume It
- Page 271 and 272:
262 FREQUENCY MODULATION, Volume IF
- Page 273 and 274:
264 FREQUENCY MODULATION, Volume I-
- Page 275 and 276:
266 FREQUENCY MODULATION, Volume IF
- Page 277 and 278:
268 FREQUENCY MODULATION, Volume IN
- Page 279 and 280:
270 FREQUENCY MODULATION, Volume Iq
- Page 281 and 282:
I272 FREQUENCY MODULATION, Volume I
- Page 283 and 284:
274 FREQUENCY MODULATION, Volume IT
- Page 285 and 286:
;276 FREQUENCY MODULATION, Volume 1
- Page 287 and 288:
1278 FREQUENCY MODULATION, Volume I
- Page 289 and 290:
=280 FREQUENCY MODULATION, Volume I
- Page 291 and 292:
282 FREQUENCY MODULATION, Volume 1F
- Page 293 and 294:
+[\284 FREQUENCY MODULATION, Volume
- Page 295 and 296:
286 FREQUENCY MODULATION, Volume IF
- Page 297 and 298:
:288 FREQUENCY MODULATION, Volume I
- Page 299 and 300:
290 FREQUENCY MODULATION, Volume 1C
- Page 301 and 302:
292 FREQUENCY MODULATION, Volume IF
- Page 303 and 304:
294 FREQUENCY MODULATION, Volume Ia
- Page 305 and 306:
296 FREQUENCY MODULATION, Volume Il
- Page 307 and 308:
298 FREQUENCY MODULATION, Volume IR
- Page 309 and 310:
300 FREQUENCY MODULATION, Volume IA
- Page 311 and 312:
302 FREQUENCY MODULATION, Volume Ic
- Page 313 and 314:
304 FREQUENCY MODULATION, Volume I=
- Page 315 and 316:
306 FREQUENCY MODULATION, Volume Io
- Page 317 and 318:
308 FREQUENCY MODULATION, Volume I1
- Page 319 and 320:
310 FREQUENCY MODULATION, Volume Ia
- Page 321 and 322:
312 FREQUENCY MODULATION, Volume Id
- Page 323 and 324:
:314 FREQUENCY MODULATION, Volume I
- Page 325 and 326:
316 FREQUENCY MODULATION, Volume IT
- Page 327 and 328:
318 FREQUENCY MODULATION, Volume 1r
- Page 329 and 330:
320 FREQUENCY MODULATION, Volume Iw
- Page 331 and 332:
,322 FREQUENCY MODULATION, Volume 1
- Page 333 and 334:
-324 FREQUENCY MODULATION, Volume I
- Page 335 and 336:
.326 FREQUENCY MODULATION, Volume 1
- Page 337 and 338:
328 FREQUENCY MODULATION, Volume 1
- Page 339 and 340:
330 FREQUENCY MODULATION, Volume 1F
- Page 341 and 342:
332 FREQUENCY MODULATION, Volume IC
- Page 343 and 344:
334 FREQUENCY MODULATION, Volume IT
- Page 345 and 346:
336 FREQUENCY MODULATION, Volume Iw
- Page 347 and 348:
33dFREQUENCY MODULATION, Volume ITh
- Page 349 and 350:
340 FREQUENCY MODULATION, Volume IT
- Page 351 and 352:
'342 FREQUENCY MODULATION, Volume 1
- Page 353 and 354:
'344 FREQUENCY MODULATION, Volume I
- Page 355 and 356:
e346 FREQUENCY MODULATION, Volume I
- Page 357 and 358:
348FREQUENCY MODULATION, Volume ILe
- Page 359 and 360:
:350 FREQUENCY MODULATION, Volume I
- Page 361 and 362:
352 FREQUENCY MODULATION, Volume I+
- Page 363 and 364:
}354 FREQUENCY MODULATION, Volume I
- Page 365 and 366:
356 FREQUENCY MODULATION, Volume I+
- Page 367 and 368:
THE RATIO DETECTOR*!ByStuart Wm. Se
- Page 369 and 370:
360 FREQUENCY MODULATION, Volume Ii
- Page 371 and 372:
362 FREQUENCY MODULATION, Volume 1F
- Page 373 and 374:
364 FREQUENCY MODULATION, Volume IT
- Page 375 and 376:
366 FREQUENCY MODULATION, Volume IT
- Page 377 and 378:
368 FREQUENCY MODULATION, Volume Id
- Page 379 and 380:
370 FREQUENCY MODULATION, Volume It
- Page 381 and 382:
372 FREQUENCY MODULATION, Volume Ia
- Page 383 and 384:
374 FREQUENCY MODULATION, Volume 1F
- Page 385 and 386:
376 FREQUENCY MODULATION, Volume Im
- Page 387 and 388:
378 FREQUENCY MODULATION, Volume IE
- Page 389 and 390:
380 FREQUENCY MODULATION, Volume IT
- Page 391 and 392:
382 FREQUENCY MODULATION, Volume Ig
- Page 393 and 394:
384 FREQUENCY MODULATION, Volume Ii
- Page 395 and 396:
386 FREQUENCY MODULATION, Volume IT
- Page 397 and 398:
388 FREQUENCY MODULATION, Volume Ic
- Page 399 and 400:
390 FREQUENCY MODULATION, Volume IM
- Page 401 and 402:
——392 FREQUENCY MODULATION, Vol
- Page 403 and 404:
394 FREQUENCY MODULATION, Volume IT
- Page 405 and 406:
DUPLEX TRANSMISSION OF FREQUENCY-MO
- Page 407 and 408:
I398 FREQUENCY MODULATION, Volume I
- Page 409 and 410:
1400 FREQUENCY MODULATION, Volume I
- Page 411 and 412:
402 FREQUENCY MODULATION, Volume Ii
- Page 413 and 414:
404 FREQUENCY MODULATION, Volume II
- Page 415 and 416:
406 FREQUENCY MODULATION, Volume Im
- Page 417 and 418:
408 FREQUENCY MODULATION, Volume Ir
- Page 419 and 420:
USE OF SUBCARRIER FREQUENCY MODULAT
- Page 421 and 422:
412 FREQUENCY MODULATION, Volume Iv
- Page 423 and 424:
414 FREQUENCY MODULATION, Volume Io
- Page 425 and 426:
416 FREQUENCY MODULATION, Volume IA
- Page 427 and 428:
418 FREQUENCY MODULATION, Volume Io
- Page 429 and 430:
i420 FREQUENCY MODULATION, Volume 1
- Page 431 and 432:
422 FREQUENCY MODULATION, Volume Im
- Page 433 and 434:
.424 FREQUENCY MODULATION, Volume I
- Page 435 and 436:
.426 FREQUENCY MODULATION, Volume I
- Page 437 and 438:
428 FREQUENCY MODULATION, Volume Ij
- Page 439 and 440:
430 FREQUENCY MODULATION, Volume Ib
- Page 441 and 442:
432 FREQUENCY MODULATION, Volume 1
- Page 443 and 444:
434 FREQUENCY MODULATION, Volume If
- Page 445 and 446:
436 FREQUENCY MODULATION, Volume Is
- Page 447 and 448:
.438 FREQUENCY MODULATION, Volume I
- Page 449 and 450:
440 FREQUENCY MODULATION, Volume I5
- Page 451 and 452:
:.442 FREQUENCY MODULATION, Volume
- Page 453 and 454:
444 FREQUENCY MODULATION, Volume IE
- Page 455 and 456:
..446 FREQUENCY MODULATION, Volume
- Page 457 and 458:
448 FREQUENCY MODULATION, Volume Iq
- Page 459 and 460:
eis450 FREQUENCY MODULATION, Volume
- Page 461 and 462:
—PUSH-PULL FREQUENCY MODULATED CI
- Page 463 and 464:
454 FREQUENCY MODULATION, Volume Im
- Page 465 and 466:
456 FREQUENCY MODULATION, Volume IS
- Page 467 and 468:
458 FREQUENCY MODULATION, Volume Iw
- Page 469 and 470:
460 FREQUENCY MODULATION, Volume IT
- Page 471 and 472:
462 FREQUENCY MODULATION, Volume Id
- Page 473 and 474:
464 FREQUENCY MODULATION, Volume Io
- Page 475 and 476:
466 FREQUENCY MODULATION, Volume Io
- Page 477 and 478:
468 FREQUENCY MODULATION, Volume It
- Page 479 and 480:
470 FREQUENCY MODULATION, Volume IT
- Page 481 and 482:
.let472 FREQUENCY MODULATION, Volum
- Page 483 and 484:
474 FREQUENCY MODULATION, Volume IE
- Page 485 and 486:
476 FREQUENCY MODULATION, Volume Iw
- Page 487 and 488:
478 FREQUENCY MODULATION, Volume IC
- Page 489 and 490:
480 FREQUENCY MODULATION, Volume IF
- Page 491 and 492:
. 2•482FREQUENCY MODULATION, Volu
- Page 493 and 494:
ii484FREQUENCY MODULATION, Volume I
- Page 495 and 496:
486 FREQUENCY MODULATION, Volume II
- Page 497 and 498:
:488 FREQUENCY MODULATION, Volume I
- Page 499 and 500:
490 FREQUENCY MODULATION, Volume IE
- Page 501 and 502:
492 FREQUENCY MODULATION, Volume IS
- Page 503 and 504:
«/„I|J494 FREQUENCY MODULATION,
- Page 505 and 506:
i'Iea496FREQUENCY MODULATION, Volum
- Page 507 and 508:
6a—498 FREQUENCY MODULATION, Volu
- Page 509 and 510:
500 FREQUENCY MODULATION, Volume IA
- Page 511 and 512:
502 FREQUENCY MODULATION, Volume 1C
- Page 513 and 514:
504 FREQUENCY MODULATION, Volume IF
- Page 516 and 517:
APPENDIX IFREQUENCY MODULATIONA Bib
- Page 518 and 519:
FREQUENCY MODULATION BIBLIOGRAPHY"F
- Page 520 and 521:
FM BIBLIOGRAPHY 511"Input Impedance
- Page 522 and 523:
APPENDIX IIFM STATION PLACEMENT AND
- Page 524:
STATION PLACEMENT AND FIELD SURVEY