Wind Power in Estonia - Elering
Wind Power in Estonia - Elering
Wind Power in Estonia - Elering

Create successful ePaper yourself
Turn your PDF publications into a flip-book with our unique Google optimized e-Paper software.
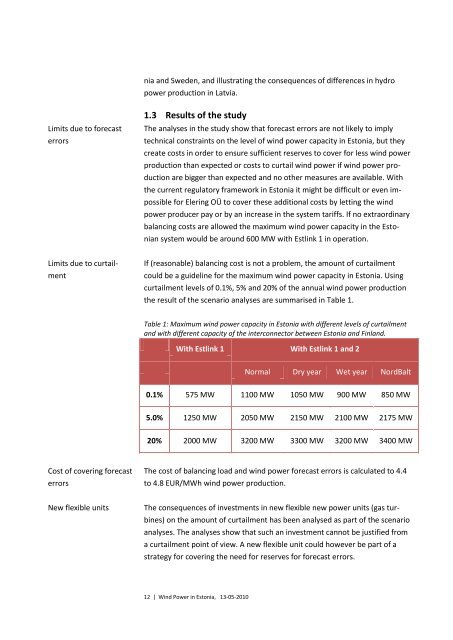
nia and Sweden, and illustrat<strong>in</strong>g the consequences of differences <strong>in</strong> hydropower production <strong>in</strong> Latvia.Limits due to forecasterrors1.3 Results of the studyThe analyses <strong>in</strong> the study show that forecast errors are not likely to implytechnical constra<strong>in</strong>ts on the level of w<strong>in</strong>d power capacity <strong>in</strong> <strong>Estonia</strong>, but theycreate costs <strong>in</strong> order to ensure sufficient reserves to cover for less w<strong>in</strong>d powerproduction than expected or costs to curtail w<strong>in</strong>d power if w<strong>in</strong>d power productionare bigger than expected and no other measures are available. Withthe current regulatory framework <strong>in</strong> <strong>Estonia</strong> it might be difficult or even impossiblefor Eler<strong>in</strong>g OÜ to cover these additional costs by lett<strong>in</strong>g the w<strong>in</strong>dpower producer pay or by an <strong>in</strong>crease <strong>in</strong> the system tariffs. If no extraord<strong>in</strong>arybalanc<strong>in</strong>g costs are allowed the maximum w<strong>in</strong>d power capacity <strong>in</strong> the <strong>Estonia</strong>nsystem would be around 600 MW with Estl<strong>in</strong>k 1 <strong>in</strong> operation.Limits due to curtailmentIf (reasonable) balanc<strong>in</strong>g cost is not a problem, the amount of curtailmentcould be a guidel<strong>in</strong>e for the maximum w<strong>in</strong>d power capacity <strong>in</strong> <strong>Estonia</strong>. Us<strong>in</strong>gcurtailment levels of 0.1%, 5% and 20% of the annual w<strong>in</strong>d power productionthe result of the scenario analyses are summarised <strong>in</strong> Table 1.Table 1: Maximum w<strong>in</strong>d power capacity <strong>in</strong> <strong>Estonia</strong> with different levels of curtailmentand with different capacity of the <strong>in</strong>terconnector between <strong>Estonia</strong> and F<strong>in</strong>land.With Estl<strong>in</strong>k 1 With Estl<strong>in</strong>k 1 and 2Normal Dry year Wet year NordBalt0.1% 575 MW 1100 MW 1050 MW 900 MW 850 MW5.0% 1250 MW 2050 MW 2150 MW 2100 MW 2175 MW20% 2000 MW 3200 MW 3300 MW 3200 MW 3400 MWCost of cover<strong>in</strong>g forecasterrorsThe cost of balanc<strong>in</strong>g load and w<strong>in</strong>d power forecast errors is calculated to 4.4to 4.8 EUR/MWh w<strong>in</strong>d power production.New flexible unitsThe consequences of <strong>in</strong>vestments <strong>in</strong> new flexible new power units (gas turb<strong>in</strong>es)on the amount of curtailment has been analysed as part of the scenarioanalyses. The analyses show that such an <strong>in</strong>vestment cannot be justified froma curtailment po<strong>in</strong>t of view. A new flexible unit could however be part of astrategy for cover<strong>in</strong>g the need for reserves for forecast errors.12 | <strong>W<strong>in</strong>d</strong> <strong>Power</strong> <strong>in</strong> <strong>Estonia</strong>, 13-05-2010