Annual report for 2004/05 - Hemas Holdings, Ltd
Annual report for 2004/05 - Hemas Holdings, Ltd
Annual report for 2004/05 - Hemas Holdings, Ltd
- No tags were found...

You also want an ePaper? Increase the reach of your titles
YUMPU automatically turns print PDFs into web optimized ePapers that Google loves.
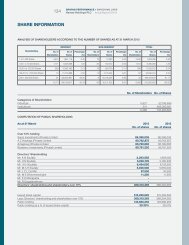
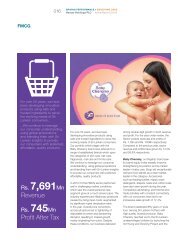
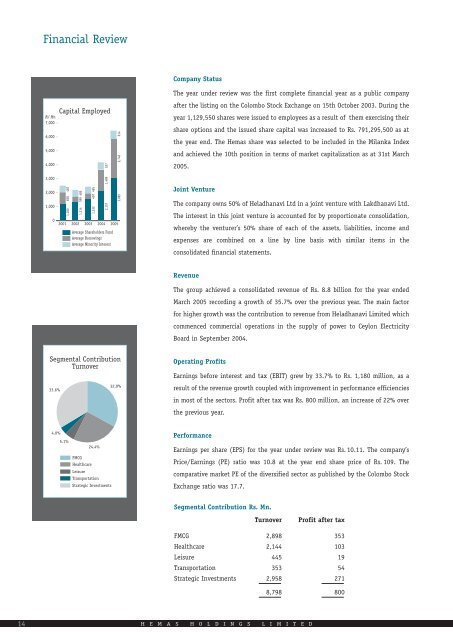
Financial ReviewCompany StatusRs' Mn.7,0006,00<strong>05</strong>,0004,0003,0002,0001,0000Capital Employed20011,180 838 48720021,314 399 48520031,532 407 495<strong>2004</strong>2,157 1,489 527Average Shareholders FundAverage BorrowingsAverage Minority Interest3,085 2,746 61420<strong>05</strong>The year under review was the first complete financial year as a public companyafter the listing on the Colombo Stock Exchange on 15th October 2003. During theyear 1,129,550 shares were issued to employees as a result of them exercising theirshare options and the issued share capital was increased to Rs. 791,295,500 as atthe year end. The <strong>Hemas</strong> share was selected to be included in the Milanka Indexand achieved the 10th position in terms of market capitalization as at 31st March20<strong>05</strong>.Joint VentureThe company owns 50% of Heladhanavi <strong>Ltd</strong> in a joint venture with Lakdhanavi <strong>Ltd</strong>.The interest in this joint venture is accounted <strong>for</strong> by proportionate consolidation,whereby the venturer’s 50% share of each of the assets, liabilities, income andexpenses are combined on a line by line basis with similar items in theconsolidated financial statements.RevenueThe group achieved a consolidated revenue of Rs. 8.8 billion <strong>for</strong> the year endedMarch 20<strong>05</strong> recording a growth of 35.7% over the previous year. The main factor<strong>for</strong> higher growth was the contribution to revenue from Heladhanavi Limited whichcommenced commercial operations in the supply of power to Ceylon ElectricityBoard in September <strong>2004</strong>.Segmental ContributionTurnover33.6%32.9%Operating ProfitsEarnings be<strong>for</strong>e interest and tax (EBIT) grew by 33.7% to Rs. 1,180 million, as aresult of the revenue growth coupled with improvement in per<strong>for</strong>mance efficienciesin most of the sectors. Profit after tax was Rs. 800 million, an increase of 22% overthe previous year.4.0%5.1%24.4%FMCGHealthcareLeisureTransportationStrategic InvestmentsPer<strong>for</strong>manceEarnings per share (EPS) <strong>for</strong> the year under review was Rs. 10.11. The company’sPrice/Earnings (PE) ratio was 10.8 at the year end share price of Rs. 109. Thecomparative market PE of the diversified sector as published by the Colombo StockExchange ratio was 17.7.Segmental Contribution Rs. Mn.TurnoverProfit after taxFMCG 2,898 353Healthcare 2,144 103Leisure 445 19Transportation 353 54Strategic Investments 2,958 2718,798 80014H E M A S H O L D I N G S L I M I T E D