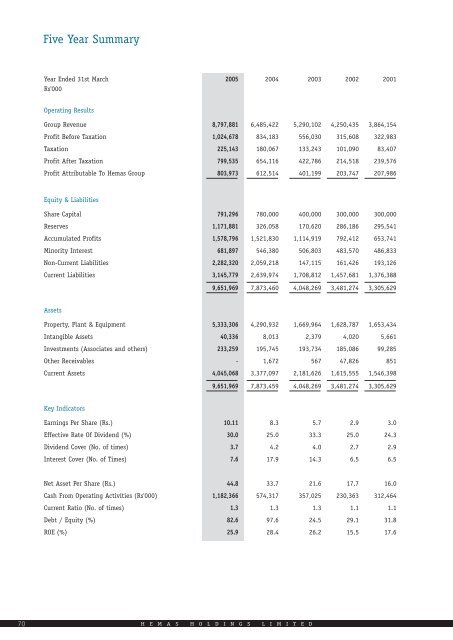
Five Year SummaryYear Ended 31st March 20<strong>05</strong> <strong>2004</strong> 2003 2002 2001Rs'000Operating ResultsGroup Revenue 8,797,881 6,485,422 5,290,102 4,250,435 3,864,154Profit Be<strong>for</strong>e Taxation 1,024,678 834,183 556,030 315,608 322,983Taxation 225,143 180,067 133,243 101,090 83,407Profit After Taxation 799,535 654,116 422,786 214,518 239,576Profit Attributable To <strong>Hemas</strong> Group 803,973 612,514 401,199 203,747 207,986Equity & LiabilitiesShare Capital 791,296 780,000 400,000 300,000 300,000Reserves 1,171,881 326,<strong>05</strong>8 170,620 286,186 295,541Accumulated Profits 1,578,796 1,521,830 1,114,919 792,412 653,741Minority Interest 681,897 546,380 506,803 483,570 486,833Non-Current Liabilities 2,282,320 2,<strong>05</strong>9,218 147,115 161,426 193,126Current Liabilities 3,145,779 2,639,974 1,708,812 1,457,681 1,376,3889,651,969 7,873,460 4,048,269 3,481,274 3,3<strong>05</strong>,629AssetsProperty, Plant & Equipment 5,333,306 4,290,932 1,669,964 1,628,787 1,653,434Intangible Assets 40,336 8,013 2,379 4,020 5,661Investments (Associates and others) 233,259 195,745 193,734 185,086 99,285Other Receivables - 1,672 567 47,826 851Current Assets 4,045,068 3,377,097 2,181,626 1,615,555 1,546,3989,651,969 7,873,459 4,048,269 3,481,274 3,3<strong>05</strong>,629Key IndicatorsEarnings Per Share (Rs.) 10.11 8.3 5.7 2.9 3.0Effective Rate Of Dividend (%) 30.0 25.0 33.3 25.0 24.3Dividend Cover (No. of times) 3.7 4.2 4.0 2.7 2.9Interest Cover (No. of Times) 7.6 17.9 14.3 6.5 6.5Net Asset Per Share (Rs.) 44.8 33.7 21.6 17.7 16.0Cash From Operating Activities (Rs'000) 1,182,366 574,317 357,025 230,363 312,464Current Ratio (No. of times) 1.3 1.3 1.3 1.1 1.1Debt / Equity (%) 82.6 97.6 24.5 29.1 31.8ROE (%) 25.9 28.4 26.2 15.5 17.670H E M A S H O L D I N G S L I M I T E D
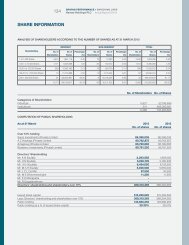
Shareholder In<strong>for</strong>mationSTOCK EXCHANGE LISTING<strong>Hemas</strong> <strong>Holdings</strong> Limited (HHL) was listed as a Public Quoted Company on the Colombo Stock Exchange on 15th October 2003.ANALYSIS OF SHAREHOLDERS - AS PER THE NUMBER OF SHARES AS AT 31.03.<strong>05</strong>RESIDENT NON RESIDENT TOTALShareholdings Number of Number of Number ofShareholders No of Shares (%) Shareholders No of Shares (%) Shareholders No of shares (%)1 to 1000 Shares 3,311 594,250 0.75 18 5,500 0.01 3,329 599,750 0.761001 to 5,000 Shares 171 371,417 0.47 9 25,100 0.03 180 396,517 0.5<strong>05</strong>,001 to 10,000 Shares 37 264,900 0.33 1 5,900 0.01 38 270,800 0.3410,001 to 50,000 Shares 40 868,250 1.10 3 83,600 0.11 43 951,850 1.2150,001 to 100,000 Shares 8 550,700 0.70 2 126,600 0.16 10 677,300 0.86100,001 to 500,000 Shares 13 2,673,000 3.38 2 728,500 0.92 15 3,401,500 4.3<strong>05</strong>00,001 to 1000,000 Shares 0 0 0 2 1,388,800 1.76 2 1,388,800 1.76Over 1,000,000 Shares 9 67,373,933 85.13 2 4,069,100 5.14 11 71,443,033 90.273,589 72,696,450 91.86 39 6,433,100 8.14 3,628 79,129,550 100.00As at 31st March <strong>2004</strong> 4,954 72,541,500 93,01 54 5,458,500 6.99 5,008 78,000,000 100.00SHARE TRADINGNo. of transactions <strong>for</strong> the period to 31st March 20<strong>05</strong> - 3,868 (<strong>2004</strong> - 12,077)No. of shares traded - 7,676,100 (<strong>2004</strong> - 15,361,800)Value of the shares traded - Rs. 738 million (<strong>2004</strong> - Rs. 1,315 million)Market PriceHighest - Rs. 110.00 (24th March 20<strong>05</strong>)Lowest - Rs. 75.00 (06th April <strong>2004</strong>)As at year ended - Rs. 109.00Issue Price - Rs. 50.00Market Capitalisation as at 31th March 20<strong>05</strong> - Rs. 8,625 million (<strong>2004</strong> - Rs. 6,884 million)TWENTY LARGEST SHAREHOLDERS OF THE COMPANY20<strong>05</strong> <strong>2004</strong>No. of Shares % No. of Shares %A Z <strong>Holdings</strong> (Private) Limited 14,522,060 18.35 14,522,060 18.62Saraz Investments (Private) Limited 13,823,366 17.47 13,823,366 17.72Blueberry Investments (Private) Limited 13,725,000 17.34 13,725,000 17.60Amagroup (Private) Limited 13,724,907 17.34 13,724,907 17.60HSBC Intl NOM LTD - SNFE - Arisaig India Fund Limited 2,995,500 3.79 1,853,700 2.38Mr. I. A. H. Esufally 2,530,600 3.20 2,500,000 3.21Mr. A. N. Esufally 2,504,900 3.17 2,500,000 3.21Mr. H. N. Esufally 2,500,000 3.16 2,500,000 3.21Mr. M. A. H. Esufally 2,500,000 3.16 2,500,000 3.21Employees Provident Fund 1,573,700 1.99 - -HSBC Intl NOM LTD - MSIL - Asian Smaller Companies Plus <strong>Ltd</strong>. 1,073,600 1.36 1,073,600 1.38Mr R. Rajaratnam 768,500 0.97 998,000 1.28Voyager Capital (International) Limited 620,300 0.78 419,000 0.54DFCC Bank 485,700 0.61 - -Gold Investment Limited 377,000 0.48 382,000 0.49Explorer Capital (Intl) Services <strong>Ltd</strong> 351,500 0.44 - -Cocoshell Activated Carbon Company Limited 318,400 0.40 298,700 0.38MJF Exports <strong>Ltd</strong> 272,800 0.34 - -Lanka Ventures Limited 223,600 0.28 210,800 0.27Hatton National Bank Limited 216,100 0.27 252,000 0.32The Percentage of shares held by the Public as at 31st March 20<strong>05</strong> - 16.64%A N N U A L R E P O R T 2 0 0 4 - 2 0 0 5 71