Annual report for 2004/05 - Hemas Holdings, Ltd
Annual report for 2004/05 - Hemas Holdings, Ltd
Annual report for 2004/05 - Hemas Holdings, Ltd
- No tags were found...

Create successful ePaper yourself
Turn your PDF publications into a flip-book with our unique Google optimized e-Paper software.
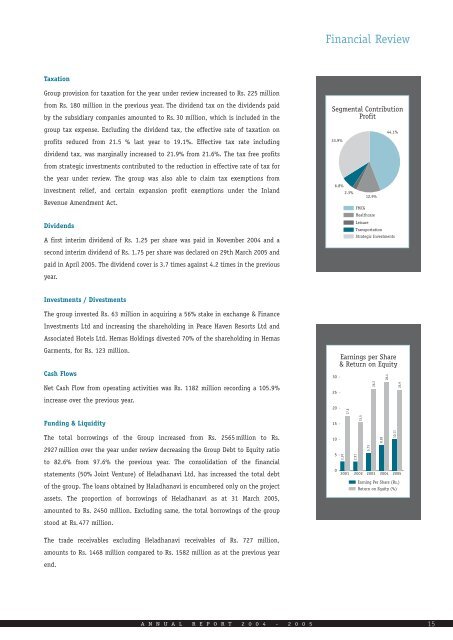
Financial ReviewTaxationGroup provision <strong>for</strong> taxation <strong>for</strong> the year under review increased to Rs. 225 millionfrom Rs. 180 million in the previous year. The dividend tax on the dividends paidby the subsidiary companies amounted to Rs. 30 million, which is included in theSegmental ContributionProfitgroup tax expense. Excluding the dividend tax, the effective rate of taxation onprofits reduced from 21.5 % last year to 19.1%. Effective tax rate includingdividend tax, was marginally increased to 21.9% from 21.6%. The tax free profitsfrom strategic investments contributed to the reduction in effective rate of tax <strong>for</strong>33.9%44.1%the year under review. The group was also able to claim tax exemptions frominvestment relief, and certain expansion profit exemptions under the InlandRevenue Amendment Act.DividendsA first interim dividend of Rs. 1.25 per share was paid in November <strong>2004</strong> and a6.8%2.3%12.9%FMCGHealthcareLeisureTransportationStrategic Investmentssecond interim dividend of Rs. 1.75 per share was declared on 29th March 20<strong>05</strong> andpaid in April 20<strong>05</strong>. The dividend cover is 3.7 times against 4.2 times in the previousyear.Investments / DivestmentsThe group invested Rs. 63 million in acquiring a 56% stake in exchange & FinanceInvestments <strong>Ltd</strong> and increasing the shareholding in Peace Haven Resorts <strong>Ltd</strong> andAssociated Hotels <strong>Ltd</strong>. <strong>Hemas</strong> <strong>Holdings</strong> divested 70% of the shareholding in <strong>Hemas</strong>Garments, <strong>for</strong> Rs. 123 million.Cash Flows30Earnings per Share& Return on Equity28.4Net Cash Flow from operating activities was Rs. 1182 million recording a 1<strong>05</strong>.9%increase over the previous year.252017.626.225.9Funding & Liquidity1515.5The total borrowings of the Group increased from Rs. 2565 million to Rs.2927 million over the year under review decreasing the Group Debt to Equity ratioto 82.6% from 97.6% the previous year. The consolidation of the financialstatements (50% Joint Venture) of Heladhanavi <strong>Ltd</strong>, has increased the total debtof the group. The loans obtained by Haladhanavi is encumbered only on the projectassets. The proportion of borrowings of Heladhanavi as at 31 March 20<strong>05</strong>,1<strong>05</strong>2.972.915.738.2810.1102001 2002 2003 <strong>2004</strong> 20<strong>05</strong>Earning Per Share (Rs.)Return on Equity (%)amounted to Rs. 2450 million. Excluding same, the total borrowings of the groupstood at Rs. 477 million.The trade receivables excluding Heladhanavi receivables of Rs. 727 million,amounts to Rs. 1468 million compared to Rs. 1582 million as at the previous yearend.A N N U A L R E P O R T 2 0 0 4 - 2 0 0 5 15