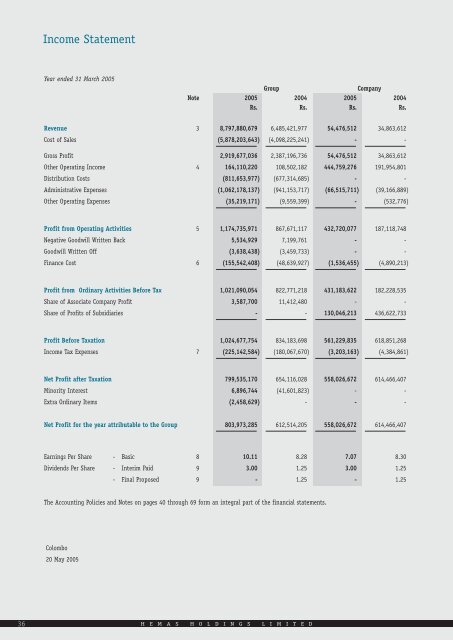
Income StatementYear ended 31 March 20<strong>05</strong>GroupCompanyNote 20<strong>05</strong> <strong>2004</strong> 20<strong>05</strong> <strong>2004</strong>Rs. Rs. Rs. Rs.Revenue 3 8,797,880,679 6,485,421,977 54,476,512 34,863,612Cost of Sales (5,878,203,643) (4,098,225,241) - -Gross Profit 2,919,677,036 2,387,196,736 54,476,512 34,863,612Other Operating Income 4 164,110,220 108,502,182 444,759,276 191,954,801Distribution Costs (811,653,977) (677,314,685) - -Administrative Expenses (1,062,178,137) (941,153,717) (66,515,711) (39,166,889)Other Operating Expenses (35,219,171) (9,559,399) - (532,776)Profit from Operating Activities 5 1,174,735,971 867,671,117 432,720,077 187,118,748Negative Goodwill Written Back 5,534,929 7,199,761 - -Goodwill Written Off (3,638,438) (3,459,733) - -Finance Cost 6 (155,542,408) (48,639,927) (1,536,455) (4,890,213)Profit from Ordinary Activities Be<strong>for</strong>e Tax 1,021,090,<strong>05</strong>4 822,771,218 431,183,622 182,228,535Share of Associate Company Profit 3,587,700 11,412,480 - -Share of Profits of Subsidiaries - - 130,046,213 436,622,733Profit Be<strong>for</strong>e Taxation 1,024,677,754 834,183,698 561,229,835 618,851,268Income Tax Expenses 7 (225,142,584) (180,067,670) (3,203,163) (4,384,861)Net Profit after Taxation 799,535,170 654,116,028 558,026,672 614,466,407Minority Interest 6,896,744 (41,601,823) - -Extra Ordinary Items (2,458,629) - - -Net Profit <strong>for</strong> the year attributable to the Group 803,973,285 612,514,2<strong>05</strong> 558,026,672 614,466,407Earnings Per Share - Basic 8 10.11 8.28 7.07 8.30Dividends Per Share - Interim Paid 9 3.00 1.25 3.00 1.25- Final Proposed 9 - 1.25 - 1.25The Accounting Policies and Notes on pages 40 through 69 <strong>for</strong>m an integral part of the financial statements.Colombo20 May 20<strong>05</strong>36H E M A S H O L D I N G S L I M I T E D
Balance SheetAs at 31 March 20<strong>05</strong>Note Group CompanyASSETS 20<strong>05</strong> <strong>2004</strong> 20<strong>05</strong> <strong>2004</strong>Non-Current Assets Rs. Rs. Rs. Rs.Property, Plant & Equipment - At Cost 10 3,825,182,533 3,346,930,862 67,795,296 35,738,440- At Valuation 10 1,508,123,877 944,001,539 120,942,500 82,698,027Intangible Assets 11 40,335,770 8,012,700 - -Investments in Subsidiaries 12 - - 3,333,100,870 2,750,680,710Investments in Associates 13 195,897,526 120,567,197 83,410,456 41,386,045Other Investments 14 37,361,308 75,178,151 2,5<strong>05</strong>,000 14,178,020Other Receivables - 1,671,650 - -5,606,901,014 4,496,362,099 3,607,754,122 2,924,681,242Current AssetsInventories 15 732,935,986 781,689,738 - -Trade and Other Receivables 16 2,195,110,152 1,991,157,991 10,940,767 8,257,460Loans Due from Related Parties 17 - - 174,504,611 181,130,531Investments 14 306,738 306,738 1,094,9<strong>05</strong> 22,306,296Tax Recoverable 18,885,094 12,292,112 2,703,604 -Amounts Due from Related Parties 18 145,468 14,480 383,395,549 375,895,803Short Term Cash Investments 28 439,752,239 120,602,249 62,743,210 66,920,365Cash and Bank Balances 28 657,932,581 471,034,<strong>05</strong>6 170,392,257 6,243,3724,045,068,258 3,377,097,364 8<strong>05</strong>,774,903 660,753,827Total Assets 9,651,969,272 7,873,459,463 4,413,529,025 3,585,435,069EQUITY AND LIABILITIESCapital and ReservesIssued Share Capital 19 791,295,500 780,000,000 791,295,500 780,000,000Reserves 20 827,991,413 28,669,843 622,906,729 1,684,462Share Premium 343,889,834 297,387,834 343,889,834 297,387,834Accumulated Profits 1,578,796,259 1,525,508,670 1,787,933,342 1,547,377,945Preliminary Expenses - (3,678,776) - -Total Equity 3,541,973,006 2,627,887,571 3,546,025,4<strong>05</strong> 2,626,450,241Minority Interest 681,897,221 546,380,272 - -Non-Current LiabilitiesNon Interest Bearing Loans and Borrowings 21 11,274,897 7,696,816 536,625,644 554,220,229Interest Bearing Loans & Borrowings 22 2,084,462,170 1,868,131,264 - -Deferred Income Tax 23 91,326,474 90,115,751 10,8<strong>05</strong>,541 11,071,290Other Deferred Liabilities 24 84,083,421 78,634,094 7,036,396 5,835,658Negative Goodwill 25 11,173,295 8,019,871 - -Trade and Other Payables - 6,620,118 - -2,282,320,257 2,<strong>05</strong>9,217,914 554,467,581 571,127,177Current LiabilitiesTrade and Other Payables 26 1,910,273,670 1,873,704,555 17,576,499 8,014,799Dividends Payable 133,404,<strong>05</strong>4 - 131,173,989 -Income Tax Liabilities 66,939,018 69,264,065 5,799,774 4,259,815Amounts Due to Related Parties 27 189,096,330 - 158,436,813 303,155,683Non Interest Bearing Loans & Borrowings 21 3,340,285 550,000 - -Interest Bearing Loans & Borrowings 22 842,725,431 696,455,086 48,964 72,427,3543,145,778,788 2,639,973,706 313,036,039 387,857,651Total Equity,Minority Interest and Liabilities 9,651,969,272 7,873,459,463 4,413,529,025 3,585,435,069The Board of Directors is responsible <strong>for</strong> the preparation and presentation of these financial statements.Signed <strong>for</strong> and on behalf of the Board by,Husein EsufallyMs. Serena FonsekaChief Executive OfficerGroup Finance DirectorThe Accounting Policies and Notes on pages 40 through 69 <strong>for</strong>m an integral part of the financial statements.Colombo20 May 20<strong>05</strong>A N N U A L R E P O R T 2 0 0 4 - 2 0 0 5 37