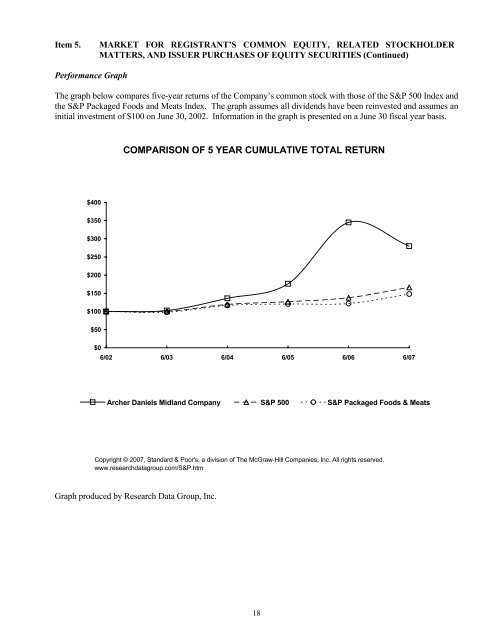
Item 5.MARKET FOR REGISTRANT’S COMMON EQUITY, RELATED STOCKHOLDERMATTERS, AND ISSUER PURCHASES OF EQUITY SECURITIES (Continued)Performance GraphThe graph below compares five-year returns of the Company’s common stock with those of the S&P 500 Index andthe S&P Packaged Foods and Meats Index. The graph assumes all dividends have been reinvested and assumes aninitial investment of $100 on June 30, 2002. Information in the graph is presented on a June 30 fiscal year basis.COMPARISON OF 5 YEAR CUMULATIVE TOTAL RETURN$400$350$300$250$200$150$100$50$06/02 6/03 6/04 6/05 6/06 6/07Archer Daniels Midland Company S&P 500 S&P Packaged Foods & MeatsCopyright © 2007, Standard & Poor's, a division of The McGraw-Hill Companies, Inc. All rights reserved.www.researchdatagroup.com/S&P.htmGraph produced by Research Data Group, Inc.18
Item 6.SELECTED FINANCIAL DATASelected Financial Data(In millions, except ratio and per share data)2007 2006 2005 2004 2003Net sales and other operating income $44,018 $36,596 $35,943 $36,151 $30,708Depreciation 701 657 665 686 644Net earnings 2,162 1,312 1,044 495 451Basic earnings per common share 3.32 2.01 1.60 0.76 0.70Diluted earnings per common share 3.30 2.00 1.59 0.76 0.70Cash dividends 281 242 209 174 156Per common share 0.43 0.37 0.32 0.27 0.24Working capital $7,254 $5,661 $4,344 $3,589 $3,274Per common share 11.28 8.63 6.68 5.51 5.08Current ratio 1.9 1.9 1.8 1.5 1.6Inventories 6,060 4,677 3,907 4,592 3,550Net property, plant, and equipment 6,010 5,293 5,184 5,255 5,469Gross additions to property, plant, andequipment 1,404 841 647 621 1,246Total assets 25,118 21,269 18,598 19,369 17,183Long-term debt 4,752 4,050 3,530 3,740 3,872Shareholders’ equity 11,253 9,807 8,435 7,698 7,069Per common share 17.50 14.95 12.96 11.83 10.96Weighted average shares outstanding-basic 651 654 654 648 646Weighted average shares outstanding-diluted 656 656 656 650 647Significant items affecting the comparability of the financial data shown above are as follows.• Net earnings for 2007 include a gain of $440 million ($286 million after tax, equal to $0.44 per share)related to the exchange of the Company’s interests in certain Asian joint ventures for shares of WilmarInternational Limited, realized securities gains of $357 million ($225 million after tax, equal to $0.34 pershare) related to the Company’s sale of equity securities of Tyson Foods Inc. and Overseas ShipholdingGroup Inc. and a $209 million gain ($132 million after tax, equal to $0.20 per share) related to the sale ofbusinesses.• Net earnings for 2005 include a gain of $159 million ($119 million after tax, equal to $0.18 per share)related to sales of the Company’s interest in Tate & Lyle PLC.• Net earnings for 2004 include a $400 million charge ($252 million after tax, equal to $0.39 per share)related to the settlement of fructose litigation and a $51 million charge ($32 million after tax, equal to$0.05 per share) related to the abandonment and write-down of long-lived assets.19