pobierz - WydziaÅ Nauk Ekonomicznych SGGW w Warszawie
pobierz - WydziaÅ Nauk Ekonomicznych SGGW w Warszawie
pobierz - WydziaÅ Nauk Ekonomicznych SGGW w Warszawie

You also want an ePaper? Increase the reach of your titles
YUMPU automatically turns print PDFs into web optimized ePapers that Google loves.
5/54Zeszyty <strong>Nauk</strong>oweSzko³y G³ównejGospodarstwa Wiejskiegow <strong>Warszawie</strong>Polityki Europejskie, Finanse i Marketingnr 5 /54/ 2011Wydawnictwo <strong>SGGW</strong>Warszawa 2011
ZESZYTY NAUKOWESzkoły Głównej Gospodarstwa Wiejskiegow <strong>Warszawie</strong>SCIENTIFIC JOURNALSWarsaw University of Life Sciences – <strong>SGGW</strong>POLITYKI EUROPEJSKIE,FINANSE i MARKETINGNR 5 (54) 2011EUROPEAN POLICIES,FINANCE AND MARKETINGNO 5 (54) 2011Wydawnictwo <strong>SGGW</strong>Warszawa 2011Warsaw University of Life Sciences – <strong>SGGW</strong> PressWarsaw 2011
RADA PROGRAMOWABogdan Klepacki (<strong>SGGW</strong>) – prof. dr hab., Szkoła Główna Gospodarstwa Wiejskiego w <strong>Warszawie</strong>– PrzewodniczącyMieczysław Adamowicz – prof. dr hab. dr h.c., Szkoła Główna Gospodarstwa Wiejskiego w <strong>Warszawie</strong>– WiceprzewodniczącyMarian Podstawka – prof. dr hab., Szkoła Główna Gospodarstwa Wiejskiego w <strong>Warszawie</strong>Janusz Żmija – prof. dr hab. dr h.c., Uniwersytet Rolniczy w KrakowieAndrzej P. Wiatrak – prof. dr hab., Uniwersytet WarszawskiLubica Bartova – prof., Slovak Agricultural University in Nitra, SłowacjaJulian Briz – prof., Universidad Politecnica de Madrid, HiszpaniaFrancęsco Sotte – prof., Universita Politecnica delle Marche Ancona, WłochyKOMITET REDAKCYJNYMarian Podstawka, prof. dr hab. – Redaktor NaczelnyEugeniusz Pudełkiewicz, prof. <strong>SGGW</strong> dr hab.Janina Sawicka, prof. dr hab.Agnieszka Biernat-Jarka, drMarzena Lemanowicz, drHalina Powęska, drAleksandra Wicka, dr inż. – sekretarzRECENZENCIprof. dr hab. dr h.c. Mieczysław Adamowicz, prof. dr hab. Marian Podstawka, prof. dr hab BogdanKlepacki, prof. dr hab. Janina Sawicka, prof. dr hab. Eugeniusz Pudełkiewicz, dr hab. Wojciech Pizło,dr Anna Rytko, prof. dr hab. Joanna Szwacka-Mokrzycka, dr inż. Aleksandra Wicka, dr JarosławGołębiewski, dr Nina DrejerskaKOREKTA JĘZYKOWADr Nina DrejerskaPROJEKT OKŁADKITomasz TaborREDAKCJA TECHNICZNATomasz RuchniewiczADRES KORESPONDENCYJNYSzkoła Główna Gospodarstwa Wiejskiego w <strong>Warszawie</strong>Wydział <strong>Nauk</strong> <strong>Ekonomicznych</strong>Katedra Polityki Europejskiej, Finansów Publicznych i Marketinguul. Nowoursynowska 166, 02-787 Warszawatel./fax: 22 593 40 77; e-mail: kpam@sggw.plISSN 2081-3430Wydawnictwo <strong>SGGW</strong>ul. Nowoursynowska 166, 02-787 Warszawatel. (22) 593 55 20 (-22; -25 – sprzedaż), fax (22) 593 55 21e-mail: wydawnictwo@sggw.pl, www.wydawnictwosggw.plDruk: Agencja Reklamowo-Wydawnicza A. Grzegorczyk, www.grzeg.com.pl2
SPIS TREŚCIBabiak JerzyMożliwości produkcyjne rolnictwa a sytuacja żywnościowa świataProduction capacities of agriculture and the world food situation ............................. 5Bąk-Filipek Ewa, Tetwejer UrszulaMarketing in the food trade ......................................................................................... 17Gołębiewski JarosławZmiany w otoczeniu jako czynnik kształtujący działania marketingowe przedsiębiorstwagrobiznesuChanges in the environment as a factor affecting agribusiness marketing firms ......... 36Kleinová Katarína, Űrgeová JohanaCountry image and branding of Slovakia .................................................................... 50Kozak SylwesterZmiany struktury kanałów dystrybucji a poprawa warunków konkurencji w sektorzeubezpieczeń w Polsce w latach 2002-2009Changes of distribution channels and improvements of the competition conditionsin the insurance sector in Poland for the period 2002-2009 ........................................ 59Kretter Anton, Kádeková ZdenkaAdvertising and public relations efficiency measurement and control ........................ 71Kubicová Ľubica, Kádeková ZdenkaMarketing strategy of the new product introduction on the market ............................. 78Lušňáková ZuzanaCorporate Social Responsibility as part of Public Relations and firm development ... 91Misztal PiotrDług publiczny i wzrost gospodarczy w krajach członkowskich Unii EuropejskiejPublic debt and economic growth in the European Union countries ........................... 101Pudełkiewicz EugeniuszRefleksje wokół koncepcji marketingu w agrobiznesieReflections around the concept of marketing in agribusiness ....................................... 115Récky Roman, Klimentová Katarína, Dobák DušanComparison of production and economic dependence within the growingof sunflower in the Slovak Republic ............................................................................. 1313
Rizovová Beáta, Gašparíkov Veronika á, Nagyová ĽudmilaPerception of advertisement in Visegrad Four countries ............................................ 138Rovny Patrik, Supekova Sona, Hambalkova MariaComparison of Slovak and Polish foreign agrarian trade ........................................... 149Serenčéš Peter, Gallová ZuzanaInfluence of cash flows from the Common Agricultural Policy on liquidity of Slovaktrading companies in agriculture in the period 2000-2009 ......................................... 157Šimo DušanForeign trade of the Slovak Republic with selected agrarian commodities of animalorigin ............................................................................................................................ 170Strzębicki DariuszSprzedaż produktów rolnych przez InternetSelling of agricultural products via the Internet .......................................................... 176Szabóová MáriaPossibilities of using of the venture capital as an innovative instrument in conditions ofthe Slovak republic in the competence of the National Agency for Development Smalland Medium Enterprises .............................................................................................. 197Tóth MariánImpact of CAP subsidies on profit in agricultural enterprises in Slovakia .................. 2084
5 (54) 2011Jerzy BabiakMożliwości produkcyjne rolnictwaa sytuacja żywnościowa świataProduction capacities of agriculture and the world food situationGłód stanowi obecnie jedno z największych niebezpieczeństw ludzkości. Zjawisko to jestgroźne zarówno w wymiarze politycznym, ekonomicznym jak i humanitarnym. Możliwościprodukcyjne rolnictwa przyjmują wyraźnie dwubiegunowy charakter. W krajach średnio i wysokorozwiniętych rolnictwo jest w stanie nie tylko zaspokoić potrzeby żywnościowe swojej ludności, aletakże wytworzyć ich nadwyżki. Natomiast na pokaźnych obszarach Ziemi (ok. 1 mld mieszkańców)występuje permanentne zjawisko braku żywności. Tą niekorzystną sytuację pogłębia w ostatnichlatach wyraźny wzrost cen produktów żywnościowych. W największym stopniu odczuje tospołeczność żyjąca w krajach biednych, nieustannie zagrożonych problemem głodu.Skala głodu w świecieKwestie głodu i niedożywienia bezspornie są jednymi z najpilniejszych zadań,jakie stoją przed ludzkością. Na skalę problemu wskazują statystki prowadzone przezFood and Agriculture Organization, jedną z agend Organizacji Narodów Zjednoczonychmonitorującej poziom globalnego głodu. Z jej danych wynika, że od schyłku lat 90.ubiegłego stulecia liczba głodujących stale rośnie. Na tę sytuację bez wątpienia ogromywpływ miał kryzys finansowo-gospodarczy z lat 2006-2009, który wywołał lawinowywzrost cen żywności. W jego konsekwencji w 2009 r. liczba osób cierpiących z powodugłodu i niedożywienia przekroczyła 1 mld 1 . W 2010 r. wskaźnik ten uległ zmniejszeniuo 95 mln, jednakże nadal jest wyższy niż przed 40-laty i znacznie wyższy niż w 1996 r.,kiedy na Światowym Szczycie Żywnościowym za cel wyznaczono redukcję liczbygłodujących o połowę do 2015 r. Z tej perspektywy osiągnięcie wyznaczonych założeńwydaje się nierealne w szczególności ze względu na niekorzystny układ czynnikówzarówno naturalnych jak i natury politycznej, gospodarczej czy też społecznej.Wśród głównych a zarazem doraźnych przyczyn obecnego stanu rzeczywymienić należy bez wątpienia drastyczny wzrost cen żywności, który z kolei jestskutkiem kryzysu gospodarczego sprzed kilku lat. Ten ostatni przyczynił się także dowzrostu poziomu niepokoju społecznego wyrażającego się w zamieszkachw szczególności w biednych częściach świata. Niepewna sytuacja polityczna nazasadach sprzężenia zwrotnego wtórnie wpływa na ceny żywności a tym samymwzmacnia odczuwalne skutki problemów ubóstwa i głodu. W perspektywiedługookresowej należy uwzględnić także inne czynniki, w tym wzrost liczby ludności.1 The State of Food Insecurity in the World. Addressing food insecurity in protracted crises, Food andAgriculture Organization of the United Nations, Rome 2010, s. 8.5
Według średniego wariantu szacunków ONZ, w 2050 r. liczba ludności przekroczypoziom 9 mld. Prognozy wskazują także, że zdecydowana większość przewidywanegowzrostu, będzie dotyczyła krajów słabo rozwiniętych. Co więcej szacuje się, że w ciągunajbliższych czterech dekad, przy nieznacznych wahaniach liczby ludności krajówrozwiniętych, w regionach najsłabiej rozwiniętych liczba ta ulegnie podwojeniu 2 .Dychotomia światowej kwestii żywnościowejW odniesieniu do kwestii żywności, świat charakteryzuje się wyraźnądychotomią. Na jednym krańcu znajdują się kraje rozwinięte gospodarczo (np. USA,państwa Unii Europejskiej), w których występuje nadprodukcja żywności będącaefektem m. in. bardzo wysokiej wydajności z 1 ha upraw. Potrzeby żywnościoweludności tych regionów potencjalnie mogłyby być w pełni zaspokojenie. Zjawisko głodu,które w tych państwach również występuje choć w skali marginalnej, nie wynikabowiem z braku zasobów posiadanych czynników wytwórczych i możliwości ich użycia,lecz jest rezultatem dysproporcji w podziale dochodów, co z istoty generuje pewnągrupę ludzi o niezaspokojonych potrzebach żywnościowych. O pełnym zaspokojeniuefektywnych potrzeb żywnościowych w krajach Europy i Stanach Zjednoczonychświadczy fakt, iż obserwuje się tam wręcz zjawisko wyłączania z produkcji części ziemirolniczej 3 . Wprowadzane ograniczenia w produkcji artykułów spożywczych sąmechanizmem kontroli i zarazem stabilizacji cen produktów rolnych. Mechanizm tenjest stosowany m. in. w Unii Europejskiej i Stanach Zjednoczonych w celu ochronyinteresów rolników, a dokładniej dla zapewnienia im opłacalności produkcji. Na drugimnatomiast biegunie znajdują się kraje rozwijające się, posiadające z reguły niekorzystnewarunki naturalne dla wytwórczości rolnej, w których problem głodu i niedożywieniajest zjawiskiem permanentnym.Próby uchwycenia związku między dwoma niezwykle istotnymideterminantami głodu na świecie, tj. skalą produkcji żywności a wzrostem światowejliczby ludności podjął się już kilkaset lat temu Thomas Malthus 4 . U źródeł jego teoriileżał pogląd, iż żaden ustrój polityczny nie może zapewnić powszechnego dobrobytuwyrażającego się chociażby w odpowiednim poziomie pożywienia. Wiąże się to zawszez istniejącym prawdopodobieństwem przeludnienia, a tym samym niedostateczną ilościąśrodków koniecznych do zaspokojenia podstawowych potrzeb ludności ze względu nastałą, ograniczoną podaż ziemi. Podstawą jego twierdzeń było przekonanie, iż populacja2 World Population Prospects: The 2006 Revision, Highlights, United Nations, New York 2007, s. 1.3 Początkowo, do końca lat 80. z uwagi na niską samowystarczalność żywnościową krajów Unii Europejskiej,jednym z głównych celów Wspólnej Polityki Rolnej było podniesienie produktywności rolnictwa m. in.poprzez wprowadzenie nowoczesnych rozwiązań technologicznych, racjonalizację produkcji orazoptymalizację wykorzystania czynników produkcji. Podejmowane działania, w tym inwestycje w postęptechniczny, doprowadziły do wzrostu możliwości produkcyjnych i tym samym zwiększenia skali produkcji.W konsekwencji, w sytuacji relatywnie słabego wzrostu konsumpcji, Unii Europejska znacznie zwiększyłaswoją samowystarczalność żywnościową. Obecnie, wedle jednej z uwag Europejskiego KomitetuEkonomiczno-Społecznego w odniesieniu do wizji WPR po roku 2013, należy zaprzestać zwiększania zawszelką cenę wydajności rolnictwa. Patrz szerzej: D. Stankiewicz, Wspólna Polityka Rolna po 2013, „Infos”,Biuro Analiz Sejmowych, nr 12(82)/2010.4 Thomas Malthus był angielskim ekonomistą i demografem żyjącym na przełomie XVIII i XIX wieku, twórcąteorii przeludnienia, zob. T. R. Malthus, Prawo ludności, tłum. K. Stein, Gebethner i Wolff, Warszawa 1925.6
ośnie w tempie geometrycznym, produkcja żywności zaś w tempie arytmetycznym.Stąd niejako oczywisty wydawał się wniosek, że ludzkość jest wręcz skazana na głód.Twierdzenia Malthusa okazały się jednak mieć błędne założenia. Z danych ONZwynika, że tempo przyrostu ludności jest zmienne, a co więcej w dłuższym okresie ulegaspadkowi. W latach 1950–2000, jak podaje ONZ, średni roczny przyrost naturalnyludności na świecie wynosił 17,8 promila, w sytuacji gdy w latach 2000–2005 już„tylko” 12,4 promila. Według prognoz ONZ w latach 2000-2050 średnioroczne tempowzrostu populacji będzie niższe o 4 punkty, kształtując się na poziomie 8,15 promila 5 .Nie sprawdziły się również pesymistyczne przewidywania dotyczące produkcjiroślinnej. Okazało się, że wraz z wprowadzeniem do rolnictwa m. in. nowych metodprodukcji, gatunków czy też środków ochrony roślin, nastąpił wzrost produkcji zboża atym samym i produkcji rolnej. Niemniej jednak światowy głód jest faktem i dlazrozumienia jego złożoności, istotne jest uchwycenie wielowymiarowości czynnikówdeterminujących zjawisko. W odniesieniu do wzrostu liczby ludności, istota problemutkwi przede wszystkim w nierównomiernym rozłożeniu tego zjawiska. Jak już wcześniejwskazano, najwyższy przyrost naturalny dotyczy obszarów słabo rozwiniętych, naktórych głód i niedożywienie są zjawiskami ciągłymi.Federico Mayor wskazuje, iż ludność Afryki podwaja się co 23 lata, produkcjażywnościowa natomiast co 30 lat. Najbardziej jednak niepokojącym w świetle tychdanych jest fakt, iż w 1960 r. Afryka zaspokajała aż 107% swoich potrzebżywnościowych, w sytuacji gdy w latach 90. wskaźnik ten spadł do 78%. Ze względu nawyniszczenie gleb spowodowane stosowaniem niewłaściwych metod uprawy, presjęefektywności produkcji w rejonach, gdzie żyznych ziem jest niewiele a także ubóstwo nawsi, eksperci przewidują, że w obecnym stuleciu Afryka Południowa może w dziedziniegospodarki żywnościowej uzależnić się od krajów leżących na północ od Zambezi. Takapolityka rolna doprowadziła również do nadmiernego użytkowania zasobównaturalnych, w szczególności lasów, co wtórnie wpływa niekorzystnie m. in. nabezpieczeństwo żywnościowe 6 .W skali ogólnoświatowej stosunek możliwości produkcji żywności dozapotrzebowana zwiększył się z 1,05 w 1962 r. do 1,12 w 1970 r. i 1,18 w r. 1990. Danete wskazują, iż w tym obszarze dokonał się znaczny postęp, który należy tym bardziejpozytywnie ocenić z uwagi na fakt, iż jak już wcześniej wspomniano, w tym czasienastąpił ogromny przyrost demograficzny 7 .Przyjmując za wskaźnik produkcję zbóż na mieszkańca, poczynając od 1950 r.,zauważa się wzrost spożywanej żywności. W skali świata w przypadku zbóżw przeliczeniu na osobę w 1950 r. przeciętnie wynosiło 247 kg, a w r. 1984 wzrosłoo 38% sięgając 342 kg, do r. 1998 uległo zaś spadkowi o 7% plasując się na pułapie319 kg. Choć pamiętać należy, że posługiwanie się tym wskaźnikiem ma ograniczoneznacznie, to można jednak zauważyć prawidłowość, iż łatwiej wyeliminowaćniedożywienie w krajach, w których miernik ten wzrasta 8 .5 W. Gadomski, Klęska głodu to wymysł, „Gazeta Wyborcza” z dnia 13.11.2009.6 F. Mayor, J. Bindém, Przyszłość świata, Fundacja Studiów i Badań Edukacyjnych, Warszawa 2001, s. 416.7 Ibidem, s. 233.8 Ibidem, s. 154.7
Kluczowa dla zrozumienia możliwości produkcyjnych rolnictwa jest relacjamiędzy wzrostem wydajności a powierzchnią upraw 9 . Szybki wzrost wydajnościw rolnictwie, w szczególności w krajach wysoko rozminiętych, przyczynił się doobniżenia kosztów produkcji a tym samym spadku cen żywności. Niemniej jednakw ciągu ostatniej dekady obserwuje się spadek światowego wzrostu produktywnościmierzonego ilością zboża wyprodukowanego z 1 ha ziemi. W porównaniu do lat 80. i 90.XX w. spadek wydajności odnotowano w przypadku ryżu i pszenicy, natomiastw uprawie kukurydzy i soi zauważono stagnację. Niższa wydajność jestrekompensowana zwiększeniem produkcji przy wykorzystaniu większego areału ziemi,co jednak wiąże się ze wzrostem kosztów. Te zaś ostatecznie mają swojeodzwierciedlenie w cenach żywności. Niepokojące obniżenie wydajności w dłuższejperspektywie będzie wymuszało włączanie do produkcji rolnej nowych gruntów.Niestety część z nich będzie mniej wydajna ze względu na brak systemównawadniających suche obszary, słabą infrastrukturę lub też mniejszą żyzność gleb.W tym kontekście poważnym problemem jest ograniczony charakter gruntów rolnych.Obecnie obserwuje się niekorzystne zjawisko zagospodarowywania urodzajnych ziem nacele nierolnicze na obszarach silnie zurbanizowanych. Takie grunty zwyklebezpowrotnie tracą swój rolniczy charakter i nie ma możliwości ponownegoprowadzenia na nich upraw. Z uwagi na geograficzne ograniczenia wynikającez warunków atmosferycznych niezbędnych do w produkcji poszczególnych roślinnychartykułów żywnościowych ważny, z punktu widzenia ich cen, jest również wybórrolników, co do rodzaju produkowanych roślin. Te zaś często podyktowane sączynnikami ekonomicznymi, tj. kosztami produkcji i możliwymi zyskami. Ponadto silnywpływ zarówno na wydajność ziemi, jak i jakość plonów mają obserwowane zmianyklimatyczne oraz wynikająca z nich m. in. degradacja gleb. Czynniki te w połączeniu zewzrostem popytu na produkty żywnościowe mogą przyczynić się do zmianw światowym handlu. Pomimo, iż rynek żywnościowy nadal jest stosunkowohermetyczny, tzn. większość wyprodukowanych surowców, zużywana jest lokalnie,a tylko niewielka ich część jest eksportowana, to jednak obserwuje się na nim pewnezmiany. Przykładowo wzrost zapotrzebowania na paszę dla zwierząt zmusił Chiny doimportu kukurydzy i soi. Takie przeobrażenia na rynkach światowych mogą zaśdodatkowo przyczynić się do wzrostu cen żywności 10 .Kryzys gospodarczy z lat 2006-2009 oraz globalna recesja dodatkowodoprowadziły do przeobrażeń ekonomicznych oraz zmian w zakresie głównych działańkrajów, w których zjawisko głodu jest skumulowane:• nastąpił spadek poziomu światowego handlu i zmiany w jego obszarze, naczym ucierpieli eksporterzy żywności na całym świecie, to z kolei pociągnęłoza sobą spadek krajowych dochodów, który w państwach rozwijających sięczęsto ściśle powiązany jest z eksportem,9 Dla przykładu wydajność ziemi mierzona wartością produkcji globalnej PKB w stosunku do powierzchnigospodarstw rolnych [ha] w Szwecji wynosi 1 312 [USD/ha], w Danii 1 401, w Wielkiej Brytanii 1 413,w Niemczech 1 532, we Francji 1 673, w Austrii 1 777, w Belgii 2 813, w Portugalii 3 407, w Grecji 4 126,w Holandii zaś aż 7 224. Patrz szerzej: R. Michałek, K. Grotkiewicz, A. Peszek, Wydajność ziemi i pracyw wybranych krajach Unii Europejskiej, „Inżynieria Rolnicza”, 1(110)/2009, s. 203.10 T. Helbling, S. Roache, Rising Prices on the Menu, “Finance & Development”, vol. 48. no. 1, March 2011,s. 25-26.8
• spadł poziom zagranicznych inwestycji bezpośrednich i sam portfel inwestycji,co przyczyniło się do ograniczenia i tak niewystarczających funduszyi nakładów na technologię w krajach rozwijających się,• nastąpił nagły wzrost bezrobocia, w szczególności wśród najbiedniejszych,• spadek w zakresie przesyłek pieniężnych prowadzi do zmniejszeniaprzychodów krajów rozwijających się, co z kolei utrudnia realizację działańzwiązanych z rosnącymi cenami żywności i recesją,• nastąpił rozłam między potrzebami a pomocą zagraniczną-choć niektóre rządyzwiększyły poziom pomocy, środki te nadal są niewystarczające w obliczukryzysu 11 .Należy zatem spodziewać się, iż w najbliższej perspektywie kryzys ekonomiczny będziemiał negatywny wpływ na rozwiązywanie problemów żywnościowych świata. TheInternational Food Policy Research Institute ocenia, że recesja a tym samym redukcjainwestycji w rolnictwo spowoduje, iż do 2020 roku kolejnych 16 mln dzieci znajdzie sięstrefie zagrożenia głodem 12 .Dystrybucja żywnościWraz z postępującą integracją gospodarki w skali światowej, zmianie ulegaoblicze głodu. Uprzednio ściśle powiązany był z niskim poziomem zbiorów i pojawiałsię w określonych regionach świata. Obecnie duży wpływ mają również czynnikiekonomiczne, niska produktywność rolnictwa w krajach słabo rozwiniętych gospodarczoczy też zbyt niskie dochody. Głód dotyczy zarówno ludności posiadającej ziemię niebędącej jednak w stanie wyprodukować na niej dostatecznej ilości żywności, jak równieżbiednych mieszkańców miast, których na pożywienie nie stać 13 . Niemniej jednak należyzauważyć, iż problem żywności nie tyle dotyczy jej zasobów, co przede wszystkimkwestii nierównomiernej dystrybucji. Takie podejście znalazło odzwierciedleniew międzynarodowych dokumentach.Prawo do żywności usankcjonowane jest na poziomie jurysdykcjimiędzynarodowej. Odnosi się do niego art. 25 Powszechnej Deklaracji PrawCzłowieka 14 , który głosi: „Każdy człowiek ma prawo do stopy życiowej zapewniającejzdrowie i dobrobyt jego i jego rodziny, włączając w to wyżywienie, odzież, mieszkanie,opiekę lekarską i konieczne świadczenia socjalne, oraz prawo do ubezpieczenia nawypadek bezrobocia, choroby, niezdolności do pracy, wdowieństwa, starości lub utratyśrodków do życia w inny sposób od niego niezależny 15 ”. Niejako uzupełnieniem11 K. Grebmer, B. Nestorova, A. Quisumbing, R. Fertziger, H. Fritschel, R. Pandya- Lorch, Y. Yohannes,Global Hunger Index. The Challenge of Hunger: Focus on Financial Crisis and Gender Inequality, Bonn,Washington, Dublin 2009, s. 17.12 Ibidem, s. 17.13 L. R. Brown, Wyżywić dziewięć miliardów [w:] L. R. Brown, Ch. Flavin, H. F. Frencz, Raport o stanieświata. U progu nowego tysiąclecia, tłum. W. Bolimowska, J. Gołębiowski, Książka i Wiedza, Warszawa2000, s. 154.14Powszechną Deklarację Praw Człowieka przyjęto w Paryżu 10 grudnia 1948 r. Był to dokumentbezprecedensowy, ustanawiający fundamentalne prawa człowieka przynależne każdemu z racji jegoczłowieczeństwa.15 Powszechna Deklaracja Praw Człowieka, Paryż 1948. Deklaracja nie jest dokumentem prawnie wiążącym,jednakże została przyjęta przez wszystkie państwa członkowskie ONZ.9
Deklaracji w zakresie praw politycznych, obywatelskich, ekonomicznych, społecznychoraz kulturalnych stały się dwa dokumenty: Międzynarodowy Pakt PrawGospodarczych, Społecznych i Kulturalnych 16 i Międzynarodowy Pakt PrawObywatelskich i Politycznych przyjęte w 1966 r. 17 Prawo człowieka do pożywieniawprost i z całą mocą zostało sformułowane w pierwszym z Paków przyjmując postać art.11, gdzie punkt 1 wskazuje, że „Państwa Strony niniejszego Paktu uznają prawokażdego do odpowiedniego poziomu życia dla niego samego i jego rodziny, włączającw to wyżywienie…” 18 . Punkt drugi zaś tegoż art. jeszcze dobitniej odnosi się do kwestiigłodu wskazując, że „Państwa Strony niniejszego Paktu, uznając podstawowe prawokażdego do wolności od głodu, podejmą, indywidualnie i w drodze współpracymiędzynarodowej, niezbędne kroki… 19 ” Kwestie znaczenia odpowiedniej dystrybucjiżywności zostały podkreślone w dalszej części dokumentu, w którym zwrócono uwagęna konieczność wykorzystywania wiedzy technicznej i naukowej w celu ulepszeniaprodukcji, konserwacji a także dystrybucji żywności. Wskazano w nim również napotrzebę przeprowadzania niezbędnych reform w rolnictwie, aby tym samymefektywniej wykorzystywać zasoby naturalne. Poruszono także kwestię zapewnieniasprawiedliwych zasad podziału światowych zasobów żywności w zależności od potrzeb,przy jednoczesnym uwzględnieniu problemów zarówno krajów importujących jakeksportujących żywność.Szczegółowe wytyczne do art. 11 Paktu, czyli w zakresie prawa doodpowiedniej żywności zostały zawarte w Komentarzu Ogólnym nr 12 20 (ang. GeneralComment 12) 21 . Uznano, iż jest to jedno z praw przynależnych człowiekowi jako istocieludzkiej i jego przestrzeganie jest elementem niezbędnym dla realizacji innych,zawartych w Międzynarodowej Karcie Praw Człowieka. W jego punkcie 5 podkreślononiezwykle istotną kwestię, iż „zasadniczo korzenie problemu głodu i niedożywienia nietkwią w braku żywności lecz w braku dostępu do niej, m. in. z powodu ubóstwa w dużejczęści świata” 22 . Jest to o tyle istotne, iż wprost wskazano, że rozwiązań kwestii głodunie tyle należy szukać w intensyfikacji produkcji żywności, a skupić się raczej trzeba najej racjonalnej dystrybucji. Należy przy tym zaznaczyć, iż taka konstatacja nie dewaluujepotrzeby zwiększania nakładów przeznaczonych na rolnictwo, w szczegółowościw krajach rozwijających się, gdyż samowystarczalność żywieniowa biednych regionówświata jest czynnikiem niezbędnym w walce z głodem i niedożywieniem. Wspomnianydokument stanowi także dla art. 11 Paktu normatywną wykładnię. W myśl jegopostanowień, „prawo do odpowiedniej żywności realizowane jest wówczas, gdy każdymężczyzna, kobieta i dziecko, indywidualnie lub wspólnie, ma zapewnioną zarówno16 Międzynarodowy Pakt Praw Gospodarczych, Społecznych i Kulturalnych otwarty do podpisu w NowymJorku dnia 19 grudnia 1966 r. (Dz. U. 1977 nr 38 poz. 169).17Oba dokumenty weszły w życie 1976 r. Wraz z Powszechną Deklaracją Praw Człowieka tworząMiędzynarodową Kartę Praw Człowieka.18 Międzynarodowy Pakt Praw Gospodarczych, Społecznych i Kulturalnych, op. cit.19 Ibidem.20 Prace nad nim zostały wszczęte na wniosek państw członkowskich zebranych na Światowym SzczycieŻywnościowym w 1996 r. celem dokładniejszego określenia praw człowieka do żywności zawartych w art. 11Paktu.21 General Comment 12, The right to adequate food, Committee on Economic, Social and Cultural Rights,United Nations, 12 may 1999, (E/C.12/1999/5).22 Ibidem, pkt 5.10
fizyczną jak i ekonomiczną dostępność do odpowiedniej żywności lub też środkiumożliwiające jej nabycie” 23 . Wskazano zarazem, że nie powinno ono byćinterpretowane w wąskim sensie, tzn. ze wskazaniem na określoną ilość kalorii, białkai innych składników odżywczych. Zaznaczono, że prawo to musi być realizowanestopniowo przy zastrzeżeniu, że państwa zobowiązane są do podjęcia wszelkichmożliwych środków w celu jego urzeczywistniania. Samo pojęcie odpowiedniości, jakzauważono, jest w znacznej mierze zdeterminowane obowiązującymi w danym regionieczynnikami społecznymi, ekonomicznymi, kulturowymi, klimatycznymi, czy teżekologicznymi. Dostępność żywności definiowana jest w kategoriach odpowiedniej jejilości i jakości wystarczającej do zaspokojenia potrzeb żywieniowych człowiekaz zastrzeżeniem, że musi być wolna od szkodliwych substancji, akceptowalna w danejkulturze i dostępna w sposób ciągły. Potrzeby żywnościowe określane są zaś jako dietazawierająca różnorodne składniki odżywcze niezbędne do zapewnienia fizycznego orazpsychicznego wzrostu, rozwoju i utrzymania aktywności fizycznej, przy uwzględnieniupotrzeb fizjologicznych organizmu na wszystkich etapach cyklu życia, płci orazzawodu 24 .Należy podkreślić, iż zarówno Międzynarodowy Pakt Praw Gospodarczych,Społecznych i Kulturalnych jak i Międzynarodowy Pakt Praw Obywatelskichi Politycznych stanowią wiążące, prawne instrumenty ochrony praw człowieka.Większość państw jest stronami obu aktów, stąd też istnieje choćby prawna możliwośćrzeczywistej kontroli przestrzegania praw człowieka.Problem dystrybucji żywności został poruszony także na Światowym SzczycieŻywnościowym (ang. World Food Summit: five years later) 25 , który odbył się w 2002 r.Jednym z jego celów było zbadanie postępów, jakie zostały poczynione w walcez głodem od poprzedniego Szczytu z 1996 r. 26 Podjęto się także próby rozważeniamożliwości zmian strategii zmierzających do wzmożenia działań i zwiększeniaefektów 27 . Rezultatem pracy zgromadzonych na Szczycie przedstawicieli byłaDeklaracja ze Światowego Szczytu Żywnościowego: pięć lat później (ang. Declaration ofthe World Food Summit: five years later), w której ponowiono zobowiązania poczynionew 1996 r. odnośnie do zmniejszenia liczby głodujących do 2015 r. 28 Zwrócono ponadtouwagę, iż strategia skutecznej walki z głodem i ubóstwem oraz zapewnienia23 Ibidem, pkt 6.24 Ibidem.25 Został on zorganizowany w dniach 10-13 czerwca 2002 r. i podobnie jak poprzedni miał miejscew rzymskiej siedzibie FAO.26 Dyrektor Generalny FAO Jacques Diouf podkreślił, iż celem szczytu miało być pobudzanie zarówno wolipolitycznej, jak i przeznaczanych na walkę z głodem środków finansowych. Zaznaczył, że eliminacja głodujest pierwszym krokiem wielokrotnie deklarowanej przez społeczność międzynarodową walki z ubóstwem.Dane z tamtego okresu wskazywały jednak, że liczba niedożywionych spadała przeciętnie w tempie zaledwie6 mln rocznie, czyli znacznie poniżej rocznego celu 22 mln, koniecznych do osiągnięcia celu Szczytu z roku1996. Pomimo poprawy sytuacji w wielu krajach i społeczeństwach, zauważono potrzebę podejmowaniadalszych wysiłków, dlatego też przywódcy poszczególnych państw zostali poproszeni o określenia środkówniezbędnych do walki z głodem oraz możliwych sposobów przyspieszenia tego procesu.27 http://www.un.org/en/development/devagenda/food.shtml, z dnia 30.03.2011.28 Wezwano rządy, organizacje międzynarodowe, społeczeństwa obywatelskiego oraz sektora prywatnego dowspółpracy w ramach Międzynarodowego Sojuszu do Walki z Głodem (International Alliance AgainstHunger). Pieczę nad realizacją postępów w osiąganiu założeń WFS powierzono Komitetowi ds. ŚwiatowegoBezpieczeństwa Żywnościowego (ang. Committee on World Food Security, CFS).11
ezpieczeństwa żywnościowego powinna obejmować środki przeznaczone na rolnictwo,produkcję i dystrybucję żywności. Zauważono także, że większość głodującychzamieszkuje tereny wiejskie, dlatego też podkreślono wagę stałego wzrostu produkcjirolnej 29 .Problem bezpieczeństwa żywnościowego w kontekście prognoz związanychz przyrostem liczby ludności, dostrzeżono także na poziomie Unii Europejskiej. Napoczątku 2010 r. Wspólnota wystosowała do państw członkowskich zaleceniaw zakresie badań naukowych związanych m. in. z bezpieczeństwem żywnościowym, czyteż łagodzeniem skutków zmian klimatycznych i ich wpływu na rolnictwo. Podkreślonow nim konieczność podjęcia w tych obszarach działań, w szczególności iż „oczekuje się,że światowe zapotrzebowanie na żywność zwiększy się o 50% do 2030 r., i podwoi do2050 r. W tym samym czasie przewiduje się także znaczny wzrost zapotrzebowania nabiomasę do celów niespożywczych” 30 .Konsekwencje wzrostu cen żywnościWzrost cen żywności jest wynikiem z jednej strony czynników przejściowych,takich jak niekorzystne zjawiska atmosferyczne, z drugiej jednak wynika z głębokich,strukturalnych zmian we wzorach światowej konsumpcji, która skutkujenieodwracalnym jak się wydaje wzrostem popytu na żywność. Wśród zjawiskatmosferycznych należy wymienić m. in. powodzie w Australii, Pakistanie i niektórychregionach Indii oraz susze w Chinach, Argentynie oraz Europie Wschodniej. Z powoduwystępujących w 2010 r. suszy i pożarów odnotowano w Rosji, na Ukrainiei w Kazachstanie znaczny spadek plonów pszenicy, w wyniku czego ocenia się, żeświatowe zbiory pszenicy w 2010 r. były o 5% niższe. Następnie gorące i mokre latoprzyczyniło się do znacznie mniejszych niż przypuszczano plonów kukurydzy w USA.Ostatecznie jesienią 2010 r. jeden z najsilniejszych od 50 lat epizodów La Niña 31zniszczył w Azji zbiory, w szczególności ryżu. W konsekwencji ucierpiały nie tylkorynki lokalne, ale także światowe, na których ceny żywności wzrosły 32 . Chociażw niekorzystnej pogodzie oraz niskim poziomie zapasów upatruje się powodów tegoskoku to jednak, ostatni Raport International Monetary Fund sugeruje, iż głównychprzyczyn długoterminowych trendów wzrostu cen należy upatrywać w zwyżcedochodów oraz rosnącym zapotrzebowaniu na białko zwierzęce w krajach rozwijającychsię. Pośredni, aczkolwiek znaczący wpływ mają także rosnące ceny ropy naftowej czygazu ziemnego, które wykorzystywane są na wszystkich etapach produkcji żywności.Podkreślają również, iż w zasadzie od przełomu XIX i XX w., poza wyraźnym spadkiemcen żywności na przełomie 2008/2009 r., obserwuje się systematyczny ich wzrost, stądteż należy na to spojrzeć w kategoriach stałego trendu, który dodatkowo wzmacniany29 http://www.fao.org/DOCREP/MEETING/005/Y7106E/Y7106E09.htm#TopOfPage, z dnia 30.03.2011.30 Zalecenie Komisji z dnia 28 kwietnia 2010 r. w sprawie inicjatywy w zakresie wspólnego planowania badańnaukowych „Rolnictwo, bezpieczeństwo żywnościowe i zmiana klimatu” (Dz. U. L 111, 04/05/2010).31 La Niña to globalne anomalia pogodowe, których efektem są ekstremalne zjawiska pogodowe od suszy popowodzie, śnieżyce i mrozy, występujące w różnych częściach świata. Pod koniec 2010 r. osiągnęła średniąaktywność. Niepokojącym jest, iż wcześniej zarówno epizody El Niño, stanowiącego przeciwieństwo tejpierwszej, jak i La Niña występowały ze średnią częstotliwością co 10 lat. Obecnie okres ten ulega skróceniu.32 T. Helbling, S. Roache, Rising Prices on the Menu…, op. cit., s. 26.12
jest innymi czynnikami. Jak podaje FAO wzrost cen żywności wywołany kryzysemekonomicznym, w 2007 r. sięgnął poziomu prawie 40% 33 , co wiąże się z rosnącąfrustracją ludności krajów najbiedniejszych 34 . Niemniej jednak rozpatrując podwyżkicen żywności nie można nie docenić warunków pogodowych zakłócających cykle jejdostawy 35 .Należy podkreślić, że globalna reakcja cenowa żywności nie jest spowodowanajedynie brakami w dostawach w krótkim okresie, ale zależy także od innych czynników.Takim elementem było nałożenie w Rosji i na Ukrainie ograniczeń w eksporcie zboża zewzględu na niskie zbiory. Działania takie przyczyniają się do utrzymania na niskimpoziomie cen na rynku krajowym, prowadząc tym samym do destabilizacji cen narynkach światowych. Ponadto w ciągu ostatniej dekady obserwuje się znaczny spadekzapasów żywności w porównaniu do poziomu konsumpcji. W 2008 r. miał miejsceostatni szczyt cenowy żywności, który był porównywalny do rekordowegozanotowanego na przełomie lat 1973/1974. Zbiory w drugiej połowie 2008 r. i napoczątku 2009 r. tylko w niewielkim stopniu były w stanie uzupełnić światowe zapasy.Stąd też gdy w 2010 r. ponownie dostawy żywności zostały zagrożone, sytuacja taznalazła odzwierciedlenie na światowych rynkach. Skutki wstrząsów podażowychwydają się być jednak krótkotrwałe i produkcja zbóż zazwyczaj wraca do trendustosunkowo szybko wraz z normalizacją pogody. Wskazuje się także, że okresyniedoboru zbóż i duże skoki cenowe są zwykle poprzedzane długimi okresamiwzględnej stabilizacji 36 .Thomas Helbling i Shaun Roache wskazują na jeszcze jeden element ważnyprzy ocenie obecnych cen żywności. Podkreślają, że po uwzględnieniu inflacji, cenybieżące są znacznie niższe niż te zanotowane w czasie Wielkiego Kryzysu z lat 30. XXw., stąd też prawdopodobnie jeszcze wzrosną. Mimo, iż przewidują wzrost cen, tojednak podkreślają także, że w przypadku braku złej pogody, można oczekiwaćstabilizacji cenowej kiedy zacznie się sezon na zboże na półkuli północnej 37 .Poczynając od 2006 r. czyli wraz z początkiem kryzysu, ceny żywności zaczęłyrosnąć by w ciągu dwóch lat wzrosnąć o ok. 41%. W 2009 r. realne ceny żywnościobniżyły się, jednakże już roku później ponownie przyjęły tendencję wzrostową, któratrwa i jest obecnie bardzo wyraźna.Brian Wright z Uniwersytetu Kalifornijskiego podjął się próby wyjaśnieniakwestii wzrostu i szybkiej zmienności cen zbóż. Uważa, że częściowo odpowiedzialnajest za to polityka rządów zachęcająca do stosowania biopaliw. Wskazuje, że 1/3wyprodukowanych w USA zbóż jest obecnie przeznaczana na biopaliwa. W skaliglobalnej zaś, w 2010 r. produkcja etanolu z kukurydzy pochłonęła 15% jej światowychzbiorów. Niezwykle niepokojącym jest fakt, iż wedle FAO w krajach, w których ceny33 J. Blas, J. Wiggins, tłum. A.G., Żywność to sprawa polityczna, „Gazeta prawna”, marzec 2008, nr 62.34 Eksperci Banku Światowego alarmują, że 33 kraje stoją na skraju destabilizacji wywołanej rosnącymicenami żywności. W Haiti – najbiedniejszym państwie Ameryki Środkowej, ok. 66 % ludności żyje za 1 dolaradziennie. W kwietniu 2008 roku w wyniku wywołanych wzrostem cen żywności zamieszek, zginęło tam, conajmniej siedem osób, patrz szerzej: M Szymaniak, Czy światu grożą wojny o żywność, Rzeczpospolita, maj2008, artykuł dostępny także na stronie: http://www.rp.pl, z dnia 13.11.2009.35 T. Helbling, S. Roache, Rising Prices on the Menu…, op. cit., s. 24-25.36 Ibidem, s. 26-27.37 Ibidem, s. 25.13
zbóż drastyczne wzrosły z dużym prawdopodobieństwem zwiększy się również liczbaludzi zagrożonych ryzykiem niedożywienia 38 . Dodatkowo perspektywa niskich plonówspowodowanych brakiem opadów np. w Republice Południowej Afryki prowadzi dowzrostu cen paszy dla zwierząt na lokalnym rynku 39 .Wykres 1. Roczny rzeczywisty wskaźnik cen żywności (2002-2004=100)220,0200,0180,0160,0164,5205,3158,1140,0120,0100,080,060,0105,5102,5 100,1116,1114,5101,6 98,1 105,31990199119921993199419951996109,7107,6 99,0 97,7105,196,693,1 92,919971998199920002001Lata116,5139,42002200320042005200620072008134,9200920102011Źródło: http://www.fao.org/worldfoodsituation/wfs-home/foodpricesindex/en/, z dnia29.03.2011.Wzrost cen na światowych rynkach wywołuje dwojakiego rodzaju skutki.Bezpośrednie, określane również jako „pierwszej rundy” przejawiają się we wzrościecen żywności na rynkach krajowych. Takie zjawisko można było zaobserwować w wielupaństwach na początku 2011 r. i podobnie jak na przełomie lat 2007/2008 sytuacja taw większym stopniu dotknęła kraje rozwijające się, ponieważ w państwachrozwiniętych, udział produktów żywnościowych w koszyku konsumpcyjnym jestrelatywnie większy. W tych regionach rzeczywisty koszt żywności stanowi też większączęść ceny produktów spożywczych. W krajach bogatych ceny te są w dużej mierzeuzupełnione o koszty pracy, transportu, czy też marketingu. Jeżeli ceny żywności naświatowym rynku zaczynają się stabilizować i powoli słabną efekty „pierwszej rundy”,występują wówczas skutki pośrednie pierwotnego ich wzrostu, zwane także „drugąrundą”. Przejawiają się one w sztucznym kreowaniu inflacji, która wynika z oczekiwańprzyszłego wzrostu cen. Prawdopodobieństwo jej wystąpienia w nieodległej przyszłościwpływa na oczekiwania pracowników, którzy domagają się wzrostu wynagrodzeń, co38 Dla przykładu w Somali ceny zbóż od października 2010 r. wzrosły o 141%, w Kenii zaś od stycznia 2011 r.o 21%.39 “Bridges Weekly Trade News Digest”, vol. 15, no. 8, 9 March 2011, s. 7-8.14
z kolei pośrednio prowadzi do wzrostu inflacji bazowej. Długoletnie obserwacjewskazują, iż ryzyko niekorzystnego wpływu wzrostu cen żywności na inflację bazowąjest znacznie wyższe w krajach rozwijających się, charakteryzujących się słabągospodarką i zarazem relatywnie niskie dla gospodarek stabilnych. Sytuacja taka jestwarunkowana w dwojaki sposób. Po pierwsze, o czym już wspominano, w biednychregionach wydatki na żywność stanowią większą część budżetów domowychw porównaniu do państw rozwiniętych. Ponadto znacznie wyższe są w nich kosztysurowców spożywczych. Po drugie polityka monetarna państw rozwijających się jestmniej wiarygodna 40 .PodsumowanieW konkluzji można stwierdzić, że w odpowiedzi na wzrost cen żywności,zwiększy się jej podaż. Należy jednak wziąć pod uwagę, iż taka zmiana jest możliwa doprzeprowadzenia w okresie wielu lat, nie zaś miesięcy. Koniecznym jest także zwróceniewiększej uwagi na problem niedoboru istotnych czynników produkcji żywności takichjak ziemia, woda czy energia w krajach, gdzie zjawisko głodu występuje z największąintensywnością. Rozwiązań rekompensujących te braki upatruje się w rozwojutechnologii oraz zwiększeniu wydajności. Niemniej jednak politycy, w szczególnościkrajów rozwijających się, muszą być przygotowani na konfrontację z cenami żywności,które są nie tylko wyższe, ale i mniej stabilne.Literatura1. Blas J., Wiggins J., tłum. A.G., Żywność to sprawa polityczna, „Gazetaprawna”, marzec 2008, nr 62.2. “Bridges Weekly Trade News Digest”, vol. 15, no. 8, 9 March 2011.3. Brown L. R., Wyżywić dziewięć miliardów [w:] L. R. Brown, Ch. Flavin,H.F. Frencz, Raport o stanie świata. U progu nowego tysiąclecia, tłum.W. Bolimowska, J. Gołębiowski, Książka i Wiedza, Warszawa 2000.4. Gadomski W., Klęska głodu to wymysł, „Gazeta Wyborcza” z dnia 13.11.2009.5. General Comment 12, The right to adequate food, Committee on Economic,Social and Cultural Rights, United Nations, 12 may 1999, (E/C.12/1999/5).6. Grebmer K., Nestorova B., Quisumbing A., Fertziger R., Fritschel H., Pandya-Lorch R., Yohannes Y., Global Hunger Index. The Challenge of Hunger: Focuson Financial Crisis and Gender Inequality, Bonn, Washington, Dublin 2009.7. Helbling T., Roache S., Rising Prices on the Menu, “Finance & Development”,vol. 48. no. 1, March 2011.8. Malthus T. R., Prawo ludności, tłum. K. Stein, Gebethner i Wolff, Warszawa1925.9. Mayor F., Bindém J., Przyszłość świata, Fundacja Studiów i BadańEdukacyjnych, Warszawa 2001.10. Michałek R., Grotkiewicz K., Peszek A., Wydajność ziemi i pracy w wybranychkrajach Unii Europejskiej, „Inżynieria Rolnicza”, 1(110)/2009.40 T. Helbling, S. Roache, Rising Prices on the Menu…, op. cit., s. 27.15
11. Międzynarodowy Pakt Praw Gospodarczych, Społecznych i Kulturalnychotwarty do podpisu w Nowym Jorku dnia 19 grudnia 1966 r. (Dz. U. 1977 nr 38poz. 169).12. Powszechna Deklaracja Praw Człowieka, Paryż 1948.13. Stankiewicz D., Wspólna Polityka Rolna po 2013, „Infos”, Biuro AnalizSejmowych, nr 12(82)/2010.14. Szymaniak M, Czy światu grożą wojny o żywność, Rzeczpospolita, maj 2008.15. The State of Food Insecurity in the World. Addressing food insecurity inprotracted crises, Food and Agriculture Organization of the United Nations,Rome 2010.16. World Population Prospects: The 2006 Revision, Highlights, United Nations,New York 2007.17. Zalecenie Komisji z dnia 28 kwietnia 2010 r. w sprawie inicjatywy w zakresiewspólnego planowania badań naukowych „Rolnictwo, bezpieczeństwożywnościowe i zmiana klimatu” (Dz. U. L 111, 04/05/2010).18. http://www.fao.org, z dnia 29.03.2011.19. http://www.un.org, z dnia 30.03.2011.SummaryStarvation is contemporary one of the largest danger for humankind. It is dangerous fromthe political, economic, as well as humanitarian point of view. Agriculture in medium and highlydeveloped countries is able to provide enough food but also produces food surpluses. However,there is a considerable phenomenon of lack of food on a large part of the world, which concernsabout one billion people. This disadvantageous situation has deteriorated recently because ofsignificant increase in food prices. Inhabitants of poor countries, continually endangered withstarvation, will suffer mostly from this tendency.Informacje o autorze:Prof. nadzw. Uniwersytetu im. A. Mickiewicza w PoznaniuZakład Polityki Ekonomicznej i SpołecznejWydział <strong>Nauk</strong> Politycznych i Dziennikarstwaul. Umultowska 89a, 61-614 PoznańE-mail: jerzy.babiak@amu.edu.pl16
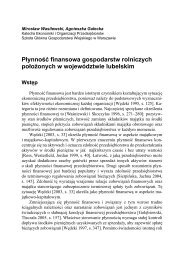
5 (54) 2011Ewa Bąk-Filipek, Urszula TetwejerMarketing in the food tradeIntroductionTrade and services fulfills an important role in the development of nationaleconomy in Poland. The role of the section of the economy shows two macroeconomicindicators, namely the participation of the section in GDP and the share of the number ofemployees in a division in the number of employed in total.Trade has a significant share in both GDP and employment. The contribution ofthis section in the GDP does not change significantly from year to year and is about17%. However, you may notice a dynamic increase in the retail sales and wholesale,where it was recorded in 10 years increased by 150%. Also changes significantly thestructure of turnover. Specific growth (350%) during the 5-year experiencedsupermarkets, where the number increased three times.In marketing, especially large role is played by trade. Direct contact with theultimate consumer, trade, gives a chance for widespread use of marketing methods.Gives the greatest possibilities in this regard, trade consumer goods, among which thelargest share food.In trade buyers receive services that are the result of adaptation of the marketoffer products to the needs of buyers in terms of time, place and form. Commerce isresponsible for ensuring compliance of their market offering with the needs of buyerscarry out its basic functions.Aim of this paper is to show the role of marketing in the sale of food in the formof more or less processed. For this purpose, used a descriptive analysis method. Theanalysis included data from sources of official statistics and data and information fromthe literature. Used data from the most recent surveys, ie for the year 2009.1. Trade in PolandThe most common form of retail sales in Poland, is selling in stores. At the endof 2009 the estimated number of stores in Poland amounted to 371 839 and was lowerthan in the previous year by 3.6%. Area sales increased by 1.5%, mainly due toincreased surface area of 100 stores and more.17
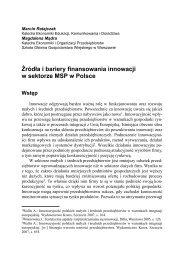
Figure 1. Structure of sales area stores in Poland in 2009Source: own analysis based on "The Internal Market in 2009", GUS, Warsaw 2010. p.37.Despite the economic slowdown there has been a decline in the number ofstores only in the category of micro enterprises owned stores, which operates ninepersons or less (4.9%). The increase in the number of stores (2%) occurred among thecompanies employing more than 9 persons. The largest increase in the number of storestook place in the category of supermarkets. Over the years 2005 2009 the numberincreased rapidly and systematically, which is related, inter alia, the development ofcommercial networks. At the end of 2009, operated 4,041 stores, such as 11.4% morethan in 2008. The largest increase in the number of stores in this category was noted inthe voivodeship: Masovian, Selassie and Wielkopolskie. In terms of the number ofhypermarket stores increased only by 6.9%, while last year increased by 16.9%. Most ofthe new supermarket was set up in voivodeship: Silesia and Malopolska. In the Kujawy-Pomeranian, Podlaskie and Lubelskie their number remained at the level of 2008.18
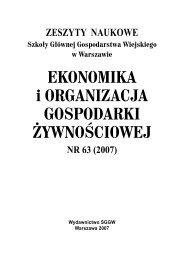
45004000350030002500200015001000500040413506362930032716462 374 431 410 372 396 463 495312 31295 91 76 60 632005 2006 2007 2008 2009Departament stores Trade stores Supermarkets HypermarketsFigure 2. Number of stores by selected organizational forms in the years 2005-2009Source: own analysis based on "The Internal Market in 2009", GUS, Warsaw 2010. p. 37.In 2009, retail sales in constant prices realized by commercial andnoncommercial company was 1.7% higher than last year. Higher than the averageincrease in sales reported for non-food consumer goods (2.6%). Sales of alcoholicbeverages and tobacco increased in comparison with the previous year by 0.1%, while inthe group of food and soft drinks sales declined by 0.2%.Table 1. Retail sales in 2007-2009, million zł (current prices)Description 2007 2008 2009Total 515 654,6 564 665,0 582 774,7Food and soft drinks 151 150,3 161 795,2 168 489,3Alcoholic beverages and 48 552,0 52 290,6 56 564,5tobacco productsNon-food goods 315 952,4 350 579,1 357 720,9Source: own analysis based on "The Internal Market in 2009", GUS, Warsaw 2010. p. 35In 2009, the structure was dominated by retail sales of consumer goods andservices of non-food, which combined share was 61.4%. The share of food sales was notsignificant and amounted to only about 10% of total retail sales.19
Figure 3. Structure of retail sales in 2009Source: own analysis based on "The Internal Market in 2009", GUS, Warsaw 2010. p.34.Wholesale trade plays an important role in the Polish domestic trade. It is activein98% implemented by the private sector. In the structure of the share of wholesale salesof food and soft drinks accounted for13.5%, alcoholic beverages - 3.5%, while non-foodproducts - 83.0%. It is a reflection of the needs reported by the retail trade, where thestructure is also dominated by sales of non-food sales.Table 2. Wholesale trade enterprises by groups of goods in 2009 in million zł.Specification Total Food and softdrinksAlcoholicbeveragesNon-foodgoodsTotal 759 814,3 102 465,1 26 677,5 630 671,8382 456,2 48 189,5 16 828,1 317 438,6employingthan 49moreSource: own analysis based on "The Internal Market in 2009", GUS, Warsaw 2010. p. 442. Marketing mix in the retail tradeMarketing activities used in trade are different from the concept of marketingmix 4P. One of the main components of commercial marketing is the image of theretailer, in which image is composed of specially selected set of marketing instruments.In the retail marketing elements of the composition is also referred to as themerchandising mix, which in a narrower sense, relates to interior design shop (visualmerchandising), or involves exposure of goods and assortment management.20
D-Location: shopsand goods in theshopP-product (range)The width and depthRetail M-mixP-communication:Advertising, salespromotion, personalsales, marketingpropagandaC-marginRetail PriceMargin tradingFigure 4. Elements of marketing mix in the retail trade.Source: Own analysis based on J. Otto, A. Olczak: Marketing in trade and services. Technical University ofŁódź. Łódź 2007. p. 43In broader terms, merchandising mix usually includes four groups ofinstruments:• commercial offer - the width and depth of our product range;• margin - its height;• communication with buyers - the image of the shop, interior shop, salespromotions, personal selling, advertising;• technology - network location, logistics, technical equipment shop, handling,etc.Referring to the concept of marketing mix 4P, individual elements of marketingmix in the retail sector take on a different formula. The product is a commodity in trade,which trade a small degree may be modified - can be repackaged, sold in smallerquantities, or in another set of assortment.The price depends on the specific policies of trade margins. Retail price isincreased by the amount of margin trading, which takes into account the purchase price,other factors such as seasonality, demand elasticity and / or preserve competition.Distribution in commerce includes two components: the location of commercialand spatial visualization of the goods in the shop, which affects the convenience ofbuying by customers.However, promotion of retail trade is the process of communicating with themarket. Through a variety of promotion instruments can affect consumer behavior. The21
etail sector is also particularly important customer service, sales techniques andadditional services provided at points of sale of goods.In conclusion marketing in the retail sector has to perform two basic tasks:• to attract customers to the store (the traditional or virtual);• encourage them to make purchases at the store.The main elements of marketing in the retail sector include such elements as:• location;• image;• Internal environment;• assortment;• stimuli coming from the store;• relationships with customers and develop loyalty.These factors tend to customer satisfaction. It occurs when customerexpectations are met (or preferably exceeded). A satisfied customer can always return tothe store to make a rebuy or recommend it to your friends. Factors affecting theatmosphere, may be:• optical: color, light intensity, the appearance of objects (size and shape);• hearing: music (rhythm, style), sound (volume up);• olfactory: Fragrances (nature, intensity);• Touch: temperature, texture, touch contact;• taste: taste experience (nature, intensity).3. Marketing strategies in tradeOne of the main causes of changes in commercial activities is to achieve freemovement of products internationally. In such conditions, trading companies changeposition of passive intermediary in the active page in merchandise trade. Simultaneouslycreate market value and is increasingly affecting the structure of demand and supply.Should clearly distinguish between corporate strategies wholesale trade fromthose that deal with the retail trade. The assumption wholesalers operating in thebusiness market to a greater extent than retailers are focused on building and developingrelationships with their customers. In turn, retailers are focused more on the point of salepromotion and merchandising.The development of wholesale trade determines the structure of the economy inboth the manufacturing and retail. Wholesale trade in the traditional formula is reduceddue to a deterioration in the integration and consolidation in the market. Concentration oflead accumulation and integration of economic resources in a single economic organismand the emergence of a single decision-making center.In addition to the processes of consolidation and integration of the main factorslimiting the wholesale trade include :22
• development of information technology and teleinformation;• development of logistics centers, which take over the function of wholesaledistribution;• development of network forms of retailing;• development of direct marketing;• establishment of distribution centers, which are created by manufacturers.Despite the adverse changes resulting from the reduction of the wholesaledistribution channels the company undertake a wide range of innovative marketingstrategies. These activities are diverse in nature and depend on the form and position inthe market wholesaling industry.The major strategic changes in wholesale businesses include:• mergers and acquisitions;• network forms of wholesale trade;• creation of trademarks;• international expansion;• sales of the system.Marketing management in retail trade is also a complex process like any othercompany. In large retail units of strategic marketing activities are developed andimplemented at three levels:• company/group;• at the level of individual companies forming chains;• at the level of business units operating in a specific local market.The main criteria for the classification of marketing strategies in retail tradecould include :• the evolution of changes in retail trade;• key determinants of business entities;• organizational form of the trade;• geographical coverage.According to the theory of retail change can be divided into four main subjectsto which the retail trade:• natural selection;• the theory of wheel detail;• the theory of the accordion;• life-cycle theory of retail institutions.All these theories are based on similar assumptions, which indicate theimportance of changes in the environment influence the development of the retail trade.Ability to adapt to these changes, most of which were economic and social, isa necessary condition for the existence of the market.According to T. Wanat determinants of trading companies is:23
• modernity - the introduction of ICT innovations, computerization by theretailer;• diversification - finding the unique features are difficult to imitate;• low prices - from the top indicate a marketing instrument, which wants to usea retailer;• promotion at point of sale - is conducting an intensive promotional activitiesat point of sale with the participation and involvement of the supplier.Based on these factors, with four types of marketing strategies used by smallretailers: moderate, conservative-oriented and price-oriented image (table 5).Table 3. Types of marketing strategies in retail trade by WanatTypes of Marketing StrategyCharacteristicsConservativePrices medium and highPromotion to a limited extentLimited emphasis on the developmentTaking action outstandingModerateThere are no distinctive features on the marketPrices and product range adapted to the general levelof marketPrice-orientedLow pricesActivity in sales promotions conducted by thesupplierOriented to imageThe emphasis on modernity and distinction in themarketAttractive prices in relation to the value offeredIt is important to promote the store brandSource: J. Otto, A. Olczak: Marketing in trade and services. Technical University of Lodz. Lodz 2007. p. 173Depending on the organizational form of the trade can be observed thatindividuals differ in the extent and type of instruments used in marketing. A detailed listof marketing elements used by the different organizational forms of retail trade arepresented in table 6.Table 4. Marketing elements used by different organizational forms of retailingOrganizational form of retailDepartment storeHome SalesElements of MarketingWide, depth assortmentGoods: Clothing, footwear, textiles, appliances,furniture, household chemicals, cosmetics, groceriesType of service: pre-selection, traditional, selfserviceAdditional services: taking orders on the phone,mail, childcareLocation: shopping malls, city centerPrices: averageSales promotion: wide rangeAssortment: 1-2 branches, branch specialization anddeep assortmentGoods of good qualityPrices average and above average24
Location: town centers and / or peripheryPromotion: aimed at building a brand and image,customer loyalty promotions, promotional hirepurchaseAdditional services: home delivery, serviceCustomer Service: Pre-Selection and traditional salesqualifiedSpecialized shopAssortment of one branch of trade or one group,deepGoods: customized to the specific needs ofcustomersCustomer service: a high levelImage: the importance of the atmosphereAdditional services: the customer can be orderedproducts in terms of its expectationsLocation: city centers, shopping malls, commercialgalleriesPrices: high or averagePromotion: aimed at developing relationships withcustomers, rebates, loyalty discounts.Source: J. Otto, A. Olczak: Marketing in trade and services. Technical University of Lodz. Lodz 2007. p. 175-176.Retailers' marketing strategies used in the domestic market differ from thestrategy of the international market. Take action on foreign markets due to variousfactors, referred to as a "push " and "pull ". The factors that "push" resulting fromadverse business conditions in their country, are: market saturation, the recession andrestrictions. In the group of factors, "pull" are the incentives to invest in foreign markets,because of the favorable situation on them for the company. These include :• removal of barriers and harmonization of law in international trade;• untapped potential due to lack of infrastructure and weak competition;• harmonization of preferences and tastes of customers through globalcampaigns;• lowering the cost of transport and ICT infrastructure development;• the possibility of achieving higher sales and profits;• increasing the bargaining position of the international manufacturers.The expansion of commercial companies on the international stage is associatedwith a specific strategy to enter the foreign market. Retailer can develop through:organic growth, franchising, acquisition, local partner or network.4. Marketing in the food tradeAlready mentioned in the marketing role is particularly large trade. Directcontact with the ultimate consumer, trade, gives a chance for wide application ofmarketing methods. Offers the greatest potential in this regard, trade consumer goods,among which the largest share of foodstuffs. In trade, the buyer receive services that arethe result of the adaptation of market offer products to the needs of buyers in terms of25
time, place and form. Trade responsible for ensuring compliance of their market offeringwith the needs of buyers carry out its basic functions. Retail trade, where consumers tendto buy the food, is very developed, yet extremely diverse. There are many companiesand organizations engaged in food retailing, and new ones are emerging.Stores are characterized specific life cycle, which means that shops are formed,evolve and decline. Older forms of trade, which use traditional methods of customerservice and sales techniques, they need to reach full maturity longer than the new. Storesa new type replace traditional stores. Modern shops have to meet the demands ofcustomers and to provide appropriate levels of service.The retail trade usually offers four types of services:• self-service - most commonly used in stores selling consumer products,including food, distinguished by relatively low prices as a result of discounts,with customers attracted by the possibility of self-selection of goods, whichshorten the time of purchase and saving money;• self-service with the possibility of support by the supplier - in which customerscan always have recourse to the seller, receiving the payment for goodspurchased, but it is a form of self-service more expensive, because it requiresa broader employment of staff;• incomplete customer service - in which the sale of various products associatedwith the provision of additional services such as hire purchase, the possibility ofreturning the goods, etc., which increases the cost of sales, and thus the price;• full support for customers - at which the seller accompanied by customersthroughout the sales cycle, serving him with advice and assistance, and the highcost of service has caused an increase price.In the case of food most important is self-service sales and sales of traditional,full service provider of customer and vendor support.The first method, used mainly by young people, economically active, nothaving much time for shopping and making them work during the peak of trade, i.e. afterwork.The second form, based on the traditional sales primarily benefit older peoplewho like to be served and who have more free time, and therefore it can spend onshopping.Retail stores can be divided not only on the basis of the level of customerservice, but also under the terms of the range of goods offered. There are:• shops offering a wide range of products, which attaches great importance tointerior design, product quality, service, and his image and where profit marginsare high;• exclusive shops, having a narrow range of products where margins are high;• Shops with a narrow range of goods, which are the specialty stores to masscustomers, who attach importance to money, and in which by maintaining26
a standard design and centralized sales, advertising and distribution has a lowlevel of margins and prices;• stores with a wide assortment of goods, maintaining low margins, andcommodity prices and persistent image of shops where you can get a "chance".In the food trade, the most important are the latter two groups of stores, such asspecialized shops and general stores, offering a wide assortment of goods.Although the storefront has dominated sales of food markets, there is alsodeveloped sales outside the shop window. In the case of food may include the sale of thefollowing forms:• market sales and bazaars,• sales of agricultural food products in the holdings of their producers,• itinerant and itinerant sales (doorstep)• mail-order sale of vending machines for sale for home delivery, etc.In highly developed countries are booming sales of modern forms of foodproducts, resulting in an overall increase in sales outside the shop window.Sales of food products directly on farms play a greater role, among others dueto the desire of consumers to purchase food from a known source and the rise of the socalled. healthy food. Not without significance for this form of supply is to increase thevividness of the number of passenger cars owned by individuals, which facilitatescommunication and transport.The importance of doorstep selling and itinerant food now plays a small role.Greater significance as a form of supplying the urban population in the potatoes for thewinter. Moreover, its example is the sale of ice cream or corn, and soft drinks.Selling food in Poland is not yet developed on a large scale, while growing sales fromvending machines. Sales of home delivery of goods ordered in advance online or byphone is growing quite rapidly, especially in larger urban centers.Retail chain in Poland has been almost fully privatized. A role in the retail cooperativesstill play, especially the Consumer Cooperative "Społem". Retailers oftenmake marketing decisions regarding the selection of target market selection in productmix and sourcing, store atmosphere, pricing, promotion and site selection. The decisionconcerning the choice of target market needs to define the circle of buyers, which plansto operate a shop. For example you can choose between a rich medium or rich clients.Target market should determine the territorial scope of its activities.Retailers should always carry out research and observation of the market. Theirmain objective should be to gather opinions about whether the store meets theexpectations of its customers. Retail store must always adapt its offer of goods,conditions of sale, and even the appearance of the target market. Proceedings of retailersmust be flexible, especially in the food trade. For example, grocery prices have changedover time, even several times a day, to sell goods and to prevent its deterioration. Andthe need for flexibility to adapt to a changing environment, especially to the competition.27
The retailer must sometimes very quickly react to certain moves of competitors, or forexample to change laws.Important are also decide the composition of assortment of products offered. Itmust be consistent with the expectations of your target market. The range of goodsoffered is a very important element of competitive grocery stores. The scope of thesedecisions shall determine the extent of the range (narrow, wide) and depth (shallow,deep). Choosing assortment of goods, be aware of customers' quality requirements. Theretailer must choose the source of purchase of goods and determine the purchasingpolicy. Vendors must also determine the scope of services offered to customers. This canbe for example the supply of goods to the house, the possibility of buying on credit.Important is also the atmosphere in the store. Affected by the interior design shop and itsequipment. Store atmosphere should be tailored to the target market and should attractcustomers.Particularly large role in shaping our market position in retail prices have. Notalways is preferable to setting low prices for all goods. Sometimes it is preferable tosetting low prices for a selection of goods to attract customers. This purpose is servedless well salable, made on various occasions. Retail stores have benefit promotions tomaintain its market position, and even reinforce it. The scope of the promotion includesa variety of forms of advertising, as well as adequate preparation for the sales staff ofcustomer service and to apply various measures to promote sales. For the retailestablishment has succeeded, it must be well located. The food trade is particularlyimportant to locate the stores near residential neighborhoods.Grocery chain must be linked to a network of settlement. For large companiesthe problem is whether to create a network of small shops or a large. Shops should belocated so that their maintenance has been the most profitable in terms of promotion anddistribution. The size of stores should be associated with a range of shops.When choosing the location of the planned retail outlets, should take intoaccount the number of passers-by, to analyze customer habits and location of competingfacilities.Wholesale intermediary is an important link between production and retail. Itfulfills many functions, which could include: marketing and promotion, purchases ofgoods and assortment selection, storage, transportation, financing, risk-sharing, toperform other functions of a production such as standardization, packaging, freightprocessing, creation of commercial ranges, and also receive qualitative marketinformation provided to suppliers (products) and buyers and consultation, and variousforms of aid. Wholesalers, retailers often offer assistance in the form of various diversetypes of services, staff training, as well as external marketing. There are several types ofwholesalers. Depending on the scope of activities distinguished half wholesalers andwholesalers. In addition to wholesale half wholesalers lead a retail sales. However,wholesalers carry only a wholesaler, i.e., large batches of goods.28
In the wholesale trade of food products have a large role to meet the ConsumerCooperative. These cooperatives receive products from their members, store them andupright in preparation for sale, take measures to improve the quality of goods, promotethem, sell and divide the profits among members. Also there are wholesalersdispatching. In the case of food trade, they play a role in the sale of certain articles, suchas baby food, stimulants, spices, dietary foods for diabetics).In addition, the food brokers and agents act, to fulfill the functions of wholesaletrade, but are significantly different from it. Differences lie in the fact that they do nottake the goods on their account, and the functions performed by them in the sales processare limited in scope. Their task is to facilitate the buying and selling, for which chargea commission, the task of the broker is to match buyer and seller involved in thenegotiations.Wholesalers usually guided by the location of its facilities to other criteria thanretailers. For wholesalers the most important factor is the transport capacity, i.e. the easeof travel, and are thus located at the transportation routes on the outskirts of cities wherethe cost of maintenance and operation of the premises are lower.The warehouse activities plays an important role of technical progress affecting thequality of customer service. Particularly important is air conditioned storage, andcomputerization.Wholesalers often help retailers, especially the related fixed agreements oncooperation in the implementation of the marketing function. Examples of such actionsmay perform various types of information and advertising materials, which aretransmitted to retailers, organizing promotional events, which also includes a network ofretail trade. Wholesalers can also organize training retail employees in marketing, forexample preparing them to promote new products.Support for marketing granted by the wholesale and retailers may be free or be ona partial or full payment.Possession of shops for the food factories due to tradition and the economic andorganizational reasons. Very widespread today throughout the world are privatecompanies craft food processing nearly connected with the shop. So it formed a single,indivisible whole. Therefore it is difficult to imagine functioning without drinkingestablishments retail outlets.Due to its location in relation to the home of the food industry retail stores canbe divided into two types: the company stores, located in the immediate vicinity of theparent companies and stores field, some distance from the plant.Company stores should not be treated as ordinary retail outlets. Should meet theessential functions of marketing, whose importance increases as the intensification ofcompetition in the market.Retail stores should be specific, one of a kind showcase of the company and itsproducts, and show its capabilities. Each such store should be well maintained and29
equipped with a pretty clear sign that the given name of the parent company and itstrademark. The building cannot be neglected, the environment should be structured, andabove all clean and always cleaned up because the store sells food products that requirecleanliness.The company's grocery store, there should be an ideal purity, because based onher appearance customers form their view of the circumstances in which they aremanufactured goods produced by the company.In every store, and especially in a corporate exposure is an importantcommodity. It should allow customers to make eye contact with the product, whichfacilitates the selection and purchase decisions. For this reason, all the product rangesoffered should be properly arranged and distributed, that the client can see each of them.The arrangement and distribution of goods should induce buyers the impression ofabundance and richness of the range.Company stores should dispose of its commercial offer a full range of productsmanufactured by the company. It is very important because in addition to thecommercial function stores meet also features information and promotion.The grocery stores in general, and especially in the corporate in-plant shops,should be pretty shop window, placed in a window from the street or in a glazed shopcounter. Exhibition site are characteristic of traditional commerce. A more modern storesgoods in a special issue with glass counters and refrigerated, which protects the listedproducts against deterioration. Products placed on the traditional shop windows shouldalways be fresh. This exhibition is very important information and promotion not onlyfor the store, but for the entire enterprise.In some industries, retail stores (for example meat, confectionary) should bea separate part of consumption, properly equipped, the task of these shops is in fact alsofunctions to restaurants and offering products for consumption on the premises. Thissame store will be able to fulfill the function of tasting.New product, before mass production, should be market tested. Of the foodindustry should use to conduct these tests retail stores. In shops, these can performvarious types of promotions, products for example wine tasting, cooking demonstrations,etc. The functions of information and testing company stores should also beimplemented by ad hoc or periodic (e.g. monthly) transfer by the stores to the parentcompany (mobile marketing ) comments, opinions and suggestions of customers, whichshould be carefully analyzed and used to continuously improve the market offer. Thiscan be done in an orderly manner according to the specific form of questions.Company shop, especially in industries such as meat, dairy, confectionery, orfish, should not be solely a commercial facility. Shops, especially larger, they can alsomeet the production functions.30
Company stores can produce custom products and deliver them to the indicatedplace of transport company properly labeled. This is an important aspect of advertising.Products should also be supplied in packs labeled brand.Company store may thus become a specific, small, but an efficient commercialproduction unit, augments the parent company of food industry.Retail stores, through their subordination to the leadership of the food industryand by providing them with administrative support, and often thanks to its location onthe premises in the vicinity, to lower their own costs, which allows use of lower profitmargins and hence lower retail prices. This improves their competitiveness, and createsthe image of the store is cheap, accessible to all also for the poorer sections of society.A direct relationship organization of shop and plant food supply of goods easierand simplifies supply, retail stores are thus able to carry the fresh product, which hasa significant impact on consumers' decisions on the purchase. Company stores may besupplied with goods, even several times a day. This facilitates the adjustment of supplyto demand and ensure continuity of sales range of manufactured products, and ensurestheir freshness and quality.Company stores play an important role in accelerating the flow of commodity -cash, which is important for the economics of the enterprise.Besides shops, corporate food industry, some companies have stores umbrellaor umbrella stands located in large commercial units, for example in department stores.Stores and umbrella stand are among the traders. Exercise over their sponsorship bycertain of the food industry consists of supplying these stores with products on the basisof granting them exclusive selling them.Shops and umbrella stands can at least partially fulfill the functions listed aboveas appropriate corporate stores. Possession of shops and stalls of patronage is animportant factor for a promotional company and its products.5. Marketing activities in selected markets food productsMarketing on food markets is different depending on which product, the extentto which processed the trades. Meat and its products play a very important role in humandiet. Therefore, the marketing of meat products requires special attention. It uses thestandard instruments: product, packaging, price, promotion and distribution.Industry companies and butchers' meat-oriented marketing attach greatimportance to the structure of the assortment of products offered to consumers, productquality, news, trademark and packaging.Offer meat products is targeted to customers with different tastes and differentfinancial wealth. Therefore, we need a wide assortment that could cater to the variedneeds and tastes of consumers.A weakness in the marketing activity of meat products including marketing ofnew products, their development and realization of certain market segments need to have31
them. Also, very often the wrong way are fixed prices of new products, because it isdetermined using a formula based on cost, whereas in a market economy, preferenceshould be demand-pricing formula.Placing on the market a new product should be preceded by a phase of markettesting. The cost of carry is much lower than the financial losses associated with enteringthe market with an unsuccessful product, unresponsive to consumers. In practice,market-based tests are rarely used to shape the market offer.The existence of each product is linked to its quality. It is understood indifferent ways. Often it is associated with the utility of the products or the degree towhich they are able to meet the needs of buyers.The most authoritative assessment of the quality of meat and meat products,consumers appear, revealing that his behavior in the market. The degree of theirsatisfaction with the quality of evidence: the size of the sale, the amount of reportedcomplaints and the results of market research.Size of complaints about the quality of meat products is relatively small, muchsmaller than industrial products. This confirms the good quality of the market offer.Good quality product is associated by customers with a trade mark ofenterprises meat industry. The trademark plays an important role in marketing activities.Many of the meat industry is betting the brand and uses it in their marketing activities.Packaging of meat products with a different function. Marketing functions(information, promotion, identification and aesthetic) are the meat shields, packaging ofmeat products packaged and used sales packaging in the retail trade.The main factor in choosing the features of the product packaging. But theymust be taken into account also features marketing packages: the choice of theappropriate size, shape, color and appropriate information, as well as product name, orfeatures that highlight and encourage customers to purchase the product.Distribution of the meat is expansionary. The disadvantage of these systems ispoor penetration of distribution channel a producer-consumer, i.e., the shortest and leastexpensive. Direct sales to retail stores carry meat plants. The second channel ofdistribution of meat shops are the meat industry umbrella companies. Distribution ofmeat may also take place through a network of foreign wholesale and retail trade.In the distribution of meat and dairy, selective distribution is applied, basedlargely on specialized commercial network with a strong industry profile.Promotion of Polish meat products in terms of relations is poorly developed.Advertise announcement enterprises and wholesale meat industry is realized in the formof newspaper advertisements, radio and television. Their disadvantage is limiting theinformation about the commodity, and the fact that they generally lack the incentives topurchase.Promotional purposes, also serve the shops and butcher shops interiors unit. Onthe positive changes noteworthy design, which is an important marketing instrument.32
In other marketing activities carried out on fruit and vegetable market. This ismainly due to the different nature of these products - agricultural products are sold inlarge quantities in unprocessed form to customers by industry, traded goods are livingorganisms with high sensitivity and perishability. They are also a seasonal product. Theproduction of fruit and vegetables is very fragmented. As a result of yield variability isalso characterized by wide fluctuations in supply.Also in the marketing of fruit and vegetables are used in its basic instruments,such as products, packaging, pricing, promotion and distribution, product management.In the case of fruit and vegetable marketing management product aim at shaping the sizeof production and its structure, in that it can meet the needs of buyers. In the productionstructure is important not only to the selection of fruits and vegetables, but also theirvariations. By the structure of production must be understood to the appropriatedistribution of fruit and vegetable production during the year. Also important is the highquality of products.Also important is the proper preparation of fruit and vegetables for sale. Thatgoal could be activities such as transport, storage, processing (sorting, cleaning,standardization, packaging).Packaging of fruits and vegetables have a major impact on their sales. There hasbeen extensive development of the packaging company's commercial enterprises, forexample cooperative gardening and beekeeping and horticultural farms, especially largerones.Prices of fruits and vegetables are shaped in accordance with the rules of thegame market, i.e., according to the method of demand. Some share in the decisions ofpricing is the method according to prices of competitors. Cost method is usually not atall taken into account. In particular in the trade in fruit and vegetables is often usedquantitative and seasonal discounts.Pricing decisions in the trade of fruit and vegetables must demonstrate a highflexibility and speed. Otherwise, no product sold may deteriorate. Often there is alsoa need to sell at prices below cost. The aim is to encourage consumers to purchaseparticular goods of inferior quality. To be able to quick decisions on pricing, they shouldfall in the larger companies to the lower levels of government. Powers to bargain fruitand vegetables should be given managers of shops, stalls, and even the dealer.Distribution of fruit and vegetables is very developed and diversified. Largerole in her direct sales by agricultural producers to consumers. But the largest share inthe distribution and vegetables are brokers. These are mostly small retailers, for exampleowners of stalls, kiosks and shops fruit and vegetables. Trade in fruits and vegetables arepurely private entrepreneurs and traders.The importance of wholesale trade. It was based on mainly on the network vaultbelonging to the cooperative gardening and beekeeping, the majority of which have been33
liquidated. Currently, fruit and vegetable storehouses carry mainly agriculturalproducers, but do not have adequate database storage.Distribution of fruit and vegetables requires new organizational forms. Onepossible solution is too fruit and vegetables produced in the farms of members of thecooperative. Cooperatives may the storage infrastructure, fine processing, processingfacilities for fruits and vegetables, as well as its own network in the EU.These two examples show how diversity of assortment in the food trade makesdiversity marketing efforts. Other options trade of products creates a slightly differentproducts processed on high value added products.ConclusionsModern retailing is experiencing a very rapid and far-reaching changes. Newforms of trade and the old disappear. There are tendencies to direct sale of food toconsumers, or to create the of the food industry and larger farms retail outlets. Becomesshorter and shorter life cycle of retail outlets. Sales outside the shop window isdeveloping in various forms. Competition intensifies. The subject of competition is notonly the quality of customer service and range of products, but also advertising andinformation.In conclusion marketing in the retail sector has to perform two basic tasks:• attract customers to the shop (the traditional or virtual);• encourage them to make purchases in this shop.Marketing plays a vital role in trade, especially in the food trade. In the businessis in direct contact with the buyer the seller is an ideal situation to apply various forms ofmarketing instruments, such as personal selling, sales promotion, wine tastings,advertising, etc.The growth of large-format stores makes marketing in the food trade arenecessary, and enforce implementation of the activities of a marketing and small shops,residential areas, often micro-enterprises with the status of family businesses. It givestangible benefits to customers sourcing in these stores.SummaryThe marketing of food products on the market especially large role is played bytrade. Direct contact with the ultimate consumer, trade, gives a chance for widespreaduse of marketing methods. The methods and marketing strategies resulting from the saleof forms and types of units in retail and wholesale. This paper reviews the variouscombinations of the sale of food products, offering various opportunities for marketingactivities.Retail trade, in which consumers are stocking up on food, is very developed,yet extremely diverse. There are many companies and organizations engaged in theretail sale of food and new ones are emerging. In the event of major importance to foodself-service sales, and sales of traditional, full service provider of customer and dealersupport. The food trade the most important are two groups of shops, i.e. shops34
specialized and general food stores, offering a wide range of goods.Although sales dominated the market for grocery storefront, there is alsodeveloped outside the storefront sale. In highly developed countries rapidly developmodern forms of selling food products, resulting in overall sales growth outside thestorefront. In the case of food it can include the following forms of sales: market salesand bazaars, sales of agricultural food products manufacturers in their farms, andotherwise than by itinerant sales (doorstep), mail-order sale of vending machines, sale ofhome delivery, etc.Sales of food products directly on farms plays a greater role, among others dueto the desire of consumers to buy food from a known source and the rise of the so-called.healthy food. Not without significance for this form of supply is to increase the vividnessof the number of cars owned by individuals, which facilitates communication andtransport.Literature1. Chudy S., Pietraszewski M. (2006): The economics of trade. Ed. eMPi2.Poznan.2. Kotler Ph. (2010): Kotler on marketing. How to create, win and dominatemarkets. Rzeczpospolita. Warsaw.3. Philip Kotler answers questions about marketing. REBIS Publishing House.Poznan.4. Otto J., Olczak A. (2007): Marketing in trade and services. TechnicalUniversity of Lodz. Lodz.5. Pilarczyk B., Sławińska M., Mruk H. (2001): Marketing strategies for traders.PWE. Warsaw.6. Red. Pilarczyk B., Mruk H. (2007): Compendium of knowledge aboutmarketing. OWN Warszawa.7. Red. Sławińska M. (2008): A compendium of information about trade. OWNWarszawa.8. Szmid W. (2002): Media under pressure of globalization. Placet. Warsaw.9. "The internal market in 2009", GUS, Warsaw 201010. Urban S. (1999): Marketing of products food products. Ed. University ofEconomics, Wroclaw.Phd eng. Ewa Bąk-Filipek<strong>SGGW</strong>, Warsawewa.bak.filipek@wp.plM.Sc. Urszula Tetwejer<strong>SGGW</strong>, Warsawurszula_tetwejer@sggw.pl35
5 (54) 2011Jarosław GołębiewskiZmiany w otoczeniu jako czynnik kształtujący działaniamarketingowe przedsiębiorstw agrobiznesuChanges in the environment as a factor affecting agribusinessmarketing firmsCelem artykułu było określenie skutków zmian środowiska gospodarczego i biznesowego nadziałalność marketingową przedsiębiorstw agrobiznesu. W opracowaniu dokonano przeglądugłównych tendencji występujących w różnych sferach otoczenia marketingowego przedsiębiorstw.Przedstawiono również wpływ tych zmian na koncepcje marketingu. Artykuł przedstawia ponadtodiagnozę głównych opcji marketingowych w obszarze agrobiznesu.WstępAgrobiznes jest ważnym elementem współczesnej gospodarki. Kształtuje się onpod wpływem rozwoju tych jej gałęzi, które związane są z wyżywieniem społeczeństwa.Rozwój agrobiznesu, jak podkreśla Woś, związany był z postępującym podziałem pracyi wyodrębnieniem się z rolnictwa sektorów: środków do produkcji, przemysłuspożywczego, handlu i usług 1 . Agrobiznes spełnia współcześnie wiele funkcji. Dogłównych zaliczyć należy dostarczanie żywności oraz dóbr i usług nieżywnościowych.Ponadto agrobiznes jest miejscem pracy (zatrudnienia) i sferą alokacji kapitału. Ważnąrolę odgrywa również w kształtowaniu infrastruktury społecznej oraz środowiskaprzyrodniczego. Agrobiznes jest segmentem gospodarki narodowej obejmującym wielesektorów i rodzajów działalności. W tym ujęciu wyodrębnić można: sektor produkcjii dystrybucji środków produkcji dla rolnictwa, rolnictwo, przemysł spożywczy i hurtowyobrót surowcami rolniczymi, handel hurtowy artykułami spożywczymi, handeldetaliczny artykułami spożywczymi oraz sektor usług gastronomicznych. Doagrobiznesu zalicza się również sektory badawcze związane z produkcją żywności 2 .Agrobiznes wykazuje znaczne zróżnicowanie pod względem struktury instytucjonalnej(podmiotowej). W jego obszarze funkcjonuje wiele różnorodnych typów przedsiębiorstwpod względem wielkości (mikro, małe, średnie i duże), czy formy prawnej(indywidualne gospodarstwa rolne, spółki, spółdzielnie). Występują zarówno podmiotyniezależne jak i struktury zintegrowane pionowo, grupy marketingowe, organizacjesieciowe, systemy franchisingowe oraz struktury korporacyjne.1A. Woś: Agrobiznes. Makroekonomia. Tom 1. Wydawnictwo KEY TEXT, Warszawa 1996, s. 17.2 A. Woś, J. S. Zegar: Gospodarka żywnościowa. Problemy ekonomiki i sterowania. PWE, Warszawa 1983,s. 25.36
Zróżnicowana struktura podmiotowa agrobiznesu powoduje mnogość rozwiązańmarketingowych i różnorodność realizowanych na rynku strategii. Wydaje się jednak, żejedną z podstawowych cech działań marketingowych w agrobiznesie jest zwracanieuwagi przez uczestników rynku na środowisko marketingowe. Zmiany środowiskamarketingowego muszą być uwzględniane zarówno przez drobne indywidualnegospodarstwa rolne, jak i wielkie koncerny rolno-przemysłowe funkcjonujące na skalęglobalną. Każde przedsiębiorstwo pozostaje w relacjach z środowiskiem naturalnym,społecznym i ekonomicznym. Przedsiębiorstwa agrobiznesu istnieją „w” i „dzięki”otoczeniu. Oznacza to, że otoczenie marketingowe odgrywa kluczową rolęw funkcjonowaniu przedsiębiorstw.Celem opracowania jest przedstawienie głównych trendów w otoczeniumarketingowym agrobiznesu i ich konsekwencji dla teorii i praktyki marketingu.W pracy zwrócono również uwagę na główne opcje marketingowe przedsiębiorstwsektora rolno-żywnościowego w świetle zachodzący zmian środowiska gospodarczego,społecznego i naturalnego. Podstawą źródłową pracowania były literatura przedmiotuoraz opracowania branżowe.Globalne trendy kształtujące marketing w agrobiznesieAgrobiznes jest jednym z elementów gospodarki. Koniec pierwszej dekady XXI w.były okresem, w którym uwidoczniło się wiele nowych zjawisk kształtującychzachowania konsumentów i przedsiębiorstw. Jak podkreślają Kotler i Caslione „światwszedł w nową epokę gospodarczą” 3 . Jedną z podstawowych cech tej epoki sąturbulencje na rynku. Turbulencje znane w naturze i fizyce występują równieżw odniesieniu do rynku i wpływają na całą gospodarkę. Mimo wydajnych technikinformatycznych nie da się ich przewidzieć i opisać. Stają się one źródłem wyższegoryzyka, na które narażone są przedsiębiorstwa. Do podstawowych czynników, którepowodują wzrost ryzyka we współczesnej gospodarce zalicza się:• postęp techniczny i rewolucję informacyjna,• przełomowe technologie i innowacje,• wschodzące gospodarki,• hiperkonkurencję,• środowisko naturalne,• wzrost siły klienta 4 .Technologie informacyjne stanowią jedną z najważniejszych sił napędowychrozwoju współczesnej gospodarki. Dynamiczny rozwój od początku lat 90. XX wiekuprodukcji komputerów, oprogramowania, telekomunikacji, czy mediów umożliwiaszybki przepływ danych na całym świecie. Rewolucja informatyczna uznawana jest zajeden z najważniejszych czynników wpływających na współczesną, globalnągospodarkę. Internet umożliwia stworzenie pomiędzy wszystkimi ludźmi i wszystkimipodmiotami gospodarczymi sieci powiązań i zawieranie transakcji nie tylko narynkach lokalnych. Internet umożliwił transformację i globalizację handlu, stworzył3 Ph. Kotler J.A. Caslione: Chaos. Zarządzanie I marketing w erze turbulencji. MT BIZNES, Warszawa 2009,s. 21.4 Ph. Kotler J.A. Caslione: Chaos. Zarządzanie I marketing w erze turbulencji. op. cit., s. 33.37
nowe formy zawierania transakcji, organizacji produkcji, prowadzenia marketingu,pozyskiwania pracowników i zawierania umów. Powstały nowe środki przekazu takiejak poczta elektroniczna, witryny internetowe, komunikatory, biuletyny elektroniczne,blogi, transmisje internetowe. Umożliwiają one wymianę informacji i współpracęróżnym podmiotom. Zmiany informatyczne determinowane były przede wszystkimspadkiem kosztów urządzeń (komputery) gwałtownym wzrostem mocy przetwarzaniadanych.Istota przełomowych innowacji polega na tym, że wywołują silne zmiany narynku i powodują, iż dotychczasowe rozwiązania technologiczne i produkty stają sięprzestarzałe. Takie zmiany prowadzą do przekształceń w gospodarce. Dotyczą onezarówno tych, którzy związani byli z dotychczasową techniką, jak i tych powiązanychz nową. Opakowania próżniowe, technologia UHT 5 i inne sposoby konserwowania,stały się w produkcji żywności podstawą rozwoju nowych produktów i techniksprzedaży.Istotnym czynnikiem powodującym zmiany w gospodarce światowej jest rola jakąposzczególne kraje lub grupy krajów odgrywają w globalnej gospodarce. Głównątendencją jest zmniejszanie się znaczenia USA i krajów Europy, przy jednoczesnymumacnianiu się wschodzących rynków, w tym szczególnie krajów BRIC oraz bogatychkrajów Bliskiego Wschodu. W ostatnim okresie działają one stabilizująco na gospodarkęświatową przez wzrost konsumpcji lub inwestycje finansowe na zagrożonych kryzysemrynkach europejskich lub USA. BRIC to grupa krajów, w skład której wchodzą Brazylia,Rosja, Indie i Chiny. Stanowią one prawie połowę światowej populacji. Kraje te sąbardzo zróżnicowane pod względem struktury gospodarki. Brazylia jest potęgąw produkcji rolnej, gospodarka rosyjska bazuje na surowcach, w Indiach dynamicznierozwija się sektor usług a Chiny przeżywają boom budowlany i eksportują coraz bardziejzaawansowane technologicznie wyroby swojego przemysłu 6Hiperkonkurencja oznacza gwałtowne zmiany na rynku, pod wpływem którychrywalizujące podmioty są zmuszane do zmian w działalności, aby utrzymać lub zdobyćprzewagę. Globalizacja, rozwój nowych produktów, zróżnicowanie gustówkonsumentów, deregulacja i znoszenie barier handlowych powodują zmiany strukturrynkowych i zagrożenia dla dotychczasowych liderów operujących w poszczególnychbranżach.Nowym czynnikiem wpływającym na światową gospodarkę są tzw. państwowefundusze majątkowe (sovereign wealth fund, SWF). Są to fundusze inwestycyjnepozostające w gestii państwa, na które składają się akcje, obligacje, nieruchomości,metale szlachetne i inne instrumenty finansowe. Istnieją one od dawna, ale dynamicznyrozwój nastąpił po 2000 r. a szczególnie istotne znaczenie miały podczas globalnegokryzysu finansowego, kiedy to przyczyniły się do uniknięcia bankructwa wielu5 UHT jest skrótem, oznaczającym Ultra Wysoką Temperaturę (ang. Ultra High Temperature). Obróbka UHTstanowi technikę utrwalenia płynnych produktów spożywczych przez poddanie ich krótkotrwałemu (2-10s),intensywnemu ogrzewaniu, zazwyczaj do temperatur w zakresie 135 – 140oC. Ta metoda niszczydrobnoustroje, które inaczej spowodowałyby zepsucie produktów. Obróbka UHT stanowi proces ciągły, któryodbywa się w zamkniętym układzie, co zapobiega zanieczyszczeniu produktu przez drobnoustroje przenoszonez powietrzem. Produkt przechodzi przez etapy ogrzewania i schładzania następujące szybko po sobie.http://www.tetrapak.pl [dostęp 10 czerwca 2011 r.]6 Dla kogo fundusz typu BRIC? http://www.finanse.egospodarka.pl [dostęp 10 czerwca 2011 r.]38
amerykańskim i europejskim instytucjom gospodarczym oraz finansowym.Największymi aktywami dysponują fundusze inwestycyjne należące do takich państwjak Chiny, Singapur, Dubaj, Kuwejt 7 . Inwestycje funduszów SWF powodują, że rolapaństwa w globalnej gospodarce wzrasta.Współczesne przedsiębiorstwa znajdują się pod coraz silniejszą presjąoszczędzania surowców naturalnych, redukcji zanieczyszczenia, hamowaniaglobalnego ocieplenia. Działania te podwyższają koszty prowadzenia działalnościgospodarczej. Wzrasta znaczenie różnego typu organizacji określanych ogólnie jakoruch zielonych. Konsumenci i społeczeństwo w konsumpcji i inwestycjach wykazującoraz większa świadomość i dbałość o powietrze, wodę, energię. Konkurujące ze sobąpodmioty w zróżnicowanym tempie inwestują w ochronę środowiska. Niekiedywyrównywanie szans wymaga regulacji rządowych. Znacznie większa skala tego typudziałań występuje w Europie czy USA niż w krajach zaliczanych do rynkówwschodzących. Dostosowanie przedsiębiorstw do zmian wynikających z problemówochrony środowiska wymaga opracowania strategii osiągania Trwałości DziałalnościGospodarczej (TDG), dzięki której „zielone” rozwiązania zapewnią równieżodpowiedni zysk z tych inwestycji 8 .W działalności gospodarczej przez wiele lat dominowała emisja informacji przezwykorzystanie reklamy marki w radiu, telewizji, prasie i na bilbordach. Decyzjepodejmowane przez konsumenta bazowały na tych informacjach i własnymdoświadczeniu. Powstawała więc asymetria przepływu informacji, w której przewagęmiał sprzedający. Ostania dekada to okres znacznych zmian w tym zakresie.Konsumenci obok informacji przekazanej w reklamie przez sprzedawców pozyskująwiedzę na temat produktów i marek od swoich znajomych i przyjaciół zapośrednictwem Facebook 9 i różnego rodzaju blogów tematycznych. Interesariuszeprzedsiębiorstw (klienci, kontrahenci, akcjonariusze) stają się aktywną stronąw procesie marketingu. Wzbogacają swoją wiedzę na temat firmy, produktu i mogą tąwiedzą bez ograniczeń dzielić się z innymi. Konsekwencją tego jest szybszewypadanie z rynku tych, którzy sprzedają produkty poniżej wymaganej przezkonsumentów normy lub niskiej jakości.Kotler wskazuje trzy podstawowe trendy, które kształtują współczesny krajobrazbiznesowy: współuczestnictwo, paradoks globalizacji oraz erę społeczeństwatwórczego 10 . Współczesny marketing bazuje przede wszystkim na współuczestnictwiei marketingu korporacyjnym. Postęp technologiczny w ostatnich stu latach powodowałzmiany, które odnosiły się do konsumentów, rynków i marketingu. Marketing narodziłsię wraz z rozwojem technologii produkcji w czasie rewolucji przemysłowej 11 .Zmieniał się wraz z rozwojem technologii informacyjnej i Internetu. Rozwójtechnologii nowej fali jest główną siłą napędową współczesnego marketingu.Technologia nowej fali pozwala na łączenie się i interaktywność jednostek i grup.Składają się na nią takie elementy jak: tanie komputery i telefony komórkowe, niskie7 W. Gadomski: Państwa budują fundusze inwestycyjne. http://www.bankier.pl/ [dostęp 10 czerwca 2011 r.]8 Ph. Kotler J.A. Caslione: Chaos. Zarządzanie I marketing w erze turbulencji. op. cit., s. 51.9 Założony przez studentów z Uniwersytetu Harvarda w 2004 r.10 Ph. Kotler, H. Kartajaya, I. Setiawan: Marketing 3.0. Dobry produkt? Zadowolony klient? Spełnionyczłowiek? MTB BIZNES, Warszawa 2010, s. 19.11 J. Altkorn: Podstawy marketingu. Instytut Marketingu . Kraków 1993. s. 16.39
koszty połączeń internetowych oraz otwarte oprogramowanie. Umożliwiają onejednostkom wyrażanie siebie i współdziałanie z innymi. Ludzie nie tylko konsumujądostępne w Internecie wiadomości, rozrywkę, idee ale je również tworzą. Konsumencistają się w tej sytuacji prosumentami 12 . Głównym czynnikiem przyczyniającym się dorozwoju technologii nowej fali jest powstanie tzw. mediów społecznościowychzarówno ekspansywnych jak i kooperacyjnych. Do mediów ekspansywnych zalicza sięblogi, Twitter, YouTube, Facebook, portale umożliwiające wymianę zdjęć i informacji(Nasza Klasa). Blogi tworzone są przez użytkowników Internetu i znajdują wieluczytelników na całym świecie. Twiter jest jednym z najszybciej rozwijających sięmediów społecznościowych. Strona pozwala użytkownikom na publikowaniewiadomości (tweedów) o wielkości do 140 znaków. Blogi i konta na Twitterze mogąmieć charakter osobisty lub być tworzone przez osoby, które pragną komentowaćwydarzenia ze świata bądź dzielić się swymi poglądami. Stwarza to możliwośćwpływania również na decyzje konsumentów, jak również nowy obszar aktywnościprzedsiębiorstw. Pracownicy tworząc blogi mogą rozmawiać na temat swojej firmy.YouTube pozwala dzielić się krótkimi filmami wideo z innymi. Stwarza to możliwośćkomunikacji marketingowej. Wielu producentów żywności przygotowujei rozpowszechnia informacje na temat swojej oferty, nowych produktów przywykorzystaniu tego środka przekazu.Oprócz postępu technologicznego, który kształtuje współczesnego konsumentai wpływa na działania marketingowe ważnym elementem kształtującym zmiany narynku jest globalizacja. Jest ona oczywiście nierozłącznie związana z technologią,która pozwala na wymianę informacji między krajami, firmami i jednostkami nacałym świecie. Technologia transportu ułatwia handel i fizyczną wymianę na rynkuglobalnym. Globalizacja podobnie jak technologia staje się zjawiskiem powszechnymi tworzy gospodarkę opartą na powiązaniach i współzależnościach występującychmiędzy wieloma rynkami, w skali całego świata. O ile jednak technologia, jeżeli jestprzyjęta, staje się powszechna, o tyle w przypadku globalizacji można zaobserwowaćwystępowanie zjawisk o przeciwstawnym charakterze. Dojście do równowagi stajesię przyczyną wielu paradoksów. Przede wszystkim paradoksu politycznego. Europa,szczycąc się osiągnięciami demokracji, traci pozycję ekonomiczną w stosunku doChin, gdzie demokracja w europejskim ujęciu nie zawsze ma miejsce. Wynika z tego,że globalizacja powoduje otwarcie poszczególnych gospodarek w wymiarzeekonomicznym natomiast wymiar polityczny ma ciągle charakter nacjonalistyczny.Globalizacja wymaga integracji gospodarczej, jednakże trudno jest doprowadzić dostworzenia równych gospodarek. W wyniku globalizacji jedne kraje rozwijają sięszybciej, a w innych proces ten przebiega wolniej. Globalizacja nie tworzy jednolitejkultury. Kultura mimo tworzenia standardowych dóbr pozostaje zróżnicowana.Można mówić o konflikcie między systemem, którego symbolem jest Jaguar czyMercedes a systemem czerpiącym z siły tradycji, czy społeczności lokalnych.Zmiany technologiczne i paradoksy globalizacji wpływają na zachowaniakonsumentów. Z jednej strony poprzez korzystanie z nowoczesnych technologii stająsię oni obywatelami świata, z drugiej jednak występuje presja pozostania obywatelem12 Ph. Kotler, H. Kartajaya, I. Setiawan: Marketing 3.0. Dobry produkt? Zadowolony klient? Spełnionyczłowiek? Op. cit., s. 2040
swojego kraju. Paradoksy te nie są chyba możliwe do rozwiązania. Powoduje to, żemusimy się nauczyć sobie z nimi radzić. Globalizacja powoduje jednak równieżpozytywne efekty w tym zakresie. Większa świadomość, wrażliwość na ubóstwoi niesprawiedliwość, problemy środowiska naturalnego, stają się corazpowszechniejsze.Trzecim czynnikiem kształtującym współczesny marketing są narodzinyspołeczeństwa twórczego. Coraz ważniejszą rolę odgrywają w społeczeństwie ludzienauki, sztuki, zajmujący się profesjonalnymi usługami. Są oni w przeważającej częściodkrywcami, innowatorami, tworzącymi nowe technologie i rozwiązania, a takżekorzystającymi z nich. Podstawową cechą społeczeństw jest zwracanie przez ludziuwagi na samorealizację obok potrzeby przetrwania. Współczesny marketingwymaga zwracania uwagi na współpracę, kulturę i bardziej duchowe postrzeganieświata.Wpływ zmian w otoczeniu na działalność marketingowąprzedsiębiorstwDostosowywanie się koncepcji marketingu do nowych etapów rozwojuspołeczeństw jest jedną z najbardziej charakterystycznych jego cech. Marketing wostatnich kilkudziesięciu latach wykształcił trzy główne dyscypliny: zarządzanieproduktem, zarządzanie klientem i zarządzanie marką. Koncepcje marketinguewaluowały od skupienia się na zarządzaniu produktem (lata pięćdziesiątei sześćdziesiąte XX w.), przez zarządzanie klientem (lata siedemdziesiątei osiemdziesiąte) a następnie w latach 90. i w pierwszej dekadzie XXI w. na zarządzaniumarką 13 . Od czasów wprowadzenia przez Niela Bordena pojęcia mix marketingowyw latach 60. XX w. i wprowadzenia przez Jerome McCarthy zasady czterech P w końculat 60. koncepcje marketingu przechodziły znaczącą transformację i dostosowywały siędo zmieniającego otoczenia.W warunkach dominacji sektorów produkcyjnych koncepcje marketingowekoncentrowały się na zarządzaniu produktem. Marketing postrzegany był jako jednaz wielu ważnych funkcji wspierających działalność produkcyjną (między innymifinanse, kadry). Podstawowym zadaniem marketingu było stworzenie popytu naprodukty wytwarzane przez przedsiębiorstwa. Teoria 4P wskazywała, że zarządzanieproduktem polega na jego opracowaniu, ustaleniu ceny, przeprowadzeniu odpowiedniejpromocji i wyborze kanałów dystrybucji. Wzrostowe tendencje na rynku powodowały,że działania te były wystarczające dla utrzymania i rozwoju przedsiębiorstw.Zmiany w gospodarce wywołane kryzysem energetycznym i brak stabilności rynkuw latach siedemdziesiątych i osiemdziesiątych XX w. oraz niższa dynamika wzrostupopytu i wzrost konkurencji powodowały konieczność poszukiwania nowych koncepcjimarketingowych. Ich przejawem było zwiększenie liczby instrumentów (liczby P).Dodanie personelu (people), procesu, obsługi klienta 14 , było tego przejawem. Klasycznymodel marketingu oparty na strukturze 4 P pozostawał niezmienny. Kryzys spowodowałjednak jedną fundamentalną zmianę w marketingu, a mianowicie spowodował, że zaczął13 J. Otto: marketing relacji. Koncepcja i stosowanie. Wydawnictwo C.H. Beck. Warszawa 2001. s. 30.14 A. Payne: Marketing usług. PWE. Warszawa 1997. S. 223.41
on ewoluować z poziomu taktycznego na poziom strategiczny. Stymulowanie popytuwymaga przeniesienia uwagi z produktu na klienta. Klient stał się punktem centralnymdziałań marketingowych 15 . Nastąpił rozwój dyscypliny określanej jako zarządzanieklientem, która uwzględniała strategię segmentacji, ukierunkowania działań (tzw.targeting) oraz pozycjonowanie 16 . Marketing STP koncentrował się w większym stopniuna kliencie niż produkcie, przyjmował wymiar strategiczny, a stosowane metodydeterminowały rozwój 4P.Zmiany w latach 90. XX w. związane z technologią komputerową i rozwójinternetu spowodował, że informacja stała się szeroko dostępna a konsumenci corazlepiej poinformowani. Dostosowanie się marketingu do tych zmian przejawiało sięprzede wszystkim w zwróceniu uwagi na ludzkie emocje. Wprowadzono takie pojęciajak marketing emocjonalny, marketing doświadczeń oraz wartość marki.Wygenerowanie popytu wymagało nie tylko dotarcia do umysłu nabywców za pomocąklasycznego pozycjonowania ale dotarcia do „serc” konsumentów. Zarządzanie markąjest odzwierciedleniem takiego podejścia do marketingu 17 .Kryzys gospodarczy końca pierwszej dekady XX w., który podważył styl życia„kup teraz, zapłać później” i spowodował, że konsumenci coraz ostrożniej zaczęliwydawać pieniądze, mimo iż rządowe regulacje rynku kredytów uniemożliwią szybkipowrót do tej sytuacji. Zmusza to do poszukiwania nowych koncepcji marketingu, conie oznacza, że dotychczasowe przestają znajdować zastosowanie. Cały czas istotnajest segmentacja rynku, wybór rynku docelowego, pozycjonowanie, 4P, budowaniemarki. Jednakże zmiany w środowisku marketingowym i biznesowym takie jakrecesja, zmiany klimatyczne, rozwój nowych mediów społecznościowych, większa siłakonsumentów technologie nowej fali, czy globalizacja są i będą czynnikamistymulującymi rozwój działań marketingowych.Jednym ze skutków (przyczyn i przejawów) ostatniego kryzysu jest spadekzaufania, przede wszystkim w relacjach pionowych. Konsumenci bardziej sceptyczniepodchodzą do oferty prezentowanej przez dostawców. Wierzą bardziej obcym ludziomnależącym do sieci społecznościowych niż ekspertom. Tracą zaufanie do praktykbiznesowych. Z pewnością działania marketingowe przyczyniły się do tego –postrzegane są często bowiem ja sztuka perswazji a nawet manipulacji. Skutkiem tegojest większa skuteczność marketingu szeptanego aniżeli marketingu opartego narelacjach pionowych 18 .Kotler przyszłość marketingu upatruje w trzech aspektach: współtworzenie,budowanie społeczności i budowaniu osobowości marki (tabela 1).15 Ph. Kotler: Marketing. Wydawnictwo REBIS, Poznań 2005. S. 24.16 K. Przybyłowski, S. W. Hartley, R. A. Kerin, W. Rudelius: Marketing. Dom Wydawniczy ABC, Warszawa1998, s. 195.17 J. Kall: Silna marka. Istota i kreowanie. PWE, Warszawa 2001, s. 9.18 Marketing szeptany (ang. whisper marketing, word of mouth marketing) – to działania marketingowe mająceza zadanie dotarcie z informacją marketingową do odbiorcy za pośrednictwem bezpośredniego"spontanicznego" przekazu ustnego. Kanałem przekazu informacji w marketingu szeptanym jest bezpośredniadyskusja lub opowiadanie.42
Współtworzenie odnosi się do nowego podejścia do innowacji. Nowe sposobytworzenia produktu bazują na współpracy firm, konsumentów, dostawców, partnerówhandlowych połączonych w sieci tworzące innowacje. Proces współtworzeniaobejmuje stworzenie pewnej platformy (bazy), która będzie dostosowywana doindywidualnych potrzeb. Wymaga również umożliwienia konsumentomdostosowywania i przekazywania informacji zwrotnych oraz propozycjiudoskonalenia. Budowanie społeczności opiera się na wykorzystaniu technologii,która nie tylko łączy kraje i firmy, ale również łączy konsumentów w społeczności.Budowanie osobowości marki wymaga natomiast stworzenia autentycznego DNA(Distinctiveness, Novelty, Attributess). To DNA staje się podstawowym elementemwyróżnienia marki na rynku. Musi ono odzwierciedlać tożsamość markiw społecznych sieciach konsumentów. Podstawą sukcesu jest autentyczność markii dostarczanie przeżyć jakie są obiecywane. Utrata wiarygodności konsumentówoznacza w warunkach poziomych relacji utratę całej sieci potencjalnych klientów 19 .Tabela 1. Ewolucja koncepcji marketinguDyscypliny marketingu Marketing współczesny Przyszłe podejścieZarządzanie produktemZarządzanie klientem4P (produkt, cena,dystrybucja, promocja)STP (segmentacja,targeting, pozycjonowanie)WspółtworzenieBudowanie społecznościBudowanie osobowościZarządzanie marką Budowanie markimarkiŹródło: Ph. Kotler, H. Kartajaya, I. Setiawan: Marketing 3.0. Dobry produkt?Zadowolony klient? Spełniony człowiek? Op. cit., s. 49Ważną cechą marketingu jest zmieniające się podejście do konsumenta.Konsument „składa się” z ciała, umysłu zdolnego do myśli i analizy, serca zdolnegodo emocji i ducha – duszy. W marketingu, odnoszenie się do umysłu jest podstawąpozycjonowania. Celem działań marketingowych jest doprowadzenie do tego abyprodukt zajął unikatowe miejsce w umyśle docelowych klientów. Koncepcjamarketingu emocjonalnego odwołuje się do elementu ludzkiej psychiki. Przykładowoslogany reklamowe piwa Lech próbują odwoływać się nie tylko do umysłu, alerównież emocji (kto nie chciałby spotkać się z kolegami w pubie na piwie pogodzinach ciężkiej pracy?)Nowe ujęcie marketingu można zobrazować jako trójkąt, na który składają sięmarka, pozycjonowanie oraz wyróżnienie na rynku (rysunek 1).19 Ph. Kotler, H. Kartajaya, I. Setiawan: Marketing 3.0. Dobry produkt? Zadowolony klient? Spełnionyczłowiek? Op. cit., s. 5143
Rysunek 1. Model 3iUczciwość markiPozycjonowanieWyróżnienieTożsamośćmarki3iMarkaWizerunekmarkiŹródło: Ph. Kotler, H. Kartajaya, I. Setiawan: Marketing 3.0. Dobry produkt?Zadowolony klient? Spełniony człowiek? Op. cit., s. 54Uzupełnia to 3i: tożsamość marki (identity), uczciwość marki (integrity) oraz wizerunekmarki (image). W świecie poziomych relacji marka nie jest istotnym elementemmarketingu jeżeli jest jedynie pozycjonowana. Pozycjonowanie to bowiem zaledwieokreślenie przez firmę cech, które mają zwrócić uwagę nabywców. Wyróżnienie jestzapewnione przez DNA marki, które odzwierciedla jej uczciwość. Jest to dowód na to, żemarka dostarcza to, co jest obiecywane. Synergia wyróżnienia i pozycjonowaniakształtuje wizerunek.Dylematy strategiczne marketingu w agrobiznesieFunkcjonowanie przedsiębiorstw agrobiznesu w warunkach zmieniającej sięgospodarki, społeczeństwa a także środowiska naturalnego wymaga przewidywaniai umiejętnego dostosowywania się do zachodzących procesów. Powstają oczywiściepytania jak dostosować się do sytuacji kiedy w ciągu krótkiego okresu gwałtownie rosnąceny surowców energetycznych czy sytuacji kiedy w wyniku informacji medialnej (niedo końca w 100% potwierdzonej) gwałtownie spada popyt na ogórki i inne warzywaa niektóre kraje wprowadzają embargo na import tych produktów z całego obszaru UE.Są to pytania, na które bez wątpienia trudno znaleźć dobrą i jednoznaczną odpowiedź.Wydaje się jednak, że dla kierujących przedsiębiorstwami funkcjonującymiw agrobiznesie ważne są trzy kierunki działań. Po pierwsze bardziej aktywne,dynamiczne prowadzenie planowania strategicznego. Po drugie włączenie w proces44
podejmowania decyzji głównych interesariuszy przez wykorzystanie między innymiinteraktywnych kanałów komunikacji. I po trzecie wykorzystanie potencjału najniższychpoziomów decyzyjnych. Władza i odpowiedzialność powinny schodzić do możliwienajniższych szczebli zarządzania.Celem tych wszystkich działań jest zapewnienie trwałości działalnościgospodarczej (gospodarstwa rolnego, przedsiębiorstwa przetwórstwa spożywczego,grupy marketingowej rolników itp.) 20 . Trwałość działalności gospodarczej oznaczamożliwe najdłuższe podtrzymywanie przedsiębiorstwa przy życiu 21 . Trwałośćdziałalności gospodarczej wymaga zatem uwzględnienia wszystkich czynnikówspołecznych, gospodarczych, środowiskowych, etycznych, które bezpośredniowpływają na strategie biznesu. Obejmują one sposoby zatrudniania pracowników,zarządzania ryzykiem, sposoby zaangażowania interesariuszy (konsumentówżywności, władze lokalne, dostawców). W osiąganiu trwałości działalnościgospodarczej chodzi o spójną strategię maksymalizacji wartości wnoszonej przezprzedsiębiorstwo działające przez długi czas, przy jednoczesnej optymalizacjiwyników osiąganych w krótkiej i średniej perspektywie. W strategii tej podstawą jestzachowanie dobrze utrzymanych aktywów (gleba, maszyny, budynki inwentarskiew rolnictwie, linie technologiczne w przemyśle, hale magazynowe, ciągłe myślenieo nowych, innowacyjnych produktach i ich wprowadzanie oraz dobra reputacja wśródklientów, pracowników, dystrybutorów, dostawców, władz lokalnych i innychinteresariuszy przedsiębiorstwa. Te ogólne założenia stwarzają platformę do wyboruszczegółowych opcji strategicznych przez poszczególne przedsiębiorstwa. Zdaniemautora kluczowe dylematy (alternatywy strategiczne) współczesnych przedsiębiorstww agrobiznesie są cztery:• standaryzacja – dyferencjacja,• integracja- indywidualizacja działań,• efektywność ekonomiczna - odpowiedzialność społeczna,• GMO, postęp biologiczny i uprzemysłowienie sektora żywnościowego -naturalne metody produkcji, produkty lokalne regionalne i tradycyjne.Standaryzacja i dyferencjacja są ważnymi, stosowanymi od dawna strategiamiprzedsiębiorstw. Standaryzacja w marketingu oznacza oferowanie konsumentomproduktów po zbliżonych cenach przez jednakowe kanały dystrybucji i wspieraniesprzedaży przez identyczne kampanie promocyjne. Może odnosić się ona zarówno doobsługi odbiorców krajowych jak i sprzedaży na rynkach międzynarodowych.Dyferencjacja jest z kolei strategią różnicowania i dostosowywania działańmarketingowych do specyfiki poszczególnych segmentów rynku. Podstawowymskutkiem stosowania standaryzacji jest obniżenie kosztów. Dyferencjacja powodujenatomiast ich wzrost. Standaryzacja i dyferencjacja mogą odnosić się zarówno doaspektów programu marketingowego jak i procesów marketingowych. Standaryzacjaprogramów obejmować może strategię marketingową i jej główne instrumenty (m.in.produkt, markę, promocję). Standaryzacja procesów może obejmować technologię20 W literaturze wskazuje się, że paradygmat “trwałości” w jednakowym stopniu odnosi się do rolnictwa, jak i doinnych działów gospodarki czy, ogólniej, obszarów działalności ludzkiej (por. E. Majewski: Trwały rozwóji trwałe rolnictwo - teoria a praktyka gospodarstw rolniczych. Wydawnictwo <strong>SGGW</strong>, Warszawa 2008, s. 33.)21 Ph. Kotler J.A. Caslione: Chaos. Zarządzanie I marketing w erze turbulencji. op. cit., s. 177.45
produkcji, system informacyjny, system kadrowy, czy finansowy. Ścieranie się tychdwóch podejść jest widoczne w przedsiębiorstwach sektora żywnościowego. Presja naobniżenie kosztów, wymogi sanitarne i jakościowe powoduje, że gospodarstwa rolnewykazują ścisłą specjalizację, ograniczając ofertę do jednego podstawowego produktu(np. mleko, tuczniki, broilery drobiowe). W produkcji rolniczej wymogi odbiorcówpowodują konieczność standaryzacji produktów żywnościowych. Zapewnienieodpowiednich standardów jakościowych finalnych wyrobów wymaga ujednoliceniatechnologii produkcji i organizacji procesu produkcyjnego. Przedsiębiorstwaprzemysłu spożywczego standaryzują parametry jakościowe wyrobów, zawartośćskładników odżywczych, opakowania jednostkowe. Dostosowują je do wymogówtransportu i sprzedaży detalicznej. Dyferencjacja w działalności przedsiębiorstwagrobiznesu przejawiać się może w dywersyfikacji działalności. Przykładem może byćprowadzenie działalności produkcyjnej, handlowej, usługowej, w rolnictwiedziałalność agroturystyczna, świadczenie usług mechanizacyjnych, czy też działalnośćhandlowa. Przedsiębiorstwa przemysłu spożywczego dywersyfikują działalnośćtworząc koncerny kapitałowe o zróżnicowanej strukturze obsługiwanych segmentówrynku (Maspeks Wadowice). Dyferencjacja w agrobiznesie przejawia sięw różnorodności wykorzystywanych kanałów dystrybucji. Przedsiębiorstwa przemysłuspożywczego wykorzystują trzy podstawowe kanały: tradycyjne- sprzedaż przez siećhurtowni i dystrybutorów oraz drobnych sklepów spożywczych), tzw. nowoczesne –sprzedaż przez sieci handlowe (w tym głównie supermarkety i hipermarkety) orazkanały typu HORECA 22 .Innym obszarem zmienności opcji strategicznych firm agrobiznesu jest przedziałmiędzy samodzielnym prowadzeniem produkcji i sprzedaży wyrobów na otwartych,konkurencyjnych rynkach a wchodzeniem w różne formy powiązań integracyjnych.Specyfika produkcji rolniczej i rynku produktów rolnych zawsze stwarzała presję naprocesy integracyjne w rolnictwie. Wzmocnienie pozycji rynkowej, ograniczenie ryzykarynkowego producentów rolnych jest możliwe przez różne formy powiązańintegracyjnych. Kontrakty produkcyjne, kontrakty dostawne, spółdzielczość rolnicza,grupy marketingowe, to tylko niektóre formy tych działań. Procesy integracyjnewspółcześnie mają miejsce nie tylko w rolnictwie. Koncepcje zarządzania łańcuchemdostaw wskazują, że obniżenie kosztów i poprawa sprawności całego procesudystrybucji może być osiągnięta przez ścisłą współpracę uczestniczących w tym procesiepodmiotów, a więc producentów, firmy transportowe, hurtowników, detalistów.Integracja w agrobiznesie ma wiele innych przejawów. Przykładem mogą być kontraktymiędzy producentami a sieciami handlowymi, wytwarzanie produktów oznaczoną markąsieci detalicznych, tworzenie przez niezależnych dystrybutorów central zakupowych,tworzenie sieci franchisingowych przez podmioty dysponujące znaną marka lubsprawnym procesem produkcji lub sprzedaży.Trzecim dylematem strategicznym przedsiębiorstw agrobiznesu jest sprostaniewymogom rachunku ekonomicznego, efektywności ekonomicznej w połączeniu zespołeczną odpowiedzialnością biznesu. Powstaje oczywiście pytanie czy jest towspółcześnie alternatywa. Czy firmy mogą funkcjonować zwracając uwagę tylko naefektywność ekonomiczną i maksymalizację zysków. Czy mogą trwale funkcjonować22HORECA- hotele, restauracje, catering46
zwracając tylko uwagę na środowisko i problemy społeczeństwa, w którym działają.Wydaje się, że trwały rozwój wymaga uwzględnienia w strategiach obu tych aspektów.Zarówno ekonomii jak i środowiska. Podejmowanie działań nakierowanych społeczniewymaga nakładów finansowych. Wpływa to na efektywność ekonomiczną. Z drugiejjednak strony buduje reputację przedsiębiorstwa i umacnia relacje z interesariuszami.W wielu przypadkach działania prospołeczne i prośrodowiskowe są wymaganeregulacjami prawnym (np. w rolnictwie Kodeks dobrej praktyki rolniczej jako podstawawsparcia finansowego w ramach dopłat bezpośrednich dla rolników). Przedsiębiorstwaw sektorze agrobiznesu zwracają coraz większą uwagę na warunki pracy, sprawyspołeczne i środowisko, upatrując w tym korzyści wizerunkowych, które przekładają sięna efekty sprzedażowe.Generalna tendencja rozwoju agrobiznesu jest procesem uprzemysłowieniaprodukcji żywności. Przechodzenie od naturalnych tradycyjnych metodprzygotowania, przechowywania żywności do metod opartych o technologieprzemysłowe jest zjawiskiem ciągłym. W ostatnich kilku dekadach w proces tenzostały włączone ośrodki naukowe i osiągnięcia biotechnologii. GMO (GeneticallyModified Organism) - organizmy modyfikowane genetycznie – organizmytransgeniczne, to organizmy, które w swoim genomie zawierają geny, pochodzącez obcego organizmu. W przypadku produkcji rolniczej przesłanką modyfikacjigenetycznej roślin uprawnych może być uodpornienie na działanie niekorzystnychwarunków środowiska (mróz, wysoka temperatura, susza, zanieczyszczenieśrodowiska), uodpornienie na choroby powodowane przez grzyby i bakterie, naherbicydy, na owady żerujące na liściach, poprawa parametrów jakościowychi użytkowych roślin (opóźnienie dojrzewania- zwiększenie trwałości). W przypadkuzwierząt chodzi głównie o przyspieszenie wzrostu, zwiększenie wydajności (np.mleka), zwiększenie odporności na choroby. Stosowanie przemysłowych technologiiprodukcji, w tym również postępu w dziedzinie biotechnologii ma na celu przedewszystkim zaspokojenie rosnącego popytu na żywność. Masowa wysokowydajnaprodukcja w rolnictwie i przemyśle spożywczym jest źródłem coraz większej ilościtańszej żywności. Przemysłowe metody produkcji wpływają jednakże na walorysmakowe, czy wartość odżywczą produktów spożywczych. Wiążą się takżez powstawaniem toksycznych związków wywołujących niekorzystne reakcjeimmunologiczne, alergie lub nieznane choroby. Zanieczyszczenia genetyczneżywności przechodzące do następnych generacji skłaniają wielu nabywców doposzukiwania (powrotu) do żywności produkowanej metodami tradycyjnymi,w oparciu o dawne receptury i sposoby konserwowania.PodsumowaniePrzeprowadzona analiza wskazuje na istotne powiązanie koncepcji marketinguw agrobiznesie, ze zmianami środowiska biznesowego. Generale trendy występującew tym obszarze wpływają na konieczność modyfikacji, poszukiwania nowychrozwiązań i roli marketingu w przedsiębiorstwach. Takie czynniki jak postęptechniczny i rewolucja informacyjna, pojawienie się nowych (przełomowych)technologii i innowacji, zmiany związane z wschodzącymi gospodarkami,47
hiperkonkurencja, problemy środowiska naturalnego i społecznego oraz wzrost siłynabywczej klienta stanowią również wyzwania dla działań marketingowychprzedsiębiorstw agrobiznesu.Zapewnienie trwałego funkcjonowania różnych typów przedsiębiorstwagrobiznesu wymaga budowy spójnej strategii marketingowej, przez bardziej aktywne,dynamiczne prowadzenie planowania strategicznego, łączenie w proces podejmowaniadecyzji głównych interesariuszy przez wykorzystanie między innymi interaktywnychkanałów komunikacji i wykorzystanie potencjału najniższych poziomów decyzyjnych.Różnorodność instytucjonalna i podmiotowa agrobiznesu generuje wielealternatywnych opcji strategicznych. Kluczowe dylematy stojące przed firmamisektora żywnościowego w układzie dychotomicznym można podzielić na:standaryzacja – dyferencjacja, integracja - indywidualizacja działań, efektywnośćekonomiczna - odpowiedzialność społeczna, nowoczesne techniki wytwarzania –metody tradycyjne.LiteraturaDla kogo fundusz typu BRIC? http://www.finanse.egospodarka.pl [dostęp 10 czerwca2011 r.]Gadomski W.: Państwa budują fundusze inwestycyjne. http://www.bankier.pl/ [dostęp10 czerwca 2011 r.]http://www.tetrapak.pl [dostęp 10 czerwca 2011 r.]Kall J.: Silna marka. Istota i kreowanie. PWE, Warszawa 2001.Kotler Ph., Caslione J. A.: Chaos. Zarządzanie I marketing w erze turbulencji. MTBIZNES, Warszawa 2009.Kotler Ph., Kartajaya H., Setiawan I.: Marketing 3.0. Dobry produkt? Zadowolonyklient? Spełniony człowiek? MTB BIZNES, Warszawa 2010.Kotler Ph.: Marketing. Wydawnictwo REBIS, Poznań 2005.Majewski E.: Trwały rozwój i trwałe rolnictwo- teoria a praktyka gospodarstwrolniczych. Wydawnictwo <strong>SGGW</strong>, Warszawa 2008.Otto J.: marketing relacji. Koncepcja i stosowanie. Wydawnictwo C.H. Beck. Warszawa2001.Payne A.: Marketing usług. PWE. Warszawa 1997.Przybyłowski K., Hartley S. W., Kerin R. A., Rudelius W.: Marketing. DomWydawniczy ABC, Warszawa 1998.Woś A., Zegar J. S.: Gospodarka żywnościowa. Problemy ekonomiki i sterowania.PWE, Warszawa 1983.Woś A.: Agrobiznes. Makroekonomia. Tom 1. Wydawnictwo KEY TEXT, Warszawa1996.SummaryThe purpose of the article was to determine the effects of changes in economic andbusiness environment for agribusiness companies marketing activities. The paperreviews the main trends in the various spheres of business marketing environment. Also48
presents the impact of these changes on the concepts of marketing. The article presentsthe main options for further diagnosis in the field of agribusiness marketing.Informacja o autorze:dr inż. Jarosław GołębiewskiSzkoła Główna Gospodarstwa WiejskiegoKatedra Polityki Europejskiej, Finansów Publicznych i Marketinguul. Nowoursynowska 16602-787 Warszawajaroslaw_golebiewski@sggw.pl49
5 (54) 2011Ing. Katarína Kleinová, Phd. - Ing. Johana Űrgeová, Phd.COUNTRY IMAGE AND BRANDING OF SLOVAKIAThe paper points at some points of country marketing, for example how European countries couldbe successful in the situation of global competitiveness, not only taking into account their historyor culture but also in the area of product image, such as a country of origin.Country in its own is also a way of a brand. Most countries communicate with the rest of the worldon several levels and so they create their images whether knowingly or randomly. Politicaldecisions of the government, the ways of attracting foreign investors and skilled workforce, exportof products, export of culture, promotion of tourism and ultimately inhabitants themselves ofthe country are also either positively or negatively involved in creating the country image.INTRODUCTIONThe goal of this paper is to show how Slovakia is perceived as a brand. To finding outthe image of Slovakia there were used several methods. First, we analyzed the image ofSlovakia based on our own consumer research and on the other hand we evaluated theperception of the country by the outside world on the basis of selected internationalcoefficients.Branding has become the aspect that is more often related not only to companies andtheir products but also to countries themselves. It concerns mainly developed worldeconomies - it means countries that endeavour to gain international acceptance but alsocountries that are trying to achieve recognization of their brands.COUNTRY MARKETING: REPORT ABOUT GLOBAL BRANDPOSITIONBrand is generally defined by a way of perception and acceptation. Brand imagecharacterizes a complete impression that the brand creates in the minds of customers. Tobuild the image of the country and to achieve the desired state there are sometimesnecessary decades of years. Replacing the generations of people is often needed to do theactual change of the country image. The time must pass that people take a fancy to thecountry, appear and identify themselves with its identity.In order to create reputational capital through economic, political and social promotionof the interests at home and abroad Simon Anholt developed the concept of NationBranding.50
The benefits of branding countries can not be doubted because it:‣ provides a connection between the political, social and economic pillars,‣ defines how the country is perceived by people who live in it and how is perceivedby the world,‣ increases the country’s capacity to achieve its purposes through foreign policy,foreign direct investments, trade, tourism, etc.,‣ creates a trouble free connection between the strategic plan of the country and itsmarketing,‣ provides a unified platform that creates synergy, allowing the reciprocal promotionand alignment between public and private sector.From the foregoing results it can be concluded that the branding of the country hasbecome almost a necessity for survival of the state with its national interests on theworld stage, in the struggle with increasing competition. Effective Nation Branding canpositively contribute to the brand and the image of the country, respectively towards itsgoals with regard to attracting tourists, stimulating investments, increasing export,attracting talent, qualified labour force and students. It also helps to erase mistaken ideasand stereotypes about the country and allows favourably repositioning considering to thetarget audience. [1]COUNTRY IMAGE AS A PRODUCT COUNTRY OF ORIGINAs the image or reputation of the country has longstanding character in contrast to therapidly changing reality, so one of the main reasons why countries decide for NationBranding is that the image no longer corresponds to reality, is outdated and no longercan support economic, political, whether developing goals of country or the preventionfrom this delaying of image. This is possible to achieve with strategic approach to thebrand management of the country. Creating exceptional, aspiration, and motivatingbrand strategy of the country is one of the fundamental assumptions of its future successand competitive advantage.In one public opinion poll Slovak people labelled their country as agricultural, corrupt,romantic and folklore. According to Marián Timoracký, who spokes about the strengthsand weaknesses of the brand Slovakia, first of all there should exist integrated and clearvision of what this country wants to mean, simply what it wants to be. Unfortunately fornow there is no such material in Slovakia. Someway a number of institutions,representative offices abroad, ministries, and government, businesses and interestassociations are trying to promote Slovakia. But there is no common concept, no onecoordinates it and it is fragmented.In the long run, the country image is building for a long time. Small and newlyestablished countries such as Slovakia are unknown for the people in the world. Froma global perspective they are all uninteresting countries. So, if we want to be superior toother countries, it is important that we should try to have a good, attractive agenda thatwill take our country more attractive.51
Why is it important to have a good image? Just the image, reputation of the country, hasa significant impact on the development of tourism, flow of the foreign investments andeven export of our products. Today, when the competition between countries is moresharpen, an investor is considering all the pros and cons. [2]Slovak products are, as for exceptions, absolutely unknown in the world. That is theresult of the survey organized by HN between sixteen Commercial Counselors at theSlovak Embassies. Many people argue that Slovakia does not have any image in thesecountries. Majority of our agents has experience that to this day there still remainsa good sound of “Made in Czechoslovakia” and the image of former products is stillpresent. But while the Czechs are trying to move up with current products such assuccession brands of Czechoslovakia, we are up to fail. We and the quality of our workare very well known in Russia, Belarus, Serbia, Romania and Bulgaria. Somewhere onthe halfway of knowledge about us remain the countries of The Baltic Sea. We areobtaining the popularity of our products also in Austria or Germany.In Austria the image of Slovakia prevails as a country suitable for tourism, spa vacation,visitation of opera or the utilization of gastronomy. Slovakia is there generally known asa country producing cars and building on longstanding tradition of engineeringproduction. In Norway, we are well known with the name of Slovakia, especially amongthe businessmen. According to them, Slovak workers are more responsible than thosefrom other V4 countries. This creates a good image for our products. But ordinaryNorwegians are still confusing Slovakia and Slovenia or persist also good image ofCzechoslovakia. In Germany, we are also perceived relatively well, especially afterjoining the EU and after overcoming of prejudices and raising the level ofinformation. Greeks know practically nothing about Slovakia. In Ireland, Slovakia isadopted with the early embarrassment, but many Irish companies have great experiencewith us. In Belarus, the Slovak production is perceived as highlycompetitive. Belarusians associate Slovakia in many aspects with Czechoslovakia. InRomania, Slovakia is seen very positively and Romanian entrepreneurs often welcomeour partners rather than from traditional western markets. The reason is good quality andwide range of our products and services. In Bulgaria we are perceived as a progressivecountry with higher incomes and thus higher living standard. There still persists theimage of quality of Czechoslovak products which has a positive impact on the image ofSlovak products. In Estonia, Latvia and Lithuania we are known as a country with goodskiing and cheap meal. [3]SLOVAK POSITION IN THE COUNTRY BRAND INDEXHow to evaluate the image of a country? Which brand does Slovakia have now? Thereare used two approaches in the world. One of them is the Country Brand Index which iscalculated based on the strengths of the country brand and the second is the NationBrand Index which is based on a survey of fifty selected world countries. But there arealso other scales which evaluate the country image. In recent years the East-Westranking was started to publish which is based on the number of reports of about 200world countries, including Slovakia.52
Anholt developed the Nation Brands Index (NBI) in 2005 as a way to measure the imageand reputation of the world’s nations. This powerful tool can help to understand measureand build a strong national image. The Anholt Nation Brands Index measures the powerand quality of each country’s brand image by combining the following six dimensions:‣ Export – determines the public’s image of products and services from eachcountry and the extent to which consumers seek or avoid products from thecountry.‣ Governance – measures public opinion regarding the level of nationalgovernment competency and fairness.‣ Culture and heritage – reveals global perceptions of each nation’s heritage andappreciation for its contemporary culture, including film, music, art, sport andliterature.‣ People – measures the population’s reputation for competence, education,openness and friendliness, as well as perceived levels of potential hostility anddiscrimination.‣ Tourism – captures the level of interest in visiting a country and the draw ofnatural and man-made tourist attractions.‣ Investment and immigration – determines the power to attract people to live,work or study in each country and reveals how people perceive a country’seconomic and social situation.Each country’s score across these six dimensions is succinctly captured in the NationBrand Hexagon. [1]Scheme 1 The Nation Brand HexagonSource: www.gfkamerica.comThe 2010 Nation Brands Index survey was conducted from July 7, 2010 to August 4,2010 in 20 major developed and developing countries that play important and diverse53
oles in international relations, trade, and the flow of business, cultural, and tourismactivities. The survey results are based on respondents’ ratings of 50 nations onquestions in six mentioned categories. The Nation Brands Index 2010 overall results areas follows: United States, Germany, France, United Kingdom, Japan, Canada, Italy,Switzerland, Australia, Sweden. [1]East West Nation Brand Perception Indexes rank all countries and territories based onhow they are perceived in leading international media, published quarterly and annually.The indexes are based on analyzing millions of mentions in hundreds of thousands ofnews articles. The East West Global Index 200 ranks all 192 UN members and 8 majorterritories. The index analyses also if the country was mentioned in positive or negativeway during the period. The results of Top 10 countries are shown in the following table.The most mentioned country in 2010 was the United States (4 180 999 mentions).Slovakia gained rank 83 with 13 643 mentions. [4]Table 1 East West Global Index 200TOP 10 2009 TOP 10 20101. United States 1. United States2. United Kingdom 2. United Kingdom3. India 3. India4. China 4. Australia5. France 5. China6. Canada 6. Israel7. Israel 7. France8. Ireland 8. Canada9. Japan 9. Japan10. Russia 10. GermanySource: www.eastwestcoms.com/global_volume.htmThe next index is FutureBrand Country Brand Index, which is presented in partnershipwith BBC World News. It is based on more respondents across more countries andquestions than ever before. Country brand strength is driven by perceptions of five keydimensions: Tourism, Heritage and Culture, Good for Business, Quality of Life andValue System. In addition, the strength of a country brand is determined in the same wayas any other brand. It measured levels of awareness, familiarity, preference,consideration, advocacy and active decisions to visit. But the most important factors, theaspects that truly differentiate a country brand, are its associations and attributes – thethings that people think of when they hear a place name, or look at a photograph or plana trip. [5]Year 2010 was Canada’s year. Rising from second to first place, brand Canada displacedthe USA. Other results of this index are shown in the next table.54
Table 2 Country Brand Index - TOP 20 Country Brands in 20101. Canada 11. Germany2. Australia 12. Italy3. New Zealand 13. Norway4. United States 14. Spain5. Switzerland 15. Singapore6. Japan 16. Maldives7. France 17. Ireland8. Finland 18. Bermuda9. United Kingdom 19. Denmark10. Sweden 20. AustriaSource: FutureBrandSlovakia was in year 2010 on the place 79 from 111 examined countries. In comparisonwith other V4 countries, Slovakia was on the third place after Czech Republic andHungary. [6]Table 3 Country Brand Index – Comparison of V4 countriesSlovakia Czech Poland HungaryRepublicHeritage and 83 18 62 50cultureConditions for 47 39 38 59businessTourism 79 55 80 83Quality of life 55 41 50 62Value system 47 34 43 59Country total 79 43 82 66Source: FutureBrandSLOVAK POSITION: IMAGE OF SLOVAKIA AS THE FOODPRODUCT COUNTRY OF ORIGINIn the comparison with Anholt Brand Index there was performed the research, targetedinto consumer behaviour and perception’s point of view on image of Slovakia. Thesecondary data was achieved by a questionnaire addressed to 978 Slovak respondents(378 from villages and 600 from cities) in all age, sex, salary and education segments.The research was realized during three years 2008–2010.Many Slovaks mean that Slovakia is abroad replaced by Bohemia or Slovenia. On thescheme 2 it can be seen, that 55% Slovaks have this point of view.55
Scheme 2 Do you think that the inhabitants of Europe know some basicinformation about Slovakia?Source: Own researchCountry branding means much more than adding a "Made In" label to a product.A product's country of origin constitutes an important piece of branding that, in manycases, can be so influential that it overtakes the brand's other reputation builders. If I toldyou that the next supercar came from Germany, you probably wouldn't be surprised. Youwould probably be immediately curious about it, expecting the fictional vehicle to be ofsuperb engineering and design quality, expensive and solid. Now imagine I will surpriseyou by revealing that the forthcoming supercar is actually a product of Greece. Yourimpression of the car will be totally different, your assumptions inspired by the apparentpersonality the country of origin communicates to your perceptions. Having the wrongcountry label on your package won't destroy your brand, but I'm convinced that havingthe right "Made in" label will save you a substantial amount of marketing money.Rome wasn't built in a day. I'm sure we'll get there. The question is how long can weafford to wait? The rewards can be enormous. The next scheme 3 shows, that 87% ofrespondents think, that Slovak product aren’t well-know abroad. That could be true,because if you find some Slovak product in the supermarket you can read on theopposite site of packing Made in EU not Made in Slovakia - that’s the marketing stage ofSlovak producers, how to be success on foreign markets.Scheme 3 Do the foreign tourists know Slovak products?Source: Own research56
On scheme 4 we can see the position of the Slovak respondents on how the country ispromoted abroad. 47% of Slovaks believe that Slovakia has a lack of publicity ininternational media. Up to 35% of Slovaks were unable to assess their views on thisissue. Mainly because of the fact the Slovaks are mostly simple people, which areincomparable with the tourist experiences of other citizens of the world. Therefore theydo not know whether Slovak products are on store shelves in stores, whether is anyagency in any major city and offers "last minute" to Slovakia, or sold in bookstoresbooks about the country, whether or not students learn the geography and that Slovakiais also part of Europe. Slovaks awareness is reflected in their opinion that their country isnot offered in travel agencies, as a tourist destination and also that there is a lack ofpromotion of Slovak cultural products. Just a lot of Slovaks describe its attributes as anagricultural country, corrupt or romantic folklore.Scheme 4 Do you think that Slovakia is enough promoted abroad?CONCLUSIONSource: Own researchFrom a marketing perspective, country of origin is a way to differentiate the productfrom the competitors. The country of origin has an impact on consumers' qualityperceptions of a product, as well as ultimately preference for and willingness to buy thatproduct. Furthermore, several studies have shown that consumers tend to have a relativepreference to products from their own country or may have a relative preference for oraversion against products that originate from certain countries (so-called affinity andanimosity countries). The effect of country of origin is however debated with somestudies questioning the relevance of academic research on country of origin effects forbusiness managers. Overall, academics seem to conclude that the country with whicha product is associated with, the so called country-of-association significantly impactsconsumers' product evaluations and choice.57
REFERENCES[1] GfK USA. 2011. The Anholt-GfK Roper Nation Brands Index. online. [cit.2011-03-25].[2] LUČAIOVÁ, Anka. Made in Slovakia. 2010. [cit. 2011-02-20] Available:[3] Hnonline.sk. 2011. Slovenské značky majú v zahraničí určite šancu. [cit.2011-02-20] Available: [4] East West Communication. 2011. East West Global Index 200. [cit. 2011-02-20] Available: [5] FutureBrand.2010. [cit.2011-02-20] Available:[6] DZUREKOVÁ, Mária. 2011. Top/down medzi krajinami. In Strategie, č.1,2011, s. 23SUMMARYThe article is result of many author’s point of view and own research, which could showhow is the country marketing important not only for domestic economy or life style butalso for business, cultural and general presentation’s options on the global market.Slovakia isn’t well known in the comparison with Canada, USA or Switzerland. ImagineFrance without fashion, Germany without automotive excellence or Japan withoutconsumer electronics. There’s no arguing that the image we have of another country saysa lot about how we view it as a tourist destination, a place to invest or source ofconsumer goods. Slovakia has a long way to be in the group of Anholt Brand Index andso we need strong well known possibilities and marketing strategies to be successful andperceived by positive meaning of world - people.CONTACT ADDRESSIng. Katarína Kleinová, Phd., Ing. Johana Űrgeová, Phd.johana.urgeova@fem.uniag.sk, katarina.kleinova@fem.uniag.skDepartment of MarketingFaculty of Economics and ManagementSlovak University of AgricultureTrieda A. Hlinku 2, 949 76 Nitra, Slovak Republic58
5 (54) 2011Sylwester KozakZmiany struktury kanałów dystrybucji a poprawawarunków konkurencji w sektorze ubezpieczeń w Polscew latach 2002-2009Changes of distribution channels and improvementsof the competition conditions in the insurance sector in Polandfor the period 2002-2009Integracja z systemem finansowym Unii Europejskiej była źródłem istotnych zmian wpolskim sektorze ubezpieczeń. Okres lat 2002-2009 charakteryzował się wzrostem inwestycjizagranicznego kapitału oraz zwiększeniem konkurencji ze strony zakładów krajowychi zagranicznych. Jedną z istotniejszych konsekwencji tego procesu było rozszerzenie asortymentuo nowe usługi oraz zmiana struktury kanałów dystrybucji ubezpieczeń. Celem badań jest analizazmian w strukturze produktów ubezpieczeniowych oraz struktury kanałów ich dystrybucji w latach2002-2009. Badania przeprowadzono na podstawie danych o zakładach ubezpieczeń, jakiepublikuje Komisja Nadzoru Finansowego (KNF) i Polska Izba Ubezpieczeń (PIU). Wyniki analizywskazują, że wraz ze zwiększeniem zaangażowania kapitału zagranicznego w sektorze orazpoprawą sytuacji gospodarczej po integracji Polski z UE wzrosło znaczenia grupy średnichzakładów i spadł poziom koncentracji rynku. Zakłady zmieniły strukturę produktów częściejoferując polisy ubezpieczeń na życie jako instrument inwestycji oszczędności oraz zmniejszającudział ubezpieczeń komunikacyjnych na korzyść ubezpieczeń finansowego i majątkowych.Ubezpieczyciele przebudowali strukturę kanałów dystrybucji zwiększając istotnie sprzedażproduktów ubezpieczeniowych przez sieć placówek bankowych, doprowadzając do silnejdywersyfikacji form sprzedaży ubezpieczeń w Polsce. Wzrastającym kanałem dystrybucji, choćnadal o niewielkich rozmiarach, stała się sprzedaż przez Internet i telefon.WstępW latach 2002-2009 sektor ubezpieczeń w Polsce podlegał istotnejrestrukturyzacji. W początkowym okresie zmiany w dużej mierze wynikałyz konieczności przystosowania się zakładów ubezpieczeń do wypełnienia wymogówtechnicznych i organizacyjnych stawianych przez regulacje obowiązujące w sektorzeubezpieczeń Unii Europejskiej. Dodatkowo na działalność i wyniki sektora istotnywpływ wywarło zwiększone zaangażowanie kapitałowe zagranicznych ubezpieczycielii wzrost udziału w rynku kontrolowanych przez nich zakładów.Druga część analizowanego okresu to proces integracji z europejskim sektoremubezpieczeń. Eliminacja barier w transferze kapitału inwestycyjnego z innych obszarówUE, wzrost konkurencji i konieczność rozszerzenia asortymentu o nowe usługi, a także59
potrzeba przetrwanie skutków globalnego kryzysu finansowego to ważniejsze czynnikikształtujące stan sektora ubezpieczeń w Polsce po 2004 r.Dla sposobu funkcjonowania sektora ubezpieczeń, a także tworzących gozakładów jedną z ważniejszych kwestii jest sposób organizacji rynku oraz strukturakanałów dystrybucji produktów ubezpieczeniowych. W Polsce, podobnie jak w innychpaństwach Europy Środkowo-Wschodniej do końca lat 1990. sektor ubezpieczeńpozostawał silnie skoncentrowany 1 . Ze względu na oczekiwane wejście do UniiEuropejskiej, na początku lat 2000. zakłady uzyskały nie tylko teoretyczną, alei praktyczną możliwość pozyskiwania większej kwoty kapitału zagranicznego. Wynikałoto ze zwiększonego zainteresowania zachodnioeuropejskich ubezpieczycieli wejściem napolski rynek, który dawał perspektywę szybkiego rozwoju i uzyskania wyższych stópzwrotu z inwestycji niż w ich państwach macierzystych.W konsekwencji wzrosło znaczenie grupy średnich zakładówo większościowym kapitale zagranicznym. Doprowadziło to do obniżenia koncentracjirynku ubezpieczeń i poprawy warunków konkurencji. Wyższa konkurencja, już nie tylkoze strony krajowych, ale i zagranicznych ubezpieczycieli stała się podstawą doposzukiwania optymalnej struktury kanałów dystrybucji produktów ubezpieczeniowych.Dla utrzymania dogodnej pozycji na rynku zakłady wykorzystywały wieloletniedoświadczenie zagranicznych ubezpieczycieli i skierowały swoją ofertę do klientówpoprzez placówki bankowe, a także wdrożyły nowoczesne technologie umożliwiającebezpośrednią sprzedaż polis przy użyciu Internetu i telefonu.Celem artykułu jest zaprezentowanie zmian produktowej i organizacyjnejstruktury rynku ubezpieczeń oraz zmian struktury kanałów dystrybucji produktówubezpieczeniowych, jakie zaszły w Polsce w latach 2002-2009. Przeprowadzona analizabazuje na danych z zakładów ubezpieczeń publikowanych przez Komisję NadzoruFinansowego (KNF) i Polską Izbę Ubezpieczeń (PIU). Jej wyniki wskazują, że wrazz obniżaniem się koncentracji rynku i poprawą warunków konkurencji zakładyw znacznym stopniu wykorzystywały system bancassurance oraz Internet do sprzedażyubezpieczeń działu I i działu II. W przypadku ubezpieczeń na życie, w drugiej połowiedekady lat 2000. placówki bankowe stały się jednym z podstawowych kanałówdystrybucji, wspólnie ze sprzedażą własną i przy pomocy agentów prywatnych.W przypadku ubezpieczeń działu II sieć bankowa i Internet istotnie zwiększyły sweznaczenie w systemie sprzedaży, stając się ważnymi, choć nie podstawowymi kanałamidystrybucji. Agenci indywidualni i instytucjonalni oraz pracownicy zakładów pozostalinadal głównymi dystrybutorami polis ubezpieczeniowych.Pozostała część artykułu zorganizowana jest w następujący sposób. Pierwszyrozdział przedstawia strukturę sektora i rozmiary jego działania oraz formy sprzedażyoferowanych przez niego produktów ochrony ubezpieczeniowej. Kolejny analizujekanały dystrybucji stosowane w sprzedaży ubezpieczeń działu I i II, a następny skalęwykorzystania podstawowych kanałów dystrybucji w całym sektorze ubezpieczeń.Całość podsumowano we wnioskach.1 Zgodnie z danymi CEA w 1996 r. w krajach Europy Środkowo-Wschodniej, tj. Czechy, Polska, Słowacja,Słowenia, Węgry wskaźnik udziału w rynku pięciu największych zakładów znacznie przekraczał 90%,zarówno w sektorze ubezpieczeń na życie, jak i nie na życie; zob. CEA, European Insurance in Figures, CEAStatistics no. 36, October 2008.60
Struktura i wyniki działalności sektora ubezpieczeń w PolscePoprawiająca się sytuacja gospodarcza w Polsce stwarzała korzystne warunkido rozwoju sektora ubezpieczeń. Począwszy od II połowy 2003 r. zarówno produktkrajowy brutto, jak i średnie płace zwiększały swoje wartości podnosząc popyt naubezpieczenia działu I i działu II (rys. 1). Poprawa koniunktury gospodarczej najsilniejzaznaczyła się w wynikach działu I. Gospodarstwa domowe lokowały wzrastająceoszczędności w polisach na życie (grupa 1), a w okresie silnych wzrostów cen nagiełdzie papierów wartościowych w latach 2006-2007, w polisach na życie i dożyciez ubezpieczeniowym funduszem kapitałowym. W efekcie, pomiędzy 2002 r. a 2008 r.składka przypisana brutto w dziale I wzrosła niemal czterokrotnie. Lepsze wynikiprzedsiębiorstw, wzrost importu samochodów w pierwszych latach integracji Polskiz UE pozwoliły również zakładom ubezpieczeń działu II na istotne podniesieniewartości składki przypisanej brutto.Rysunek 1. Składka przypisana brutto ubezpieczeń działu I i II oraz składka sektora w odniesieniu do PKB(lewy panel) i składka działu I i II per capita (prawy panel)Źródło: GUS, KNF.Czynnikiem wzmacniającym popyt na produkty ubezpieczeniowe byłoprzystąpienie Polski do UE w 2004 r. Konsekwencją eliminacji barier w transferze dóbri kapitału, a także włączenia polskiego sektora finansowego do jednolitego rynkufinansowego było zwiększenie inwestycji zagranicznych w sektorze realnym i sektorzefinansowym oraz poprawa koniunktury gospodarczej. W przypadku sektora ubezpieczeńzagraniczni inwestorzy dokapitalizowali kontrolowane dotychczas zakłady, a takżetworzyli nowe podmioty (rys. 2). Wzrost ich udziału w rynku doprowadził do osłabieniadominacji największych podmiotów, zarówno w dziale I, jak i dziale II. Ich udziałw rynku spadł z około 50% do poziomu, odpowiednio, 32% i 38%. Takie przemianymiały korzystne znaczenie dla warunków konkurencji na rynku ubezpieczeń. Wskaźnikikoncentracji pięciu największych zakładów obniżając się w 2009 r. do poziomów 65%(dział I) i 70% (dział II) zbliżyły się do wartości średnich dla całej Unii Europejskiejwynoszących około 56%.61
Rysunek 2. Liczba zakładów ubezpieczeń i udział rynkowy zakładów kontrolowanych przez inwestorówzagranicznych (lewy panel) oraz poziom koncentracji sektora ubezpieczeń (prawy panel)Źródło: KNF, PIU.Zwiększona konkurencja ze strony zakładów o większościowym kapitalezagranicznym, poprawiająca się koniunktura gospodarcza i ogólny rozwój sektoraubezpieczeń przyczyniły się do zmiany jego struktury produktowej. W dziale I, zarównoprzed, jak i po wejściu do UE, dominującymi produktami pozostały ubezpieczenia nażycie i dożycie (grupa 1) (rys. 3). W większości przypadków pełniły one funkcjęinstrumentów inwestycyjnych, a w latach 2008-2009, sprzedawane przez banki w formiepoliso-lokat, stały się substytutem krótkoterminowych lokat bankowych. Drugimproduktem, pod względem udziału w rynku, stały się ubezpieczenia na życiez ubezpieczeniowym funduszem kapitałowym. Jednak wielkość składki przypisanejbrutto ubezpieczeń z grupy 3 nie była stabilna. Silnie zwiększała się w okresie wzrostówindeksów giełdowych, ale i w jeszcze szybszym tempie malała w okresach spadającychcen akcji. Znacznie mniejszy wpływ na pozyskiwanie składki działu I miałyubezpieczenia wypadkowe i chorobowe, a ich udział utrzymywał się na średnimpoziomie około 15%. Pozostałe produkty działu I nie miały istotnego znaczenia dladziałalności zakładów.Dla wyników finansowych zakładów, a także dla organizacji dystrybucjiproduktów działu I, ważnym okazał się sposób zawierania umowy ubezpieczenia.Wielkości pozyskanej składki przy pomocy umów grupowych i indywidualnych przezwiele lat utrzymywały się na zbliżonym poziomie. Jednak w ostatnich dwóch latach,charakteryzujących się silnym wzrostem składki, szczególnie pozyskiwanej w systemiebancassurance, zaznaczyła się wyraźna przewaga umów grupowych. Ich udział w 2008r. dochodził do poziomu 58% (rys. 3). W wielu wypadkach ubezpieczenia grupowewykorzystywały przedsiębiorstwa włączając je do systemu wynagradzaniapracowników, jako element motywacji.W składce przypisanej brutto w dziale II przeważająca część pochodziz ubezpieczeń komunikacyjnych (grupy: 3 i 10) (rys. 4). Początkowy wzrost popytu nate produkty wynikał ze zwiększonego importu samochodów z krajów Europy Zachodniej62
w pierwszych latach po wejściu Polski do UE 2 . Jednak w kolejnych latach ich udziałsystematycznie się obniżał. Drugim pod względem wielkości źródłem składkiprzypisanej brutto w dziale II są ubezpieczenia majątkowe (grupa 8 i grupa 9). Ich udziałniemal przez cały okres utrzymywał się na poziomie zbliżonym do 18%. Duża wartośćskładki była wynikiem m.in. z rosnących cen ubezpieczanych nieruchomości.Rysunek 3. Struktura produktowa składki przypisanej brutto w dziale I oraz struktura pod względem formyzawierania umowy ubezpieczeniaŹródło: KNF, PIU.Rysunek 4. Struktura produktowa składki przypisanej brutto w dziale IIŹródło: KNF, NBP.2 KNUiFE, Rynek Ubezpieczeń 2005, Komisja Nadzoru Ubezpieczeń i Funduszy Emerytalnych, Warszawa2006.63
Wzrastający udział w rynku stanowiły ubezpieczenia finansowe (grupa 14-16).Składka pozyskana przez te ubezpieczenia na koniec 2009 r. stanowiła 8,1%, podczasgdy w 2002 r. tylko 3,4%. Umowy ubezpieczenia ryzyka finansowego stały się częstostosowaną formą zabezpieczenia kredytów bankowych. Wzrost sumy udzielanych przezbanki kredytów mieszkaniowych i konsumpcyjnych pozwala ubezpieczycielom nasprzedaż nowych polis. Ubezpieczenia osobowe to kolejna grupa ubezpieczeńo znacznie szybciej wzrastającej składce niż ubezpieczenia komunikacyjne. Wzrostskładki z tytułu zawarcia tego rodzaju ubezpieczeń również miał istotny związekz działalnością kredytową banków. Stosowały je bowiem zamiennie zamiast prowizji odudzielanego kredytu, a także jako jego dodatkowe zabezpieczenie w przypadkunieszczęśliwego wypadku lub choroby kredytobiorcy, uniemożliwiającej muzarobkowanie. Wartość składki przypisanej brutto dla ubezpieczeń z grup 1 i 2 wyraźniewzrosła w 2008 r. w okresie nasilenia przez banki akcji kredytowej. Zahamowanietempa wzrostu sumy kredytów mieszkaniowych w 2009 r. przyczyniło się donieznacznego obniżenia udziału tych ubezpieczeń w rynku.Zmiana struktury kanałów dystrybucji ubezpieczeń działów: I i IIWzrost zaangażowania zagranicznych inwestorów w sektorze ubezpieczeń miałistotny wpływ na udoskonalenie metod zarządzania zakładami oraz podniesieniatechnologicznego poziomu ich wyposażenia. Nowoczesne technologie umożliwiłyubezpieczycielom zmianę organizacji sprzedaży produktów ubezpieczeniowych. Zmianyte miały również związek z poprawą koniunktury gospodarczej. Wzrost popytu naprodukty finansowe, zarówno pożyczkowe, jak i lokacyjne zmienił strukturę i lokalizacjęsprzedaży produktów ubezpieczeniowych. Coraz częściej popyt na ochronęubezpieczeniową zaspakajany był w placówkach banków lub innych instytucjifinansowych. Innymi miejscami zawierania umów ubezpieczenia były zakłady pracy,gdzie pracodawcy wykorzystywali je jako dodatkowe wynagrodzenie i podniesieniejakości warunków pracy.Czynniki te wywierały wpływ na strategię sprzedaży zakładów ubezpieczeń.Indywidualne umowy ubezpieczenia działu I w coraz mniejszym stopniu zawierano zapośrednictwem indywidualnego agenta (rys. 5). Z niemal dwukrotnego spadku udziałutego kanału dystrybucji najbardziej skorzystały banki i zakłady ubezpieczeń, które przezsieć swoich placówek pozyskali ponad połowę składki przypisanej brutto z tytułuindywidualnych ubezpieczeń działu I. Silny wzrost udziału sprzedaży w systemiebancassurance w 2008 r. świadczy o dużym znaczeniu tego kanału w dystrybucjiindywidualnych polis na życie i dożycie mających charakter lokacyjny, tzw. polisolokat.Spadek udziału agentów indywidualnych w rynku wynikał m.in. ze wzrostuświadomości ekonomicznej społeczeństwa oraz powszechnej dostępności do informacjio ofertach ubezpieczeniowych przez strony internetowe i infolinie.64
Rysunek 5. Struktura kanałów dystrybucji ubezpieczeń działu I dla polis indywidualnych (lewy panel) i polisgrupowych (prawy panel)Źródło: KNF, PIU.W dystrybucji grupowych ubezpieczeń działu I w latach 2002-2009 największeznaczenie miała sieć placówek bankowych i sieć własnych placówek zakładuubezpieczeń. Podobnie jak w przypadku dystrybucji polis indywidualnych w 2002 r.bancassurance było praktycznie niestosowaną metodą sprzedaży. Największy wzrostznaczenia tego kanału dystrybucji nastąpił w okresie poprawiającej się koniunkturygospodarczej, wzrostu zamożności gospodarstw domowych i wzrostu działalnościkredytowej banków. Pozostałe kanały dystrybucji polis grupowych, m.in. brokerski, niemiały już tak istotnego znaczenia w działalności zakładów ubezpieczeń działu I.W sektorze ubezpieczeń działu II, przez cały okres lat 2002-2009,najważniejszym kanałem dystrybucji byli agenci indywidualni. Wartość pozyskiwanejprzez nich składki wzrosła szczególnie w latach 2005-2007. Można to wiązać zezwiększonym importem samochodów do Polski. Działalność agentów indywidualnychjest najczęściej kojarzona ze sprzedażą polis ubezpieczeń komunikacyjnych, stądwahania na rynku samochodowym znajdowały swoje odbicie w ich wynikach sprzedaży.Sprzedaż własna zakładów ubezpieczeń była drugim pod względem udziału wrynku kanałem dystrybucji. Jej znaczenie systematycznie spadało, przede wszystkim, narzecz sprzedaży przez agentów indywidualnych. Jednak w najbliższych latach należyoczekiwać poprawy ich wyników ze względu na stały, choć jeszcze niewielki, wzrostsprzedaży bezpośredniej przy użyciu Internetu i telefonu. Wielkość pozyskanej składkiprzypisanej brutto działu II poprzez ten nowoczesny kanał dystrybucji wzrosła z 93 mlnzł w 2004 r. do 316 mln zł w 2008 r. 3Kolejnym wzrostowym kanałem dystrybucji produktów ubezpieczeniowychdziału II w latach 2002-2009 stała się sprzedaż w placówkach banków i innych instytucjifinansowych, m.in. SKOK 4 -ów. Na początku pierwszej dekady lat 2000. systembancassurance w dystrybucji ubezpieczeń działu II był praktycznie niezauważalny.3 Dane z raportów rocznych PIU za lata 2005-2009.4 SKOK (spółdzielcza kasa oszczędnościowo-kredytowa) instytucję finansowa działającą na podstawie ustawyz dnia 14 grudnia 1995 r. o spółdzielczych kasach oszczędnościowo-kredytowych. (Dz. U. z dnia 4 stycznia1996 r.).65
W 2002 r. poprzez placówki bankowe pozyskano składkę o wartości 28 mln zł, podczasgdy w 2009 r. już 1,3 mld zł. Bancassurance zawdzięcza swój rozwój główniezwiększonej akcji kredytowej banków, notowanej po integracji Polski z rynkiemeuropejskim. Banki często dołączały różnego ubezpieczenia do pakietów podstawowychusług bankowych, m.in. rachunku bankowego, karty płatniczej, kredytumieszkaniowego, samochodowego czy pożyczki gotówkowej. Rodzaj tych ubezpieczeńzależał od produktu bankowego, a do najczęstszych należały ubezpieczenia osobowe,majątkowe, komunikacyjne, finansowe i odpowiedzialności cywilnej.Rys. 6. Struktura kanałów dystrybucji ubezpieczeń działu IIŹródło: KNF, PIU.W analizowanym okresie ważnym kanałem dystrybucji ubezpieczeń działu IIpozostawali również agenci-osoby prawne, którymi są m.in. dealerzy samochodówi placówki opieki medycznej. Wielkość sprzedaży polis przez dealerów w dużej mierzejest pochodną stanu rynku samochodowego, gdyż w największym stopniu oferują oniubezpieczenia ryzyka komunikacyjnego. Z kolei rola placówek opieki medycznejw dystrybucji ubezpieczeń wynika ze wzrostu zainteresowania społeczeństwadodatkowymi ubezpieczeniami opieki medycznej, m.in. medyczne assistance. Nastałym, bo około 15-procentowym poziomie utrzymywał się udział kanału brokerskiego,którego zasadniczą częścią są brokerzy-osoby prawne.Ewolucja kanałów dystrybucji produktów ubezpieczeniowychZapoczątkowana w II połowie 2003 r. poprawa koniunktury gospodarczej,a także wzrost zamożności gospodarstw domowych i podniesienie ich świadomościekonomicznej stały się czynnikami kształtującymi strukturę kanałów dystrybucjiproduktów ubezpieczeniowych. Istotną rolę odegrał w tym względzie rozwój sektorabankowego i rynków finansowych. Na początku dekady lat 2000. Produktyubezpieczeniowe sprzedawali głównie agenci indywidualni i pracownicy zakładów66
ubezpieczeń (rys. 7). Taka struktura utrzymywała się niemal do początków integracjigospodarczej i finansowej Polski z UE. W dalszym okresie wzrost gospodarczy, importdużej liczby samochodów, a także wzrost akcji kredytowej banków przyczyniły się dozwiększenia sprzedaży przez placówki bankowe i agentów-osoby prawne.Rysunek 7. Ewolucja indywidualnych kanałów dystrybucji produktów ubezpieczeniowych w latach 2002-2009Źródło: KNF, PIU.Analizując przebieg rozwoju indywidualnych metod sprzedaży produktówubezpieczeniowych należy rozpocząć od sprzedaży własnej zakładów, która pomimorosnącej konkurencji ze strony innych podmiotów, stała się największym, pod względempozyskanej składki, kanałem dystrybucji produktów ubezpieczeniowych. Przez placówkizakładów, a także pracowników oddelegowanych do pracy w innych przedsiębiorstwachzakłady najczęściej sprzedawały ubezpieczenia działu II oraz grupowe polisyubezpieczeń działu I. Największe wartości sprzedaży w placówkach własnych zakładówzanotowano w latach 2007-2009. Do dalszej poprawy wyników tego kanału dystrybucjimoże przyczynić się rosnąca, choć nadal bardzo niska, popularność sprzedażybezpośredniej za pośrednictwem Internetu i telefonu.Drugi pod względem wielkości sprzedaży kanał dystrybucji w latach 2002-2009tworzyli agenci indywidualni. Obszarem ich największej aktywności były ubezpieczeniadziału II. Wzrost sprzedaży przez ten kanał dystrybucji w latach 2004-2007 możnawiązać ze wzrostem importu i sprzedaży samochodów. W sektorze ubezpieczeń działu Iagenci indywidualni stracili nieznacznie swój udział na rzecz banków i instytucjifinansowych. Dodatkowo wzrost sprzedaży przy użyciu Internetu i telefonu pozwalaoczekiwać dalszego spadku sprzedaży polis przez agentów indywidualnych.Kanałem dystrybucji produktów ubezpieczeniowych, który najsilniej rozwinąłsię w pierwszej dekadzie lat 2000. była sprzedaż przez placówki banków i instytucjifinansowych. W największym stopniu wynika to ze wzrostu sprzedaży ubezpieczeńdziału I, zarówno grupowych jak i indywidualnych. Uczestnictwo największych polskichbanków w konglomeratach finansowych o kapitale założycielskim z Belgii, Hiszpanii,67
Portugalii, czy Włoch, gdzie udział systemu bancassurance w sprzedaży ubezpieczeń nażycie przekracza 50%, a w przypadku Portugalii wynosi 82% 5 , pozwala oczekiwać, żebanki-córki w Polsce będą jeszcze bardziej niż dotychczas wykorzystywały ten kanałdystrybucji. W przypadku ubezpieczeń działu II, pomimo dynamicznego przyrostuwielkości sprzedaży w systemie bancassurance i osiągnięcia w 2009 r. 6-procentowegoudziału w rynku, nie należy jednak oczekiwać tak silnego dalszego wzrostu. W żadnymkraju UE maksymalny udział bancassurance dla działu II nie przekracza 12%.Dystrybucja ubezpieczeń przez agentów-osoby prawne w latach 2002-2009systematycznie zwiększała swe znaczenie. Silny rozwój tego kanału dystrybucjinotowany w latach 2004-2007 oznacza, że jest on w dużej mierze uzależniony odsytuacji na rynku motoryzacyjnym. Innym obszarem obecności agentów-osób prawnychsą ubezpieczenia działu I, w tym ubezpieczenia grupowe, w których osiągali w drugiejczęści tego okresu coraz większe sukcesy.Kanał brokerski nie zyskał sobie w analizowanym okresie większegozainteresowania. Stosunkowo niska sprzedaż ubezpieczeń przez brokerów świadczy, że,szczególnie po wejściu Polski do UE tracili oni udział w rynku na rzecz, m.in. agentówosóbprawnych.WnioskiW latach 2002-2009 sektor ubezpieczeń w Polsce przeszedł silną transformację.Pierwsza część tego okresu charakteryzowała się dostosowywaniem zakładówubezpieczeń do technicznych i regulacyjnych wymogów stawianych przez wspólnotowysystem finansowy. Druga natomiast była okresem integracji z rynkami europejskimii napływem kapitału inwestycyjnego do polskiego sektora ubezpieczeń. W tym czasiezakłady reorganizowały struktury swoich ofert i organizację dystrybucji ubezpieczeń,zarówno działu I, jak i działu II. Przemiany te przyniosły następujące efekty.1. Zakłady ubezpieczeń silnie zdywersyfikowały kanały dystrybucji swoichproduktów. W początkowym okresie niemal całkowicie sprzedaż prowadzono wewłasnych placówkach oraz przez agentów indywidualnych. Z kolei w ostatnichfunkcjonowały trzy kanały o zbliżonych do siebie wartościach sprzedaży, tj.placówki własne, agenci-prywatni i bancassurance. Istotne znaczenie miała równieżdystrybucja przez agentów-osoby prawne oraz brokerów.2. Pomimo pewnego osłabienia zainteresowania sprzedażą własną w latach 2004-2007,w porównaniu do innych form sprzedaży, stała się ona najsilniejszym kanałemdystrybucji ubezpieczeń. Jej pozycja może ulec w przyszłości poprawie w związkuze zwiększającą się bezpośrednią sprzedażą ubezpieczeń.3. Agenci indywidualni nadal utrzymują wysoki udział w rynku ubezpieczeń.Obszarem ich największej aktywności były ubezpieczenia działu II, szczególnieubezpieczenia komunikacyjne. Natomiast istotnie maleje ich udział w sprzedażyindywidualnych ubezpieczeń działu I.5 Dane z: CEA, European Insurance in Figures, CEA Statistics no. 42, November 2010.68
4. Sprzedaż w systemie bancassurance doznała największych przyrostów w latach2002-2009. Zakłady ubezpieczeń wykorzystywały tę formę dystrybucji główniew stosunku do ubezpieczeń działu I, a w znacznie mniejszym stopniuw ubezpieczeniach działu II. Rozwój bancassurance w Polsce, w najbardziejzauważalnym stopniu, nastąpił po wejściu do UE w 2004 r., co było w dużej mierzeefektem wzrostu akcji kredytowej banków, a także potrzeby lokowaniaoszczędności przez gospodarstwa domowe. Fakt uczestnictwa polskich instytucjifinansowych w konglomeratach finansowych mających siedzibę w krajacho wysokim udziale bancassurance pozwala oczekiwać przeniesienia w przyszłościtakiej strategii również do Polski.Literatura:CEA (2008): European Insurance in Figures, CEA Statistics no. 36, October 2008CEA (2010): European Insurance in Figures, CEA Statistics no. 42, November 2010GUS (2008): Towarzystwa ubezpieczeniowe 2006-2007, Główny Urząd StatystycznyDepartament Finansów, Warszawa.GUS (2009): Polski rynek ubezpieczeń 2004-2008, Główny Urząd StatystycznyDepartament Finansów, Warszawa.GUS (2010): Polski rynek ubezpieczeń 2004-2010, Główny Urząd StatystycznyDepartament Finansów, Warszawa.KNF (2010): Raport o stanie sektora ubezpieczeń po III kwartale 2009 roku, UrządKomisji Nadzoru Finansowego, Warszawa.KNUiFE (2003): Raport o sytuacji sektora ubezpieczeń 2002, Urząd Komisji NadzoruUbezpieczeń i Funduszy Emerytalnych, Warszawa.KNUiFE (2004): Rynek Ubezpieczeń 2003, Urząd Komisji Nadzoru Ubezpieczeńi Funduszy Emerytalnych, Warszawa.KNUiFE (2005): Sprzedaż ubezpieczeń przez Internet, Urząd Komisji NadzoruUbezpieczeń i Funduszy Emerytalnych, Warszawa.KNUiFE (2006): Rynek Ubezpieczeń 2005, Urząd Komisji Nadzoru Ubezpieczeńi Funduszy Emerytalnych, Warszawa.PIU (2007): Ubezpieczenia2006, Polska Izba Ubezpieczeń, Warszawa.PIU (2008): Ubezpieczenia2007, Polska Izba Ubezpieczeń, Warszawa.PIU (2009): Ubezpieczenia2008, Polska Izba Ubezpieczeń, Warszawa.PIU (2010): Ubezpieczenia2009, Polska Izba Ubezpieczeń, Warszawa.Główny Urząd Statystyczny: www.stat.gov.plPolska Izba Ubezpieczeń: www.piu.org.plUrząd Komisji Nadzoru Finansowego: www.knf.gov.plSummaryIntegration with the European Union was a source of significant changes in the Polishinsurance sector. The period of 2002-2009 was characterized with the increase of foreign capitalinvestment and the increase of competition from domestic and foreign insurers. One of the moreimportant consequences of that process was the broadening of the range of products and changingof the structure of distribution channels. The goal of the analysis is the examination of thedirections and scale of changes in the structure of insurance products and the structure ofdistribution channels in the year 2002-2009. The research is based on the data on insurance69
companies from the Polish Financial Authorities (KNF) and the Polish Chamber of Insurance(PIU). The results indicate that with the increase of the foreign investments the insurance sectorand the improvement of the economic situation of Poland, the significant increase of the marketshare of mid-sized insurance companies was recorded. At the same time the level of the sectorconcentration was lowered. Insurance companies changed the product structure, inter alia, byoffering more life insurance as an investment vehicle for households’ savings and reducing theshare of communication insurance and increasing financial and property insurance.Transformation of the insurance sector during the period of 2002-2009 was also associated withthe restructure of the sales system and a significant increase of the sales in the bancassurancesystem. As a result insurers achieved sales diversification in the insurance sector in Poland.Additionally the distribution with Internet and telephone became a growing distribution channel.Informacje o autorze:Dr Kozak SylwesterSzkoła Główna Gospodarstwa WiejskiegoKatedra Polityki Europejskiej, Finansów Publicznych i Marketinguul. Nowoursynowska 16602-787 Warszawatel. 0-22 593 4060e-mail: Sylwester_Kozak@sggw.pl70
5 (54) 2011Anton Kretter, Zdenka KádekováAdvertising and public relations efficiency measurementand controlPerformance achieved by advertising directly and by PR indirectly could be seen as "thecommunication power" which can be clearly attributable to this communication tools.Through this communication effect in conjunction with other policy instruments could beachieved the planned sales (market share, profit), because the ultimate goal is, ofcourse, the economic effect. As the sales is achieved by the combination of all tools ofcommunication mix, the finding of advertising and PR efficiency in terms of increasingsales from above mentioned reason is very difficult. The paper points at the possibilityof application the measurement methods of the non-economic as well as the economicefficiency of advertising and PR.IntroductionIn the economic practice are the tools of the communication policy used toreach the target and at the final point to attract the attention of customers to buy theproduct. Advertisement should inform and influence those, which favor applies for andsupport their purchase decision. The role of public relations (PR) is to create andmaintain the relationships with relevant segments of society in order to create a goodwilland reputation of the enterprise. Advertising and public relations costs belong to theimportant items of marketing costs in the practice of the enterprises. It is a natural needof each enterprise to identify the effectiveness and efficiency of the expended costs. Itfully applies to the cost of advertising, although quantification of this task is difficult.AdvertisingAdvertising is part of our social and economic system. Within the economicsystem, advertising has evolved into a communication system for both consumers andenterprises. The ability of publicity in addressing the prepared messages to the targetgroups through the advertising and other promotion methods assigns its important role inthe marketing programs of most enterprises. Enterprises are actively oriented to promotetheir products and services on the market. Consumers have learned to rely on advertisingand its forms with respect for information that could be used in their purchase decisions.71
The increase in advertising expenditure reflects the fact that marketers recognize thevalue and importance of advertising.Advertising is essentially impersonal and indirect form of market communication, whoserole is to support the identified market offer in order to obtain and then also to accept thepurchase of as many customers as possible. 1Advertising is essentially aimed at maximum efficiency. Decisions aboutadvertising should be directed to make its efficiency even stronger, deeper and broader.All measures from the advertisement planning to its implementation must include anelement of efficiency. Efficiency is considered to be the dominant principle of alladvertisements. And to efficiency are subordinated all matters related to the choice ofadvertising carriers, advertising resources, deployment time and released funds foradvertising 2 .Public RelationsPublic relations constitutes the creation of planned and systematic relationshipbetween enterprises and the external and internal public, in order to obtain understandingand confidence. When communicating with the public it is an important two-way flow ofinformation and feedback. 3Modern PR is the bidirectional communication, often the dialogue influencingthe public opinion and attitudes, because of its strategic objective in the positive changeof the audience behavior. The feedback is needed for evaluation of the communicationeffectiveness and its potential for tuning in the next process. The basic tactics of PRshould inform and persuade the public, as well as improve the relationships and shapethe behavior of the public through the targeted communication and by disseminating thetargeted information. Long-term strategic goals of PR are understanding, harmony ofinterests and favorable image of enterprise in the public perception.In the practical activities, PR is essentially about two basic things:- activities that create trust,- and the care about contacts with certain relevant groups of society. 4In order to gain the trust of the public, the enterprise has to be credible. Whenthe enterprise thanks to well kept and understood PR enjoys the public trust, the this willbe reflected not only in understanding and success on the market, but also when theproblems and difficulties penetrate to the public. Taking care of understanding andmaintaining the public trust is a permanent role. The principle of continuity, constant andsustained efforts is crucial. Understanding and trust is need to be verified, reproducedand treated every day. 51 JEDLIČKA,M. : Propagačná komunikácia podniku, 20002 KRETTER, A. a kol.: Marketing, 20103 MATÚŠ, J. : Interakcia externej a internej komunikácie, 20094 HES, A a kol.: Chvání spotřebitele při nákupu potravin, 20085 KÁDEKOVÁ, Z.: PR a ich dôležitosť pre úspech spoločnosti na trhu, 200972
Efficiency of Advertising and PRMonitoring the efficiency of advertising and public relations is a specificproblem of business costs efficiency control. This finding is based on that fact thatefficiency of advertising and PR is based on a comparison between the desired effect andthe actual effect.This creates a close link between setting the goals and efficiency control, whichcompares the performance achieved by communication measures with given aims. Indoing so, advertising goals are fundamentally communicative goals and can not beformulated as the direct economic objectives. It follows that efficiency control ofadvertising and PR should be oriented primarily to measure the microeconomic effects.Detection of Non-economic Efficiency of Advertising and PRThe non-economic efficiency of advertising and PR is dealing withpsychological categories, which appear in the target group in the form of a hierarchyeffect after purchasing the product. Influence of PR and advertising on the target groupshould step by step led to know the producers and their products and in the final phasealso to purchase these products. The best known is model of activity is AIDA(Attention-Interest-Desire-Action). PR and advertising should achieve that the targetgroup will be prompted for a decision, respectively action.As reflected in the phases of the psychological stage models, the non-economiceffects of advertising and PR are measured on the basis of categories of action - thedegree of knowledge, value of recollection, value of recognition and image.Degree of recognition of the company and the brand is measured byquestioning, which is determined with help or without it. Recognition of the brandswithout help is known as an active degree of recognition. The recognition of the brandswith help means submitting a list of brand names. In practice is preferred therecognition without any help.‣ Recognition TestRecognition test is realized in a very simple way by using the test workbook,which will be presented to the tested person. Subsequently, the workbook will berebrowsed again and found out if the tested person recognised the ads or not and whatfeatures of ads are remembered the best. However the recognition tests are not the finalmeasure of advertising efficiency. In fact, recognition is very easy to achieve by usingattention-getting devices like catchy visuals, unusual headlines, bizarre or odd shapes,flashy and vivid color etc. and recognition alone does not ensure purchase by consumers.Although the recognition test is widespread in practice, the results must beinterpreted with caution, because the values do not show whether the effect is possitiveor negative.‣ Recall TestRecall test is a kind of a memory test that attempts to measure the impression orpenetration made by an advertisement on the readers or viewers mind. It evaluates the73
memo ability ads an advertisement by contacting audience members and asking themwhat they remember about it. As a test of memory, recall is more demanding anddifficult than recognition. Various recall tests differ in the subject matter they deal withand the aid-to-memory they provide. Some deal with print ads while others deal withbroadcast ads. Some recall tests use aids to help audience members to remember whileothers do not use such aids.‣ Image analysisImage analysis can detect the emotional strength and motivation effects ofadvertising and PR. Obtaining testimony on how the customer sees the manufacturer andconsequently the product may stimulate and create the preference. Terms that could beused in research of image are: reputation, credibility, reliability, responsibility, andfurther in response to it are also words that suggest perception of communicationannouncement, its style and perceptions of users (eg. advertising was alive, boring ,attractive, normal, interesting, nice, semantically empty, serious etc.).‣ Efficiency of PR campaignsEfficiency of PR campaigns can be measured only if they there are setmeasurable objectives. This means mainly short-term or long-term awareness building,change of opinions and attitude to the company, which has to be measured in the targetgroup.Results of PR can be based on three performance indicators: inputs, outputs andindicators of success:- Variable inputs: measured PR activities, such as number of interviews, number ofbusiness meetings etc.- Variable outputs: PR results measured in terms of media coverage and publicity.- Indicator of success: measures the extent of achievement of predetermined objectivesin relation to target group. This procedure is very similar to measuring advertisingefficiency. Examples of measurement are: the proportion of the reached target audience,changes in knowledge and awareness, changes in opinions and attitudes, thedevelopment of image and reputation, the extent of changes in behavior.Detection of Economic Efficiency of Advertising and PRAs regards the economic efficiency of advertising and PR, this could beexpressed by the sales which is the volume of funds received from the sold products.Marketing and sales differ greatly, but have the same goal. Marketing improves theselling environment and plays a very important role in sales. If the marketing departmentgenerates a list of potential customers, that can benefit sales. A marketing department inan organization has the goal increasing the number of interactions between potentialcustomers and the organization. Achieving this goal may involve the sales team usingpromotional techniques such as advertising, sales promotion, publicity, and publicrelations, creating new sales channels, or creating new products (new productdevelopment), among other things.74
In quantifying the effect of advertising on the sales of the product acts the rolethe internal and an external insulation problems. Internal insulation problems stem fromthe fact that sales is a result of the combined influence of all marketing mix tools.Accurate determination of the sales, which was reached only by implementingadvertising and PR is impossible.There exist also the external insulation problems, caused by changes in fashion, changesin demand, behavior of competition, etc. Accurate determination of the effect ofadvertising on sales is also impossible for the above mentioned reasons.The exposure time of advertising and PR can not be clearly determined. Theduration of advertising action is not identical with the time of deployment according toits plan of spreading. In practice, ad permorms relatively long, while the durations of thevarious advertising media (advertisements, TV commercials, poster) vary whencompared with each other. The situation is similar in the case of PR activity exposuretime, which is a tool for long-term influence and on the exact measurement of itsefficiency pertains deeper problems than in the advertising efficiency measurement. PRefficiency is not measurable.In the enterprise which has wide range of products, while the advertisement ismade just for one particular product, it is important to investigate the effects ofadvertising not only on the sales of this product, but also to other products of thecompany. Effect on other products is manifested mainly in the substitution andcomplementary relationship. In the substitution relation the advertising affects the salesof non advertised product in the negative way, while the complementary connection hasa positive effect on sales of advertised and non advertised products as well. But even ifthere is no substitution or complementary links between advertised and non advertisedproducts, there may be the impact on other parts of the range. It can be assumed thatadvertising on a single product creates a general “goodwill effect”. Quantification ofthese effects is difficult.As methods of measuring the advertising efficiency on sales may be used themethod of direct interview or the test method of the regional sales. Their results are onlyapproximate quantification of the level of real findings.In direct interviews are buyers of the advertised goods asked whether theirpurchase is stimulated by the appropriate advertising, or whether they buy the productfor other reasons. However, in the answers may arise the problems because some buyersare not willing to give the real motives of purchase and may not admit that they havepurchased the product because they have seen the advertising on the product. The buyerswill then deny the ads as the reason for the purchase and instead will look for the otherreasons, those that seem more rational and ensure them more prestige.The companies that sell their products through "written way" can usedrelatively easy and inexpensive method of control of advertisement efficiency: an orderwith regard to advertising. Those assumptions are met particularly in the catalogbusiness. Here could be found out the effects of efficiency of advertisements withouthigher costs on control. The advertising means (advertisements, promotional letters, etc.)are fitted with ordering coupon. For a catalog advertising the coupons are replaced bythe number of products. Similarly it is in the sale through the internet. When analyzingthe advertising efficiency in the regional sale, attentention should be paid to the two oreven more regions with the equivalent market structure. The advertising efficiency on75
the sales can be find out from the difference between the sales on the test market, wherewe have used advertising and the sales on the control market where we have used no ads.An important element to identify the structure of the markets is mainly that the situationin demand, competitive behavior and the use of marketing tools (other than advertising)is identical.In theory of monitoring the economic efficiency of PR and advertising on therevenue growth are developed some methods based on the mathematical knowledge.Even when using some of these algorithms, we must take into consideration the fact thatthe increase in sales is not the result of promtion as well as the wide range of otherinternal and extrenal factors that enterprises can not directly measure. And therefore thismathematical calculation can be regarded as indicative.ConclusionMeasuring and monitoring the efficiency of advertising and PR is difficult andmultidimensional role, which results can not be exactly determined. Searching themethods for the most accurate answering on the given question is the actual role in thearea of the theory of marketing tools efficiency quantification. This is the task whichfurther development would be welcomed in the enterprises´ practice, because theadvertising costs represent a significant item in the total cost of the product. Methodsapplied to measure the efficiency of PR and advertising provide the information for thecorporate management for decisions making and also for evaluating this decisions.References1. JEDLIČKA, M. 2000.Propagačná komunikácia podniku. Trnava: Magna,2000, 343 s., ISBN 80-85722-09-7.2. KÁDEKOVÁ, Z .2009. PR a ich dôležitosť pre úspech spoločnosti na trhu.In:MANAŽMENT, MZDY, PRÁVO A FINANCIE, roč.XVI, 2009, č. 23-24. s. 290– 305. ISSN: 1335-95683. KRETTER, A. a kol. 2010. Marketing. 4.nezmenené vydanie. Nitra: SPU,2010, 288 s. ISBN 978-80-552-0355-3.4. MATÚŠ, J. 2009. Interakcia externej a internej komunikácie. In: Zborník zvedeckej konferencie Nové trendy v marketingovej komunikácii. Trnava: UCM,2009. s.221-231. ISBN978-80-8105-090-9.5. HES, A. a kol. 2008. Chování spotřebitele při nákupu potravin. Praha: Alfanakladatelství, 2008, 146 s. ISBN 978-80-97197-20-2.SummaryPublic relations and advertising are important tools of marketing activities inmeeting the business objectives, contributing the building of reputation and image of theenterprise and the customer´s awareness about the products. PR and advertising help to76
activate the customer´s interest in buying the product. Implementation of advertising andPR is a cost item for the enterprise. The amount of funds entered into advertising and PRis based on a comparison between actual and desired effect. Monitoring the efficiency ofadvertising and PR should be oriented primarily on measuring of microeconomiceffects. Through this communicative effects in conjunction with other tools of marketingmix can be measured impact on sales (though not exactly) because the ultimate goal isobviously the economic impact of business activities.Contact Addressdoc. Ing. Anton Kretter, PhD.Slovak University of Agriculture, Faculty of Economics and Management, Departmentof marketing, Tr.A.Hlinku 2, 94976 Nitra, Slovakiae-mail: anton.kretter@fem.uniag.skIng. Zdenka KádekováSlovak University of Agriculture, Faculty of Economics and Management, Departmentof marketing, Tr.A.Hlinku 2, 94976 Nitra, Slovakiae-mail: zdenka.kadekova@fem.uniag.sk77
5 (54) 2011Ľubica Kubicová, Zdenka KádekováMarketing strategy of the new product introductionon the marketThe paper points at the choosing the effective marketing strategy whenintroducing the new product on the market. In today´s market the supply of the mostproducts prevails over their demand. If the market is saturated, the innovation is one ofthe important tools for the intensive products penetrating to the customers. The aim ofthe product innovation is the partial change, improvement of the current performance aswell as the substantial changes and creation of the entirely new products. The importantsources of innovation include basic and applied research, which can afford mostly thestrong and large companies such as Danone Group that is the largest producer of freshdairy products in the world and the world´s second largest supplier of the mineral water.IntroductionDanone Group executes its business in an environment that is rapidly developingwith constant and increasing requirements on the product quality. Danone ( known asDannon in the USA) is a global leader in the segment of fermented milk products, whichsince its inception deals with the health food. In some probiotic cultures the experimentalstudies have proven their health-promoting nature. As was the case Bifidobacteriumanimalis lactis DN-173 010 (CNCM 1-2494), the strain used in the manufacture ofActivia, which helps regulate digestion. Hundreds of these cultures were studied andtested, while only fifty are currently used in the manufacture of Danone productsworldwide. Our aim is to analyze the marketing strategy of introducing the newfermented milk product Activia Sweet Strawberry on the market. For choosing the rightstrategy is necessary to know and analyze the current situation on the market of milk andmilk products and determine the attitudes of those consumers who represent animportant attribute in strategy formulization.Consumption of Milk and Dairy Products in SlovakiaEverywhere in developed countries, dairy is among the leading sector ofnational economy and has a deep all-society meaning regarding the importance ofnutrition in the population. Each developed country in the world tries to reach the self-78
sufficiency in the basic food production and one of the most important ones are milkand dairy products. 1Current development in the dairy industry in Slovakia recorded a number ofchanges in the last decade (1999-2009), which are determined mainly by the followingfacts:• milk as the basic raw material of the dairy industry lost its local character and isdistributed beyond the region and country borders,• classic selection of dairy products has changed and extended, the dairy products areoffered together with so called ‘analog products‘ which are, for example the alternativeto cheese, but are not produced on the basis of milk but vegetable oil, wheat starch,natural cheese flavor and color,• production of dairy ingredients has branched out, the use of milk is also moved tocatering and fast food and on the basis of continuous scientific knowledge of milk isplaced also to the areas outside the human diet,• significant business opportunity for the dairy industry is the production of so-called‘functional foods’ based on the bioactive components in milk,• about future and location of the dairy enterprise ( company, premises) decide themultinational parent companies, not the economic situation of the local traffic, but themanufacturing strategy and strategic trade policy of the holders (e.g., maintaining of thetargeted market position in the particular country),• progressing globalization accelerates the process of production concentration andsupports the targeted specialization of dairy products premises and the marketing ofbrands and at the same time to achieve a wider range of the selection, the dairybusinesses extend their commercial activities,• entry of various financial groups into the food industry including dairy, is continuallychanging the profile of primarily agrifood ownership structures, the growing importanceacquires property link in the chain: primary production – processing - final-sale,respectively clustering of individual subjects.• crucial world and European dairy companies enter into various mergers and creatingstrategic alliances with each other and also with companies outside the agri-foodbusiness environment. Result of these steps is progressing deepeningmonopolization. 2Development of consumption of milk and dairy products in Slovakia has beendecreasing. 3 The largest decrease was recorded in consumption of drinking milk, butwhich part is being replaced by other dairy products with higher added value ( Graphs 1and 2).1 Euromonitor International.Dairy in Slovakia. ( 21.2.2010) Avaliable online athttp://www.euromonitor.com/dairy-in-slovakia/report2 Euromonitor International. The concept of milk production and dairy industry in the Slovak Republic(22.1.2010) Avaliable online at http://www.euromonitor.com/dairy-in-slovakia/report3 KUBICOVÁ, Ľubica - KÁDEKOVÁ, Zdenka. 2010. Comparison of Consumption on the Food Marketbetween Slovakia and Austria. In Delhi Business Review, roč. 11, 2010, č.2. s. 47-60. ISSN 0972-222X79
Graph 1: Consumption of Milk and Dairy Products per Person in Kilograms in thePeriod 1995 - 2008168166164Consumption in kg162160158156y = -0,9154x + 1990,9R 2 = 0,66281541521501994 1996 1998 2000 2002 2004 2006 2008 2010YearsSource: Authors´ own research and calculations based on data from the Statistical Officeof the Slovak RepublicGraph 2: Consumption of Fermented Milk Products per Person in Kilograms in thePeriod 1995 - 200815141312Consumption in kg11109y = 0,3998x - 788,67R 2 = 0,82068761994 1996 1998 2000 2002 2004 2006 2008 2010YearsSource: Authors´ own research and calculations based on data from the Statistical Officeof the Slovak Republic80
Cultured dairy products also known as fermented milk products create animportant group of dairy products. They have an irreplaceable role in human nutrition,contribute to the nutrition of children, youth, people of working age and elderly people.Fermented milk products are mostly made from cow's milk, but can also be made fromsheep's milk, or the goat´s one. In the production of fermented milk products are used thespecific microorganisms, mainly Fermentation bacteria.Selection of the fermented milk products is wide. Many different types ofcultured milk products can be found around the world, the most common are:• yoghurts and yoghurt milk• acidophilus milk,• soured milk.In the period 1995 - 2008, the consumption of fermented milk products changedsignificantly and showed a fluctuating trend. The highest increase was recorded in 2002and in 2007, when consumption of fermented milk products increased by 1.7 kg perperson in 2002 respectively about 1.4 kg per person in 2007. The largest drop inconsumption in the mentioned period was recorded in 2006 by 0.8 kilograms per person.Based on the trend function that consumption growth for the period average by 0.3998kg per person per year. Trend consumption of fermented milk products, expressed asa linear function explains the dependence of power supply to increase range offermented milk products and the price affordability to 82%. 4Consumption of Yoghurt in SlovakiaYogurt is fermented milk product containing the live yogurt cultures that improvedigestion and keep the natural microbial environment in the digestive tract. Positivelyinfluence the composition of gastrointestinal microflora. Just like milk and yogurt are thesource of large quantities of minerals and vitamins. 5In the monitored period of the years 2002 - 2008 there were significantfluctuations in the consumption of yogurt, as it can be seen in the Graph 3. The largestdecrease was recorded in 2003 and in 2006 when there was a decrease in consumption of0.7 kilograms of yogurt per person and the largest increase in consumption was recordedin 2007, about 1.2 kg of which shows the equation of quadratic function that explainstrend in consumption of yogurt to 33.65%.4 KUBICOVÁ, Ľubica 2008. Consumer demand for food. Nitra: SUA, 2008. p.85. ISBN: 978-80-552-0092-75 Agriculture and Rural Development. School Milk Scheme. ( 24.3.2011) Available online athttp://ec.europa.eu/agriculture/markets/milk/schoolmilk/index_en.htm81
Graph 3: Consumption of Yoghurt per Person in Kilograms in the Period 2002-200887,5Consumption in kg76,5y = 0,0643x 2 - 257,8x + 258466R 2 = 0,336562001 2002 2003 2004 2005 2006 2007 2008 2009YearsSource: Authors´ own research and calculations based on data from the Statistical Officeof the Slovak RepublicModel of Expenditures and Demand for Fermented Milk ProductsDeclining consumption of drinking milk is due to the fact of improving the newproduction technologies, opening the market and increasing offer and even widerselection of other dairy products which substitute the fermented milk products. In 2008,73.26% from the total cash expenditures on milk and cheese in the childless householdswere spent on the other milk products from which 36.68% was spent for cheese andcurds and 37.26% for fermented milk products purchasing.Consumption of fermented milk products increases year by year without majorannual variation in the households with children as well as in the childless households.In the last 11 years in the families without children has been noticed an increasingconsumption of fermented milk products by 2.98% . In households with three or moredependent children, the average annual growth in consumption was 3.0% as it is shownin the Graph 4.82
Graph 4: Consumption of Fermented Milk Products by Dependent Childrenin the Households with One and More Then One Dependent Child25,00Consumption in kg20,0015,0010,005,001996 1998 2000 2002 2004 2006 2008 2010Childless One child Two children Three and more childrenSource: Authors´ own research and calculationsTable 1: Estimate of Parameters of Demand Functions for Fermented Products (qi) inChildless Households and in the Households with One and More Then One DependentChildHouseholdq i = b 0 + b 1 * price + b 2 * incomeElasticityEq i , p iElasticityEq i , IR 2Childless q i = 5.347 + 8.606 + 0.00149 0.973 0.308 0.815 **With One Dependent Child q i = 5.291 + 2.434 + 0.00146 0.358 0.299 0.753 **With Two Dependent Children q i = 3.257 + 2.490 + 0.00186 0.407 0.357 0.813 **With Three or More Dependent Children q i = 10.643 – 3.497 + 0.0043 - 0.631 0.739 0.829 **Source: Authors´ own research and calculationsNote : ** statistical significance at α = 0,01From the values of determination index R 2 (Table 1) can be concluded thatestimate of multiple linear functions explain the dependence of demand for fermentedmilk products (qi) on the unit price of this products (pi) and the average annual income(I) per person in Euros , from 75.3% up to 82. 9%.The leakage rate dependent on the demand for fermented milk products isexpressed as the multiple correlation coefficient with the values from 0.868 in thehouseholds with one dependent child, up to 0.911 in the households with three or moredependent children, which shows strong to very strong dependence on the product's ownprice and income.83
On the basis of the income elasticity coefficients (Eq i, I) and the price elasticity(Eq i , pi) of demand for fermented milk products can be said that consumer demand hasevolved in line with intuition and theoretical assumptions only in households with threeor more dependent children, where the growth of prices resulted in a reduction indemand for fermented milk products.Conversion coefficient of fermented products own prices shows that the increase inconsumer prices by 1% causes a decrease in demand for fermented milk products by0.631% in the households with three or more dependent children. In terms of influenceof income on demand for fermented milk products, in the households with three or moredependent children, the income growth by 1% caused an increase of demand by 0.739%,while in the households with one child, mentioned increase of demand was only by0.299% . In the childless households, the income growth by 1% caused an increase ofdemand by 0.308%.Marketing Strategy of “Activia Sweet Strawberry” ProductIntroduction and Product PolicyHistory of Danone in SlovakiaActivity of Danone Group in Slovakia is dated from 29 th July 1996, when thecompany was established by registration in the commercial register. In Slovakia, Danoneacts as a multinational company. On the Slovak market it has gained a strong positionmainly through its products Actimel, Activia, Dobra mama (Good Mom) and Kostici(Bones). In the current period Danone belongs among the key players on the dairymarket. High and stable quality of the products, wide selection and maximum customercare help to sign the annual revenue growth. Year 2010 was in the spirit of celebration ofDanone, because 90 years ago this company made its first yogurt.The aim of the product line Danone "Activia Sweet" was to penetrate into themarket segment of yoghurts with lower price. This product line should impress theconsumers by delicious flavor and health beneficial effects at an affordable price. Whenapplying this objective the company had used one of the variants of the product strategy,namely the strategy of product development, while trying to reach existing customers bythe new products. Thanks this strategy was reached an increase in the value of existingrelationships, while one of the instruments was mainly an affordable price. The newproduct was focused on the target group of women aged 20 to 55 years, experiencinga problem with digestion. Danone Activia in its portfolio of fermented milk productsprepared for its customers a new flavor, which extended the range of Activia SweetYogurt. Products “Activia Sweet“ have a delicious fruity flavor and creamy texturewithout pieces of fruit. By combining a pleasant sweet taste and the flavor of wildstrawberries was created the concept of “Activia Sweet Strawberry”. Activia with itsproduct line with “Sweet White” comes to market with a given bid:• White,• Sweet White• Sweet Strawberry - fermented product Bifido culture, sweetened with the strawberryjuice.84
After introduction of product Activia Sweet Strawberry on the market inSeptember 2009, the company sales stood at 10 tons. In the next coming months byusing the introduction price and investing more amount of money in the communicationmix approached, the company attracted the consumers and increased the sales volume upto 71 tons and ultimately in the last quarter of 2009, the sales volume was at 183 tons.This fact was in harmony with the company´s aim to achieve sales volume of newproduct at 200 tons by the end of 2009.Consumers find a number of information on the packaging of Activia SweetStrawberry, manufacturers have to indicate some data mandatory, some information onthe composition of the statement are given voluntarily. Food label becomes an "identitycard" for the consumers, where could be find the information on:• product composition• nutritional values.For better orientation in the packaging marking, Danone provides an explanation ofused abbreviations and tables of nutritional values on their product labels. Corporatesymbol, or logo of Danone company, Ltd., the designers placed on a light blue background,which aims to connect health with a smile which is a symbolic figuration of the health.Exactly the motto: "Danone is a source of health for your body and thus your good mood''.Danone logo reflects the modernity and elegance, expresses its accessibility and bringsa stylish new element. Signature red symbol clearly captures the mission of the brand.Figure 1: Danone logoSource: www.danone.skPrice PolicyPrice is for the consumer in many cases the most important factor whenshopping. 6Price is a tool of value which is formed by supply and demand. It is the only partof the marketing mix that brings the sales to the enterprise. Setting up the right price isthe issue of the price strategy. Price is based on calculations and competitive prices. 76 SUPEKOVÁ, Soňa - NAGYOVÁ, Ľudmila - KÁDEKOVÁ, Zdenka a.i. 2010. EU quality policy: applicationin the conditions of the EU and Slovakia. In: 11th international conference. International scienticic days 2010."Global economy: Challenges and perspectives" May 26-28, 2010, Nitra : Slovak University of Agriculture,2010. p.126. ISBN: 978-80-552-0386-77 VICEN, Michal –KUBICOVÁ, Ľubica- MINÁROVÁ Martina. 2009. Strategic Marketing. Nitra : SUA inNitra, 2009. 220 p. ISBN 978-80-552-0179-585
Producers of Activia Sweet Strawberry tried to respect this fact and reacted by theproject “Affordable Activia”. The aim of the project was to attract the customers by thenew product while applying the rapid penetration strategy. It introduced the new productat a lower price, and this step just wanted to attract the customers and make the productaffordable. In the spirit of this given goal, the motto of the promotional leaflets ofActivia Sweet Strawberry is "You can afford New Activia too!"Desire of Danone company was to increase their market share using the productActivia Sweet Strawberry and the strategy of rapid penetration. The company introduceda new product called the low "promo price", in aim to achieve the greater market shareand to secure higher profits. To increase the profit Danone has implemented thefollowing marketing activities:• ensuring of the adequate supplies of Activia yogurt in the stores• dispay of Activia products on the shelves in the "promo blocks"• the creation of areas for sub-exposure product (refrigerators and gondolas)• placement of the promotional materials (POS) in the stores,• ensuring of the correct product labels and price tags.Distribution PolicyIn distribution policy Danone addresses the following aspects:• in terms of entry on the enterprise market,• in terms of selecting suitable distribution channel.Currently, all products of Danone company are imported from abroad.Distribution of products is carried out mainly from the Czech Republic (Benešovskádairy), Hungary (Budapest) and Poland (Warsaw). Implementation of manufacturingproducts takes place in the city of Cesky Benesov, where Activia and Actimel DanoneYogurt and Danone Creamy are manufactured. These products are exported by theexport company from the Czech Republic and given to the import company inBratislava,capital city of Slovakia, from where are these products delivered to the centralwarehouse of Danone company in the city of Senec in Slovakia. Logistics is provided byexternal transport company ESA. The company distributes products to the individualstores, retail stores and chain stores where are available for the consumers.Tesco distributes products to the hypermarkets and chain stores across thecountry. In the same way goods are distributed to the stores of BILLA company. In thecase of smaller retail chains, the goods are imported directly from the warehouse ofDanone company to retail stores by dealers themselves or by the truck sent from Danonecompany. This option is used by COOP Jednota company, CBA and small independentcompany called "Independent". Upon this procedure Danone company applies pushdistribution strategy. Distribution of products to Danone Ltd., is carried out through prearrangedorders.86
Communication PolicyMarketing communication offers the important information about the productsand is most commonly used in the few forms of communication tools such asadvertising, sales support, public relations and direct marketing. 8One of the more important tools is advertising.The company supported the introduction of the new portfolio of Activia products bystrong advertising campaign implemented on Slovak national televisions TV Markiza,JOJ and STV. The purpose of the ad was to focus on the middle-aged women (targetgroup) with digestive problems and point at the new Activia product. The motto of thecampaign was: "Let your problem blowout" and the face of TV and Web campaignbecame well known actress Zuzana Tlučková.Another powerful tool to promote the new product is an internet advertising 9 viainternet pages www.Danone.sk and www.Activia.sk.On these pages consumers learn about all information of each product from Danoneportfolio. There are studies available on probiotic effects as well as information onhealthy eating habits, healthy diet, online counseling, various recipes and basicinformation about the company.Sales support is realized through so-called Danone´s POS (point of sale)materials that are used mainly for the new products as the primary tool to attractcustomer's attention. Deployment of POS materials in retail chains is mostly near therefrigeratores that store Danone products. The major customers of the company Danoneare large retail chains like TESCO STORES, BILLA etc. and for these companiesDanone are provides various types of POS materials such as leaflets, posters in A4 andA2 format, tops and sides of the refrigerator shelves as well as decorations.Samples of the new Danone products could be tried for free in selected chainstores across the country. The aim of these promotions is to introduce the new product tothe customers and give a chance to try and taste the new product and if interested also topurchase the product for an introductory price. This way Danone finds out the opinion ofthe customers and secures the sales of the new product.Promo PackTo attract the attention of the customers is possible thanks to a special package -called “Multipack“ which contains 4 pieces in 1 package for the sales price of 1 Euro.For larger retail chains is prepared the special package of 4 pieces plus 2 pieces for free.8 NAGYOVÁ, Ľudmila – KÁDEKOVÁ, Zdenka – ROVNÝ, Patrik. 2010. Shopping environment andshopping atmosphere. In: HORSKÁ, Elena - NAGYOVÁ, Ľudmila - ROVNÝ, Patrik. a kolektív: 2010.Merchandising a event marketing pre agricultural. Nitra : SUA, 2010, 329 p. ISBN: 978-80-552-0469-79 KRETTER, A. - ŠIMO, D. - NAGYOVÁ, Ľ. - VICEN, M. 2008. Marketing. Nitra: SUA, 2008. p. 262-269.ISBN: 978-80-552-0134-4.87
ConclusionWhen the new product comes on the market, the company's aim is to introduceit to the public and consumers. So does Danone, when introducing the new products. Thecompany developed a project " Available Activia“ pointing at the reasonable price of theActivia products. With the perfect concept Danone wanted to attack the competition andbring yogurt with scientifically proven probiotic effects to the attention of the generalpublic. In order to meet those objectives Danone developed a marketing strategy,consisting of product policy, price policy, distribution policy and communication policy.The strategy itself was formulated by marketing department staff. The productintroduction was based on the research provided by agency TNS AISA that questionedthe consumers about their interest, opinon and attitude to Activia products, as well as thefact that consumers brought their views and proposals on the Activia product line thanksto this survey.As for Active Sweet Strawberry product strategy, Danone implemented thedevelopment strategy that seeks to reach out to existing customers of the new productsand increase the value of existing relations, one of the instruments for theimplementation is mainly price and higher quality compared to competitors. The focuswas on the target group of women aged 20-55 years who experienced a problem withdigestion.In the pricing policy Danone applied the strategy of rapid penetration, wherea lower price in comparison with competitors helps to win the higher market share. Thisprice has become more affordable to a wider range of consumers. The aim was to coverthe market penetration and gain the customers from competitors, allowing the companyto ensure higher market share and achieve higher profits as well.Distribution policy of Danone company is provided by the external companies.Danone imports to the Slovak market all its products from abroad. It is therefore veryimportant to have properly developed distribution. Danone products are imported fromthe neighboring countries - Poland, Hungary and the Czech Republic. The largestdistributor is the last mentioned Czech Republic with Activia products, Actimel andDanone Creamy.Communication is very important element of overall strategy. Just from thecommunication itself and its parts depends the success of the new product on the market.For the new product is important to get as soon as possible among our customers and toprecisely offer well developed communication strategy. Danone applied few elements ofthe communication policy, mainly advertising, sales support, public relations and directmarketing.Danone recognizes the importance of advertising in the life of the consumer,and therefore constantly increases money spent on advertising. When introduving thenew Activia Sweet Strawberry it sales was supported by the media campaign on TV.Also during the growth of this product the company spent considerable money onadvertising. Strategy of communication is mainly concerned on changes in advertising.Danone focused also on internet campaign, supported mainly by their websiteswww.danone.sk and www.activia.sk, as well as taking advantage of services and socialnetworking sites like Facebook.com and Azet.sk.88
References1. Agriculture and Rural Development. School Milk Scheme. ( 24.3.2011) Availableonline at http://ec.europa.eu/agriculture/markets/milk/schoolmilk/index_en.htm2. Danone company. ( 21.2.2011) Avaliable online at : www.danone.sk3. Euromonitor International. The concept of milk production and dairy industry inthe Slovak Republic (22.1.2010) Avaliable online athttp://www.euromonitor.com/dairy-in-slovakia/report4. Euromonitor International. Dairy in Slovakia. ( 21.2.2010) Avaliable online athttp://www.euromonitor.com/dairy-in-slovakia/report5. KUBICOVÁ, Ľubica. 2007. Income situation and purchasing behaviour of theinhabitants on the food market in the Slovak Republik. In: Proceedings of theinternational scientific conference Agrarian Perspectives XVI. European trends inagriculture and rural development.Prague:CZU, 2007. p. 1-9 . ISBN 978-80-213-1675-1.6. KUBICOVÁ, Ľubica - KÁDEKOVÁ, Zdenka. 2010. Comparison of Consumptionon the Food Market between Slovakia and Austria. In Delhi Business Review,Vol. 11, 2010, No.2. p. 47-60. ISSN 0972-222X7. KRETTER, A. - ŠIMO, D. - NAGYOVÁ, Ľ. - VICEN, M. 2008. Marketing. Nitra:SPU, 2008. s. 262-269. ISBN: 978-80-552-0134-4.8. KRÍŽOVÁ, Silvia. 2009: Selected food verticals and their impact on prices of foodproducts. In:Agricultural Economics. Vol. 55. No.2. p. 94-101. ISSN 0139-570X.9. NAGYOVÁ, Ľudmila – KÁDEKOVÁ, Zdenka – ROVNÝ, Patrik. 2010. Shoppingenvironment and shopping atmosphere. In: HORSKÁ, Elena - NAGYOVÁ,Ľudmila - ROVNÝ, Patrik. a kolektív: 2010. Merchandising aevent marketing foragricultural products. Nitra : SUA, 2010, 329 p. ISBN: 978-80-552-0469-710. SUPEKOVÁ, Soňa - NAGYOVÁ, Ľudmila - KÁDEKOVÁ, Zdenka a.i. 2010. EUquality policy: application in the conditions of the EU and Slovakia. In: 11thinternational conference. International scienticic days 2010. "Global economy:Challenges and perspectives" May 26-28, 2010, Nitra. in Nitra : Slovak Universityof Agriculture, 2010. p.126. ISBN: 978-80-552-0386-711. Statistical Office of the Slovak Republic . ( 21.2.2011) Avaliable online at :www.statistics.sk12. KUBICOVÁ, Ľubica 2008. Consumer demand for food. Nitra: SUA Monograph,2008. p.85. ISBN: 978-80-552-0092-713. VICEN, Michal –KUBICOVÁ, Ľubica- MINÁROVÁ Martina. 2009. Strategicmarketing. Nitra : SPU v Nitre, 2009. 220 p. ISBN 978-80-552-0179-5SummaryChoosing an effective marketing strategy is essential and key factor of thecompanies´ success when introducing the new product. Usually the effective marketingstrategy means implementing of marketing mix in the practise. Danone company realizesthat to attract the attention of the customers and wide society is possible only byimplementing of carefully chosen tools of marketing communication policy and combine89
them in the best possible way with the only aim to introduce the new product to thecustomers and make them to buy this new product. The company developed a project"Available Activia“ pointing at the reasonable price of the Activia products. With theperfect concept Danone wanted to attack the competition and bring yogurt withscientifically proven probiotic effects to the attention of the general public. In order tomeet those objectives Danone developed a marketing strategy, consisting of productpolicy, price policy, distribution policy and communication policy while the promotionwas based on the most powerful tool of communication policy – advertising on TV, inthe other media and internet.Contact AddressIng. Ľubica Kubicová, PhD.Slovak University of Agriculture, Faculty of Economics and Management, Departmentof marketing, Tr.A.Hlinku 2, 94976 Nitra, Slovakiae-mail: lubica.kubicova@fem.uniag.skIng. Zdenka KádekováSlovak University of Agriculture, Faculty of Economics and Management, Departmentof Marketing, Tr.A.Hlinku 2, 94976 Nitra, Slovakiae-mail: zdenka_kadekova@yahoo.com90
5 (54) 2011Zuzana LušňákováCorporate Social Responsibility as part of Public Relationsand firm developmentThe paper deals with Corporate Social Responsibility (CSR) as a part of PublicRelation and firm development. We choose one of the most famous fast food all over theworld, which is McDonald's company for our research purposes on Corporate SocialResponsibility in business firm. The main objective of the article will be to find out, howMcDonald's company implements Corporate Social Responsibility towards employees,customers, supply partners, and the community. We also used a questionnaire surveyfocused on McDonald's employees to find out how does the company implementsa corporate social responsibility policy in employee opinion.McDonald's has over 32,000 installations worldwide in 120 countries. McDonald'sSlovakia says openly about the social responsibility policy in company's imagedevelopment and understand CSR as a Public Relation tool in particular, but also asa key tool for society development in accordance to the motto – „if the company thrives,we should feel a commitment to do good.“IntroductionThe goal of the organization's activities is the key to understand the corporate socialresponsibility concept. Socially responsible company should not only to maximizeprofits, but its goals are based on the needs of internal and external environment and alsoinclude social and environmental aspects of its activities. The objectives of suchorganizations move from short to rather long-term goals, which contribute to long-termability to generate profits and sustainable society development. It is because of a shiftfrom focusing only on profit to the three so-called "P": people, profit, planet. In this casethe company activity is based on applying the concept of "triple-bottom-line", whichtakes the economic growth as well as environmental and social responsibility of thecompany into account. As concepts of CSR and triple-bottom-line point out economicinterests may not be in contradiction with the social and environmental interests, but maycreate a synergistic effect. CSR provides a framework for organizations helping them tointegrate environmental, social (ethical) criteria into manager's decisions.The most frequently used definitions of CSR are as follows:"CSR is an ongoing commitment of firms to behave ethically, contribute to sustainableeconomic development while contributing to improve the quality of life for employees,their families, as well as local communities and society as a whole" (World BusinessCouncil for Sustainable Developpment).91
"The integration of business practices and values in such a way that they containinterests of all stakeholders including consumers, employees, investors and theenvironment" (The Corporate Social Responsibility Newswire Service).A. B. Carroll definition already from 1979: "Corporate Social Responsibility includeseconomic, legal, ethical and any other expectations of society, which has at that timefrom the organization."Howard R. Bowen wrote: "Social responsibility is a commitment of entrepreneurs toseek strategies to make such decisions or carry out such activities, which are desirable interms of goals and values of our society."Corporate Social ResponsibilitySource: http://www.industryplayer.com/corporate_social_responsibility.phpThere are participating groups in matters relating to Corporate Social Responsibility:1. owners, shareholders, investors,2. staff (employees),3. consumers,4. suppliers and business partners,5. competition,6. Government,7. community.92
CSR in relation to the owners, shareholders and investors requires:1. clearer assessment of annual reports,2. transparent accounting,3. alignment of activities with the expectations of shareholders,4. providing long-term stability of the company.CSR in relation to employees requires:1. to enable staff career,2. to improve their skills,3. to provide training,4. to ensure appropriate conditions relating to safety at work.CSR in relation to consumers requires:1. to ensure consumer satisfaction,2. to reduce the number of complaints,3. health and safety for consumers,4. adequate information in advertising.CSR in relation to the supplier requires:1. compliance with the conditions laid down in the contract,2. compliance with maturity dates,3. level playing field for potential suppliers.CSR in relation to competition requires:1. to respect rules of the competitive struggle,2. to respect ethical codes,3. common solution to some problems in the environment.CSR in relation to the community requires:1. commitments to invest in community programs,2. to develop human capital,3. contribute to the development of infrastructure.CSR in relation to the Government requires:1. support and management of corporate philanthropy,2. provision of government posts,3. effective use of subsidies, grants from government.Corporate Social Responsibility in McDonald's companyMcDonald's company was selected for the sixth time for inclusion in the Dow JonesWorld and Dow Jones North America Sustainability Indexes (DJSI). These indexescompare the companies that are industry leaders in a wide range of economic,environmental and social issues. McDonald's is one of the few fast food traders, which isso highly acclaimed.93
DJSI indexes belong to the world's most prestigious stock indexes of socially responsibleinvestors. This classification reflects the expertise that the company creates long-termshareholder value in the strategic management of corporate social responsibility and theattendant opportunities and risks. „McDonald's inclusion in DJSI shows how our owners,operators, suppliers and company employees work together to continually improveperformance“, said Bob Langer - vice president for corporate social responsibility. Theytry to drive sustainable, profitable growth of their company, they also contribute toa sustainable society.As the first we analyzed McDonald's Corporate Social Responsibility towardsemployees. The company puts great emphasis on staff in case of the possibility ofpersonal growth and development, because there stand the right skills and abilities ofworkers behind the company success. The company is also based on several values andprinciples such as respect, open communication and equally substantial and professionaldevelopment support. An important factor is the fact that McDonald's is able to providework for such groups of workers who face many difficulties by finding a job such asyoung people without work experience, women with children or handicapped persons.McDonald's is one of the leading employers of such workers in our country.An equally important component of CSR in relation to employees is their training andfurther development. The company is responsible for the condition, because this factorattaches great importance, as it was considered as a key article of company success.Next we realized the social responsibility examination towards other participating groupswhich are consumers (customers). McDonald's includes health and safety of customersamong the primary interests. Therefore the company uses only products and rawmaterials that must meet the strictest safety and quality criteria and not at least they mustbe tested and approved by all relevant institutions. An important part is the use ofbiotechnology in food, which affects global agriculture and food industry. Althoughsome genetically modified ingredients are not considered harmful and dangerous,McDonald's company requires from its suppliers to use mainly natural and nogenetically modified ingredients, which is important for their customers. In thecompany's ads it could be noted that the marketing is aimed at adult consumers and thecompany philosophy is also not to tamper with children. In the field of advertising tochildren the company follows not only national and international legislation, but also hasits own strict criteria. The company belongs to a member of a voluntary initiative ofmajor manufacturers who are committed to restrict advertising aimed at children.There was another aim of our research - the firm relations to supply partners. The systemplaces extraordinary demand on all suppliers, with which McDonald's is very closelyconnected on implementing the principles of quality management. This companysuppliers can become only sufficiently trained partners, who must undergo intensiveinspections regularly. Suppliers of raw meat must not only comply with technical andsanitary requirements but also make sure to purchase quality animals to the requirementsof McDonald's and place emphasis on handling. Similarly, business partners mustcomply with strict criteria of McDonald's.94
Than we also analyzed the corporate social responsibility of McDonald's in relation tothe community. McDonald's is also involved quite heavily in the sponsorship of manyactivities, such as World Children's Day, held on 30 November in all 16 McDonald'srestaurants in Slovakia. Thus obtained money goes to help children who must undergotreatment in hospitals. It will also help them to have a pleasant stay, and improvetreatments. McDonald's charity built family rooms in several hospitals in Slovakia - egChildren Hospitalin Bratislava, Childrens Faculty hospital in Kosice.Another charitable project that the company supports is „The House, where we are well“(this project is to provide better housing conditions for foster families caring for childrenwho can not be raised in their biological family). The company is also partner of theOlympic day run in Slovakia. It is a global event whose main purpose is to promote thesport idea - everyone can become part of the Olympic Movement. The basic philosophyof McDonald's was to be (also with the franchisee) beneficial for the environment inwhich they operate. Many franchisees may decide to support local sports teams or schoolfacilities, which will also be endorsed by the person satisfaction and commercial success.McDonald's company pays much attention to care about the environment in addition toother above mentioned areas. As the company attaches great importance to behaveresponsibly towards the environment, therefore it respects all the principles ofenvironmental protection and also leads its partners and suppliers to that philosophy.Each of the McDonald's restaurants operates on the principle of environmentalmanagement aimed at minimizing the impact of business activities on the environment.Key principles of environmental management in this company may include efficient useof resources, reducing emissions, reducing solid waste not only in their own restaurants,but also by suppliers, use of secondary raw materials and friendly technologies use interms of machinery and used equipment. The company also makes certain environmentalmeasures. And therefore all possible alternatives are always considered in their decisionmaking,which take particular aspects of environmental protection together with theappropriateness and cost criteria in decision-making process into account.Another aim of our research was to find out the relations between the firm and itssuppliers. Objectives that the company monitors in the field of the environment are asfollows:• efforts to reduce energy and water consumption, raw materials, reducing packagingvolume and weight,• to use recycled materials wherever appropriate,• measure to reduce emissions, such as optimizing the distribution of goods, control ofwater waste,• to minimize the amount of unsorted waste: increasing efficiency of pre-sorting of wasteand extending the number of sorted fractions whenever possible.The company is also committed to continuous review, evaluation and also improving theenvironmental program to ensure that it practices the best possible solution given theenvironmental conditions of its restaurants, which will also be in accordance withlegislative requirements. In addition with this commitment, McDonald's dedicates the95
space for staff training in this area, and also communicates with vendors to increase theirawareness of environmental protection.The company expects identification with environmental issues from its employees butalso that employees are fully aware of just how important is compliance with thedirectives, regulations and also practices as well as awareness of the impact of ownactivities on the environment. McDonald's is open to pro-active approach and submittingproposals for improvements in environmental policy.Some companies prefer short-term benefit of non-compliance with environmentalprotection, resulting in undue burdens on the nature and quality of life for futuregenerations. The McDonald's company's objective is to protect the environment in sucha way that future generations will be maintained natural diversity of nature and itscomponents. The company strives to be a good example regarding the application ofhigher standards relating to environmental protection.Questionnaire survey on the implementation of the Corporate SocialResponsibility in McDonald'sIn this section we used a questionnaire survey focused on McDonald'semployees to find out how does the company implements a corporate socialresponsibility policy in its employee opinion. The tested sample represented 324McDonald's employees. The questionnaire was sent through the mail and e-mail and wasreplied by 211 employees from the whole number of respondents. All thesequestionnaires were usable.Politics at work:1. Does your firm encourage employees to develop skills, abilities and long-term career?The questionnaire survey results that McDonald's managers are conducive to thedevelopment of qualification potential of their subordinates (90%). The remaining 10%expressed the view that the long-term career development and professional growthwould require more initiative from the employers.2. Do you inform your employees about important matters? (Do you inquire with them?)According to the survey 20% of McDonald's managers take the views of junior staff intoaccount, while 80% of managers respect the opinions of subordinates, to some extent ornot respect at all.3. Does your enterprise appropriate measures for health, safety and welfare, to providesufficient protection for employees?As we found out 73% of respondents consider undertaking measures for health andsafety of their employees to be satisfactory, 27% would take some measures to improvethem.96
Environmental policy:4. Have you ever tried to reduce your business impact on environment in terms of:a) Energy Savings70% of managers considered the environment impact to be minimal, while 30% ofrespondents found some reserves in environmental policy.b) Waste minimization and recyclingAs it is expressed in the light of environmental program objectives on the issue of wasteminimization, McDonald's is successfully fulfilling all its resolutions.5. Can your company save money by reducing the negative impact on environment?Based on the results the questionnaire survey up to 90% of the respondents considered ifmore business-oriented firms save the environment, it can also minimize their costs.6. Do you consider possible impacts on the environment by the development of newproducts and services?In the decision process of the company 40% of the surveyed managers consider all theeffects and potential environmental impacts related to products production andinnovation. On the other hand, 30% of managerial staff thinks that the development ofnew products should have some implications for the environment. 30% of respondentsare not aware of the possible production effects on the environment.Trade policy:7. Has your company methods to determine the quality of all its contracts, negotiationsand promotion?90% of respondents think that the company has quality measures for consumerprotection and provides only truthful information about their products. Conversely 10%of the managers expressed disapproval with these methods and measures, and requiressome improvements.8. Does your company provide clear and accurate information, products and serviceslabeling?80% of respondents are of the opinion that McDonald's treated fairly and responsibly forits business partners as well as consumers and suppliers. 20% of respondents do not haveknowledge about the impacts of firm trade policy.9. Does your company provide timely payment of invoices for the suppliers?78% of respondents consider their relationships with supplier partners to be very fair.Opposite view have 22% of respondents who were unable to comment on this issue.10. Does your firm register and resolve consumer's, supplier's and business partner'scomplaints about your company?Since the company is focused on the needs and desires of its customers, trying to meettheir needs in each direction, hence their complaints, suggestions and recommendationsaddressed immediately.97
Policy to the community:11. Does your company offer education or job training opportunities to people from thelocal community? (eg, apprenticeships or work experience for young people ordisadvantaged groups?)The majority of respondents believe that McDonald's company provides training toyoung people, as well as for some disadvantaged groups (disabled, mothers withchildren, etc.). On the other hand, 30% of managers has the opposite view and believethat relations with the community would need to be improved. Other respondents did notknow to specify his reply.12. Does your company regularly provide financial support for projects and communityactivities? (charity donations, grants, sponsorship ...)Staff in leadership positions considered the financial support for local community to beexcellent. 10% of surveyed respondents do not know what activities the companysupports.Company Value:13. Have you clearly defined your business value and management principles?All interviewed respondents agreed that the company has clearly defined its values andpriorities.14. Do you communicate your company's value to customers, business partners,suppliers and other stakeholders? (eg, business presentations, marketing materials orinformal communications)Half of respondents think that the company's values are well engraved into the customer,business partners and suppliers consciousness. 30% of the McDonald's managers believethat there are measures to get the values into the consciousness of these groups. 20% donot know whether the participating groups are sufficiently aligned with those value.15. Do your employees know the company's value and its management principles?The bulk of the respondents is identical with the view that a company's employees arefamiliar with the management principles and company value. 20% of employees see thegaps in knowledge about the values of company.16. Does your company train workers about the importance of your company's value andprinciples of management?90% of interested respondents considered staff training to be important. 10% ofrespondents, however, has another view. That percentage also expressed that it would benecessary to pay greater attention to staff training.98
ConclusionAs we can see there are many benefits that CSR offer to organizations. But the problemstill remains - detection, quantification and assessment of these benefits. The mainadvantages offered by the implementation of CSR throughout society include preservingnatural resources and ecosystem or improving quality of life.Benefits of implementing the concept of CSR within an organization can be divided intomoral and economic. Moral benefits are non-financial nature, but in the longer term theycan make a positive impact on management and financial resources of the organization.Moral benefits bring rarely gains for the organization immediately it does not mean thatthey are not important. Such benefits can include increasing brand value, reputationimproving, natural resources preserving, enhancing human capital and building crediblerelationships with suppliers and customers. The economic benefits include better accessto capital through socially responsible investing, reducing costs in the context of goodenvironmental practice and improve employee productivity by increasing theirsatisfaction and skills.References1. BUSSARD, A. – NARKUŠ, M. – BUNČÁK, M. – MARČEK, E.: CorporateSocial Responsbility (Spoločensky zodpovedné podnikanie). FoundationIntegra, Foundation Pontis, PANET, Bratislava 2005.2. CARROLL, A. B.: ‘A Three-Dimensional Conceptual Model of CorporatePerformance,’ Academy of Management Review, 1979. In: Carrol A.B.:A Guide to Corporate Social Responsibility (CSR)3. ARCHIE, B. CARROLL, ‘A Three-Dimensional Conceptual Model ofCorporate Performance,’ Academy of ManagementReview, 1979, In: CarrolA.B.: A Guide to Corporate Social Responsibility (CSR)4. CSR Europe: European Roadmap for Businesses, Towards a Sustainable andCompetitive Enterprise, Dostupné na http://www.csreurope.org/pages/en//roadmap.html5. SMITH, S.: Navigating The Stakeholder Relations Continuum. In: LeadingPerspectives, 2004. p.: 18 – 19.6. TRNKOVÁ, J.: What does it mean Corporate Social Responsibility? (Coznamená společenská odpovědnost firem?). AISIS, 2005.7. FRIEDMAN, M.: The Social Responsibility of Business is to Increase itsProfits, The New York Times Magazine, 13. september 19708. KLEIN, N.: No Logo: Taking Aim at the Brand Bullies. Canada, 2000.9. CONROY, M.: Branded! How the 'Certification Revolution' is TransformingGlobal Corporations, New Society Publisher, 2007. ISBN: 978086571579099
SummarySocial responsibility and ethics has become the key of marketing just when it alsobecomes the topic of customer interest and organization Corporate Social Responsibilitybecomes a tool to satisfy customer requirements. This era occurred when customersgained greater access to information about the organizations practices and there alsogrew a number of global environmental and social problems. Organizations behavior inthe broadest sense began to have an impact on how people perceive their products andservices.That social responsibility has become one of the major trends in marketing does notmean that it's the only way to achieve success in the short term. Marketers may get intosituations where they will face the choice dilemma between profitability and customers'desire for social benefit. "Contact addressIng. Zuzana Lušňáková, PhD.,Department of Marketing, Faculty of Economics and Management,Slovak University of Agriculture,Tr. A. Hlinku 2,949 76 Nitra, Slovakia,tel. 00421 37 641 4171,e-mail: zuzana.lusnakova@fem.uniag.sk100
5 (54) 2011Piotr MisztalDług publiczny i wzrost gospodarczy w krajachczłonkowskich Unii EuropejskiejPublic debt and economic growthin the European Union countriesStreszczeniePodstawowym celem artykułu jest analiza związków między długiem publicznymi wzrostem gospodarczym w Unii Europejskiej w okresie 2000-2010. Artykuł składa się z dwóchczęści. Pierwsza cześć dotyczy analizy teoretycznej dotyczącej współzależności między długiempublicznym i wzrostem gospodarczym z uwzględnieniem przyczyn i czynników determinujących tezależności. W następnej części artykułu zbadano związek między długiem publicznym i wzrostemgospodarczym w UE przy pomocy modelu wektorowej autoregresji (VAR). Dokonano oszacowaniawspółczynników elastyczności długu publicznego na zmiany PKB oraz współczynnikówelastyczności PKB na zmiany długu publicznego na podstawie funkcji odpowiedzi impulsowych.Następnie przeprowadzono dekompozycję wariancji długu publicznego i PKB w celu oszacowaniawpływu tych czynników na zmienność odpowiednio PKB i długu publicznego.1. WprowadzenieProblematyka oddziaływania długu publicznego na koniunkturę gospodarcząbyła i wciąż jest jednym z przedmiotów debaty wśród wielu teoretyków i praktykówekonomii. W licznej literaturze ekonomicznej dotyczącej tego zagadnienia, rozważaniateoretyczne i empiryczne można podzielić generalnie na trzy główne grupy.Pierwszą grupę analiz stanowią prace keynesistów, w których podkreśla się, żedeficyt budżetowy oraz związany z nim dług publiczny mają pozytywny wpływ naaktywność gospodarczą w kraju, w szczególności poprzez działanie mnożnika wydatkówbudżetowych. Przedstawiciele szkoły keynesowskiej dostarczają argumentówwskazujących na występowanie tzw. efektu uzupełniania (crowd-in effect) wydatkówprywatnych przez wydatki państwowe na skutek deficytu budżetowego i długupublicznego wywołanego ekspansywną polityką fiskalną. Twierdzą oni dalej, żezazwyczaj deficyt budżetowy i dług publiczny prowadzą do wzrostu produkcji krajowej,co sprawia, że inwestorzy prywatni bardziej optymistycznie postrzegając przyszłąsytuację gospodarczą zwiększając przy tym swoje inwestycje.Przeciwne spojrzenie na kwestie deficytu budżetowego oraz długu publicznegomają przedstawiciele szkoły neoklasycznej, którzy argumentują, że deficyt budżetowyi dług publiczny mogą mieć szkodliwe skutki dla wzrostu gospodarczego.Przedstawiciele szkoły neoklasycznej analizują wydatki konsumpcyjne gospodarstwdomowych w ciągu ich całego cyklu życia. Uważają oni, że państwo odnotowującdeficyt budżetowy przesuwa tym samym ciężar podatków na przyszłe pokolenia, co101
prowadzi do zwiększenia bieżącej konsumpcji. Przy założeniu występowania pełnegozatrudnienia przedstawiciele szkoły neoklasycznej argumentują, że zwiększonakonsumpcja oznacza spadek rozmiarów oszczędności. Stopy procentowe muszą zatemwzrosnąć w celu przywrócenia równowagi na rynku kapitałowym. Z kolei, wyższe stopyprocentowe prowadzą do spadku rozmiarów inwestycji prywatnych 1 .Natomiast, zwolennicy koncepcji równoważności ricardiańskiej są zdania, żedeficyt budżetowy i dług publiczny są neutralne dla wzrostu gospodarczego. Zgodniez tą koncepcją bieżący deficyt budżetowy, wynikający na przykład ze zmniejszeniapodatków musi być spłacony w przyszłości na przykład poprzez podwyższeniepodatków, pozostawiając w ten sposób stopy procentowe i inwestycje prywatne naniezmienionym poziomie 2 .Te trzy kontrastujące ze sobą podejścia do problematyki deficytu budżetowegoi długu publicznego przyczyniają się do podejmowania wielu dyskusji w kraju i zagranicą na temat roli deficytu budżetowego i długu publicznego w procesie wzrostugospodarczego.2. Deficyt budżetowy, dług publiczny i wzrost gospodarczy w ujęciumodelowymDeficyt budżetowy zazwyczaj jest definiowany jako różnica między ogólnymiwydatkami państwa, włączając odsetki od długu publicznego oraz dochodami państwa.Natomiast zgodnie z bardziej złożoną definicją, deficyt budżetowy to różnica międzywielkością długu publicznego na koniec danego roku i wielkością długu publicznego nakoniec roku poprzedniego. Te dwie definicje są równoważne, jeżeli dług publicznyzdefiniuje się, jako wartość wyemitowanych obligacji.Pojawienie się deficytu budżetowego implikuje, że dług publiczny wzrasta. Aleponieważ PKB również wzrasta, stosunek długu publicznego do PKB może ulec zmianielub pozostać na stałym poziomie. Zatem, to czy stosunek długu publicznego do PKBzmienia się czy też pozostaje na niezmienionym poziomie zależy od tego, czy stopawzrostu zadłużenia krajowego jest większa lub mniejsza niż stopa wzrostu PKB.Systematycznie rosnący stosunek zadłużenia krajowego do PKB stanowi zagrożenie dlakraju, że dług publiczny wejdzie na ścieżkę niezrównoważonego wzrostu, prowadzącądo niewypłacalności kraju. Nawet, jeżeli stosunek długu publicznego do PKB niewzrasta gwałtownie to i tak wysoki stosunek zadłużenia do PKB ma poważnei niekorzystne konsekwencje dla kraju, związane chociażby z rosnącym kosztem obsługidługu. Ważne jest więc zrozumienie przyczyn wzrostu wskaźnika długu publicznego doPKB i znalezienie optymalnej wielkości tego wskaźnika dla kraju. W tym celuniezbędne jest odróżnienie standardowego deficytu budżetowego od podstawowegodeficytu budżetowego. Podstawowy (pierwotny) deficyt budżetowy jest równy1 Y. Keho: Budget deficits and economic growth: causality evidence and policy implications for WAEMUcountries, “European Journal of Economics, Finance and Administrative Sciences” 2010, Issue 18.2 A. S. Saleh: The budget deficit and economic performance: a survey, “University of Wollongong, Faculty ofCommerce Economics Working Papers” 2003, No 78.102
standardowemu deficytowi budżetowemu pomniejszonemu o koszt obsługi długupublicznego 3 .Zatem, standardowy deficyt budżetowy oraz podstawowy deficyt budżetowymożna zapisać w formie poniższych wyrażeń, jako:SB = G + ( i ⋅ PD) −T(1)PB = G −T(2)gdzie:SB – standardowy deficyt budżetowy;PB – podstawy deficyt budżetowy;PD – dług publiczny;G – wydatki państwa;i – stopa oprocentowania długu publicznego;T – dochody państwa (podatkowe i niepodatkowe).Stąd, na podstawie powyższych wzorów można zapisać wskaźnik długupublicznego do PKB w następującej postaci:PDGDP⎛ G − T= ⎜⎝ GDP⎞⎟⎠⎛ Δ GDP+ ⎜ i −⎝ GDP⎞ ⎛⎟ ⋅ ⎜⎠ ⎝gdzie:GDP – produkt krajowy brutto.Zgodnie z powyższym zapisem, dług publiczny do PKB to suma wskaźnikapodstawowego deficytu budżetowego w stosunku do PKB oraz różnicy między stopąprocentową i stopą wzrostu PKB pomnożoną przez stosunek długu publicznego do PKB.Zatem, zgodnie z powyższym równaniem stosunek długu publicznego do PKB wzrastawówczas, gdy w warunkach występowania podstawowego deficytu budżetowego stopaoprocentowania długu publicznego jest większa od stopy wzrostu PKB. W celuzmniejszenia wskaźnika długu publicznego do PKB musi pojawić się nadwyżkaw podstawowym bilansie budżetu państwa (większe dochody niż wydatki państwowe)lub PKB musi wzrastać szybciej niż koszt obsługi długu publicznego.3. Dług publiczny a wzrost gospodarczy w świetle wyników analizempirycznychNiektórzy autorzy, tacy jak Modigliani, Diamond i Saint-Paul wskazują, żezwiększenie długu publicznego zawsze przyczynia się do spadku tempa wzrostugospodarczego. Z kolei, Patillo, Romer i Weil stwierdzili, że niski poziom długupublicznego wpływa dodatnio na wzrost gospodarczy, zaś wysokie rozmiary zadłużeniaoddziaływują negatywnie na tempo wzrostu gospodarczego kraju 4 .Ponadto, wyniki badań empirycznych przeprowadzonych przez Kumar i Woo nagrupie krajów obejmującej zarówno gospodarki wysoko rozwinięte, jak równieżPDGDP⎞⎟⎠(3)3 M. Feldstein: Budget deficits and national debt, “K. Jha Memorial Lecture at the Reserve Bank of India inMumbai” 2004, No 12.4 F. Modigliani: Long-run implications of alternative fiscal policies and the burden of the national debt,“Economic Journal” 1961, No 71; P. Diamond: National debt in a neoclassical growth model, “AmericanEconomic Review” 1965, No 55; G. Saint-Paul: Fiscal policy in an endogenous growth model, “QuarterlyJournal of Economics” 1992, No. 107; C. Patillo, D. Romer, D. N. Weil: What are the channels through whichexternal debt affects growth?, “IMF Working Paper” 2004, No. 15.103
ozwijające się wskazują na występowanie odwrotnej zależności między początkowymdługiem publicznym i wzrostem gospodarczym w okresie 1970-2007 5 . Rezultaty ichanaliz potwierdzają, że wzrostowi wskaźnika długu publicznego do PKB o 10 p.p.towarzyszył spadek realnego PKB per capita o około 0,2 p.p. w ciągu jednego roku.Schclarek analizując łącznie 59 krajów rozwijających się i 24 kraje wysokorozwinięte gospodarczo stwierdził, że w przypadku krajów rozwijających się zawszewystępuje ujemny i istotny związek między całkowitym zadłużeniem państwai wzrostem gospodarczym. Z kolei, w odniesieniu do krajów wysoko rozwiniętychgospodarczo Schclarek nie znalazł istotnej zależności między długiem publicznymi wzrostem gospodarczym 6 .Z kolei, Ferreira analizując związek miedzy wzrostem gospodarczym i długiempublicznym przy pomocy modelu wektorowej autoregresji oraz testu przyczynowościGrangera potwierdził występowanie związku miedzy wzrostem gospodarczym per capitai długiem publicznym w stosunku do PKB w krajach członkowskich OECD w okresie1988-2001. Ponadto stwierdził on, iż zależność ta jest zawsze dwukierunkowa 7 .Keho badał związek przyczynowo-skutkowy między deficytem budżetowymi wzrostem gospodarczym w siedmiu wybranych krajach Afryki Zachodniej w okresie1980-2005 za pomocą modelu VAR oraz testu przyczynowości Grangera. Uzyskanewyniki badań okazały się niejednoznaczne. W przypadku trzech krajów nie stwierdzonowystępowania związku przyczynowo-skutkowego między deficytem budżetowymi wzrostem gospodarczym. Wyniki badań ujawniły również w przypadku trzechkolejnych krajów występowanie dwukierunkowej, ujemnej zależności między deficytembudżetowym i wzrostem gospodarczym 8 .Jednocześnie należy podkreślić, iż wiele analiz empirycznych przeprowadzonychw ciągu ostatnich kilkunastu lat wskazuje na występowanie nieliniowej zależnościmiędzy długiem publicznym i wzrostem gospodarczym 9 . Mianowicie, wyniki tych badańwskazują, że dług publiczny pozytywnie wpływa na wzrost gospodarczy, lecz jedynie dopewnego poziomu długu po przekroczeniu, którego wpływ długu publicznego na PKBjest negatywny. Do podobnych wniosków doszli Elbadawi, Ndulu i Ndung'u analizujączależności między długiem publicznym i PKB w 26 krajach Afryki subsaharyjskiejw okresie 1980-1994 10 . Wykazali oni bowiem, że dług publiczny pozytywnieoddziaływał na wzrost gospodarczy w tych krajach, ale jedynie do poziomu 97% PKB.Z kolei, Pattillo, Poirson, Ricci badając 93 kraje rozwijające się w okresie 1972-1998uzyskali wyniki wskazujące na pozytywny wpływ długu publicznego na wzrostgospodarczy jedynie do poziomu 35-40% PKB 11 .5 M. S. Kumar, J. Woo: Public debt and growth, “IMF Working Paper” 2010, No 174.6 A. Schclarek: Debt and economic growth in developing and industrial countries, “Lund University WorkingPapers” 2005, No 34.7 C. Ferreira: Public debt and economic growth: a granger causality panel data approach, “TechnicalUniversity of Lisbon Working Papers” 2009, No 24.8 Y. Keho: Budget deficits and economic growth: causality evidence and policy implications for WAEMUcountries, “European Journal of Economics, Finance and Administrative Sciences” 2010, Issue 18.9 W. Moore, T. Chrystol: A meta-analysis of the relationship between debt and growth, “Munich PersonalRePEc Archive Paper” 2008, No. 21474.10 I. Elbadaw, B. Ndulu, N. Ndung'u: Debt overhang and economic growth in Sub-Saharan Africa, in: Z. Iqbal,R. Kanbur (eds.), External finance for low-income countries, International Monetary Fund, Washington 2007.11 C. Pattillo, H. Poirson, L. Ricci: External debt and growth, “IMF Working Paper” 2002, No 02/69.104
Podobne analizy prowadzili Smyth i Hsing, którzy analizowali wpływ długupublicznego na wzrost gospodarczy w USA w latach 80-tych i 90-tych XX wieku. Otóż,wspomniani autorzy szacowali optymalny poziom długu publicznego dla gospodarkiamerykańskiej, tzn. taki poziom długu publicznego, który maksymalizuje wzrostgospodarczy. Ich wyniki badań wskazywały, iż optymalny poziom długu publicznegow stosunku do PKB dla gospodarki USA wynosił w badanym okresie 38,4% 12 .Natomiast Reinhart i Rogoff analizując 44 kraje wysoko rozwinięte gospodarczoi rozwijające się w okresie ostatnich dwustu lat doszli do wniosku, że wysokiemupoziomowi długu publicznego w stosunku do PKB (powyżej 90%) towarzyszył niższypoziom wzrostu gospodarczego zarówno w krajach rozwiniętych gospodarczoi rozwijających się. Ponadto, w przypadku krajów rozwijających się stosunkowo wysokipoziom długu zagranicznego w stosunku do PKB (powyżej 60%) negatywnieoddziaływał na wzrost gospodarczy 13 .4. Dług publiczny i wzrost gospodarczy w UE w okresie 2000-2010Stosunkowo wysokie rozmiary zadłużenia publicznego w wielu krajachczłonkowskich UE przyczyniły się do podejmowania licznych dyskusji dotyczącychwpływu długu publicznego na wzrost gospodarczy. W celu analizy związkuprzyczynowo-skutkowego pomiędzy zmianami PKB i długu publicznego w krajachczłonkowskich UE w okresie 2000-2010 wykorzystano model wektorowej autoregresji(VAR) zaproponowany przez Ferreira i przedstawiający się poniższymi wyrażeniami 14 :GDPPDi, ti,t==k = 1p∑p∑α GDPkχ PDi,t − k++∑k i,t − kk = 1 k = 1pp∑k = 1kβ PDkδ GDPgdzie:PD – dług publiczny wyrażony w walucie krajowej;GDP – produkt krajowy brutto wyrażony w walucie krajowej;μ , - składniki resztowe;t – okres analizy;k – liczba opóźnień zmiennychWszystkie wymienione powyżej szeregi czasowe miały częstotliwość kwartalnąi obejmowały okres od pierwszego kwartału 2000 roku do pierwszego kwartału 2010roku. Z szeregu czasowego wyodrębniono czynnik sezonowy, ponieważ występowaniew szeregu czasowym czynnika sezonowego mogłoby prowadzić do problemóww interpretowaniu zmian danego zjawiska w analizowanym okresie. W tym celuwykorzystano procedurę X12-ARIMA.Przed dokonaniem estymacji modelu, niezbędne było określenie stacjonarnościanalizowanych szeregów czasowych. W tym celu wykorzystano rozszerzony testDickeya-Fullera – ADF (Augmented Dickey-Fuller). Wśród analizowanych danychi,t − ki,t − k+ μ+ υi,ti,t(4)(5)12 D. J. Smyth, Y. Hsing: In search of an optimal debt ratio for economic growth, “Contemporary EconomicPolicy” 1995, Vol. 13, Issue 4.13 C. M. Reinhart, K. S. Rogoff: Growth in a time of debt, “NBER Working Paper” 2010, No 15639.14 C. Ferreira: Public debt and economic growth: a granger causality panel data approach, “TechnicalUniversity of Lisbon Working Papers” 2009, No 24.105
wykorzystanych w dalszej części opracowania znalazły się szeregi czasowe o stopniachintegracji 0 i 1. Brak stacjonarności szeregów czasowych wymusił modyfikację postacifunkcyjnej modelu, w celu doprowadzenia zmiennych do stacjonarności. Modyfikacja tapolegała na zastąpieniu wielkości analizowanych zmiennych przez ich pierwsze różnice.W analizie przyjęto jeden okres opóźnień między zmiennymi objaśniającymi,a zmienną objaśnianą (jeden kwartał). Wyboru rzędu opóźnień dokonano zgodniez wynikami kryteriów informacyjnych modelu Akaike, Schwartza-Bayesiana orazHannana-Quinna. Według tych kryteriów największą pojemność informacyjną miałmodel z jednym opóźnieniem. Należy również podkreślić, że ze względu na brakwystępowania kointegracji między zmiennymi modelu, nie było możliwościrozszerzenia i przekształcenia strukturalnego modelu VAR w wektorowy model korektybłędem.Analizując wskaźniki długu publicznego do PKB w UE można zauważyć, iżwskaźniki te zwiększyły się znacząco w ciągu ostatnich dziesięciu lat. O ile średni udziałdługu publicznego w PKB w 27 krajach członkowskich UE wynosił na początku 2000roku 65%, to na początku 2010 roku stosunek ten wyniósł już ok. 75%. Największymiwskaźnikami długu publicznego w stosunku do PKB charakteryzowały się w 2010 rokutakie kraje jak Grecja, Włochy oraz Belgia, zaś najmniejszymi Estonia, Luksemburgoraz Bułgaria.Rys. 1. Stosunek długu publicznego do PKB w krajach członkowskich UE w latach 2000 i 2010 [w %]Źródło: Opracowanie własne na podstawie danych Eurostatu.Również rozmiary PKB na jednego mieszkańca istotnie zwiększyły się w UEw ciągu ostatnich kilku lat. O ile średni poziom PKB per capita w 27 krajachczłonkowskich UE wynosił na początku 2000 roku 19 tys. euro, to na początku 2010roku wartość ta wyniosła już blisko 24 tys. euro. Największymi rozmiarami PKB namieszkańca charakteryzowały się w 2010 roku Luksemburg, Dania oraz Irlandia zaśnajmniejszymi Rumunia, Bułgaria, Litwa i Łotwa.106
Rys. 2. Rozmiary PKB na jednego mieszkańca w krajach członkowskich UE w latach 2000 i 2010 [w euro]Źródło: Opracowanie własne na podstawie danych Eurostatu.Z teoretycznego punktu widzenia, słabiej rozwinięte gospodarczo krajepowinny charakteryzować się generalnie wyższym poziomem długu publicznegow stosunku do PKB, niż kraje wyżej rozwinięte, ze względu na ograniczenia finansoweoraz potrzeby gospodarcze krajów. Jednakże, analizując dane dotyczące udziału długupublicznego w PKB w krajach członkowskich UE można zauważyć wyższe udziałydługu publicznego w PKB w relatywnie wyżej rozwiniętych gospodarczo krajachczłonkowskich UE. Sytuacja ta może wskazywać na pozytywny wpływ długupublicznego na poziom rozwoju gospodarczego tych krajów lub na pozytywny wpływwzrostu gospodarczego na rozmiary długu publicznego. Jednakże, doświadczenia wielukrajów, zarówno wysoko rozwiniętych gospodarczo, jak również rozwijających sięwskazują, że zbyt wysoka relacja długu publicznego do PKB może spowodować wzrosturyzyka inwestycyjnego w kraju, odpływ kapitału zagranicznego i w konsekwencjideprecjację waluty krajowej. Oczywiście, sytuacja ta w negatywny sposób wpłynie natempo rozwoju gospodarczego kraju.W celu określenia związku przyczynowo-skutkowego między średnimpoziomem długu publicznego i PKB w UE w okresie 2000-2010 niezbędne byłooszacowanie parametrów strukturalnych modelu VAR. Wyniki oszacowania parametrówmodelu przedstawiono w poniższej tablicy.107
Tabl. 1. Wyniki oszacowania parametrów strukturalnych modelu VARRównanie 1: GDPWspółczynnik Błąd stand. t-Studenta wartość pGDP_1 1,32922 0,16727 7,9472
Rys. 3. Funkcja odpowiedzi impulsowej PD i GDP w UE w okresie 2000-2010GDP -> GDP0.0190.0180.0170.0160.0150.0140.0130.0120 2 4 6 8 10 12 14 16 18 20okresyGDP -> PD0.0180.0170.0160.0150.0140.0130.0120.0110.010 2 4 6 8 10 12 14 16 18 20okresy0-0.005-0.01-0.015-0.02PD -> GDP0.010.0050-0.005-0.01-0.015PD -> PD-0.025-0.020 2 4 6 8 10 12 14 16 18 200 2 4 6 8 10 12 14 16 18 20okresyokresyŹródło: Opracowanie własne.Na podstawie powyższych rysunków zauważono, iż szokowy wzrost PKBo jednostkę prowadził do stopniowego wzrostu PKB w ciągu kolejnych dwudziestukwartałów od momentu wystąpienia szoku, a w dalszej kolejności do stabilizacji.Z kolei, wzrost rozmiarów PKB prowadził do stopniowego wzrostu rozmiarów długupublicznego w ciągu dwudziestu kolejnych kwartałów od wystąpienia szoku, a następniedo stopniowej stabilizacji. Inaczej wyglądała sytuacja w przypadku reakcji PKB na szokw postaci zmiany rozmiarów długu publicznego. Otóż, wzrost rozmiarów długupublicznego prowadził do stopniowego spadku rozmiarów PKB w ciągu kolejnychdwudziestu kwartałów, a w dalszej kolejności do stopniowej stabilizacji. Natomiastwzrost rozmiarów długu publicznego prowadził do natychmiastowego wzrostu długupublicznego a następnie do jego stopniowego spadku w trakcie kolejnych dwudziestukwartałów.Ostatnim etapem analizy była dekompozycja wariancji składnika resztowegodługu publicznego oraz PKB, w celu oszacowania wpływu zmian tych czynników nakształtowanie się zmienności odpowiednio PKB i długu publicznego w UE.Tabl. 2. Dekompozycja wariancji dla zmiennych PD i GDP w UE w okresie 2000-2010Dekompozycja wariancji dla zmiennej PD Dekompozycja wariancji dla zmiennej GDPokres PD GDP PD GDP2 24,3 75,7 1,8 98,24 12,5 87,5 9,1 90,96 11,9 88,1 17,1 82,9109
8 16,4 83,6 24,1 75,910 22,1 77,9 29,7 70,312 27,5 72,5 34,2 65,814 32,1 67,9 37,7 62,316 35,8 64,2 40,6 59,418 38,9 61,1 42,9 57,120 41,4 58,6 44,8 55,2Źródło: Opracowanie własne.Na podstawie danych z powyżej tablicy można zauważyć, że zmiany PKBwyjaśniały około 87% zmian długu publicznego w UE po upływie czwartego kwartałuod momentu wystąpienia szoku oraz blisko 59% zmian długu publicznego po upływiedwudziestego kwartału. Dla porównania, zmiany rozmiarów długu publicznego w UEwyjaśniały około 9% zmian PKB po upływie czwartego kwartału oraz blisko 45% zmianPKB po upływie dwudziestego kwartału.Wpływ długu publicznego na wzrost gospodarczy oraz oddziaływanie wzrostugospodarczego na zmiany długu publicznego znacząco różniły się w poszczególnychkrajach członkowskich UE. Mianowicie, największe wartości bezwzględnewspółczynników oddziaływania długu publicznego na zmiany PKB odnotowanow takich krajach jak Hiszpania i Irlandia, zaś najmniejsze wartości na Łotwie. Z kolei,największe wartości bezwzględne współczynników elastyczności PKB na zmiany długupublicznego stwierdzono w Finlandii, zaś najmniejsze w Hiszpanii, Irlandii, Słowenii,Szwecji, Danii, Holandii i na Cyprze.Tabl. 3. Współczynniki elastyczności długu publicznego na zmiany PKB oraz elastyczności PKB na zmianydługu publicznego w krajach członkowskich UE w okresie 2000-2010Kraje GDP → PD PD → GDPBelgia 0,01 -0,02Bułgaria -0,04 0,01Czechy 0,02 -0,07Dania -0,06 0,00Niemcy 0,02 0,05Estonia 0,08 0,05Irlandia -0,29 0,00Grecja 0,07 0,06Hiszpania -0,32 0,00Francja 0,03 0,06Włochy 0,05 0,06Cypr -0,04 0,00Łotwa 0,00 -0,11Litwa 0,05 0,09110
Luksemburg 0,02 0,07Węgry 0,09 -0,01Malta 0,01 0,32Holandia -0,01 0,00Austria 0,01 0,15Polska -0,01 0,06Portugalia 0,03 0,03Rumunia -0,02 0,09Słowenia -0,24 0,00Słowacja 0,03 0,17Finlandia 0,03 -0,49Szwecja -0,12 0,00Wielka Brytania 0,02 0,10Źródło: Opracowanie własne.Analizując obliczone współczynniki elastyczności PKB na zmiany długupublicznego na tle rozmiarów długu publicznego w stosunku do PKB w poszczególnychkrajach członkowskich UE można dostrzec pewne prawidłowości w tym zakresie. Otóż,ogólnie rzecz ujmując, największy, dodatni wpływ długu publicznego na rozmiary PKBstwierdzono w przypadku tych krajów członkowskich UE, w których udział długupublicznego w PKB był na poziomie zbliżonym do 65%. Zatem, właśnie taki udziałdługu publicznego w PKB okazał się być optymalnym z punktu widzenia oddziaływaniadługu na wzrost gospodarczy.Rys. 4. Współczynniki elastyczności PKB na zmiany długu publicznego a rozmiary długu publicznegow stosunku do PKB w krajach członkowskich UE w okresie 2000-20100,4Współczynnik elastyczności PKB na zmiany długupublicznego0,30,20,10,0-0,1-0,2-0,3-0,4-0,5Źródło: Opracowanie własne.-0,60 20 40 60 80 100 120Dług publiczny do PKB w %111
Z kolei, uwzględniając współczynniki elastyczności długu publicznego nazmiany PKB oraz rozmiary długu publicznego w stosunku do PKB w poszczególnychkrajach członkowskich UE nie stwierdzono istotnej zależności między tymi zmiennymi.Jednakże można zauważyć, iż ujemne wartości współczynników elastyczności długupublicznego na zmiany PKB stwierdzono w przypadku tych krajów, w których udziałdługu publicznego w PKB kształtował się w przedziale 20-60%.Rys. 5. Współczynniki elastyczności długu publicznego na zmiany PKB a rozmiary długu publicznegow stosunku do PKB w krajach członkowskich UE w okresie 2000-2010Współczynnik elastyczność długu publicznego na zmiany PKB0,150,100,050,00-0,05-0,10-0,15-0,20-0,25-0,30-0,350 20 40 60 80 100 120Dług publiczny do PKB w %Źródło: Opracowanie własne.Reasumując, optymalny poziom długu publicznego w stosunku do PKB, wyrażającynajwiększy, dodatni jego wpływ na wzrost gospodarczy w krajach członkowskich UEbył na poziomie zbliżonym do 65%. Natomiast ujemny wpływ wzrostu gospodarczegona poziom długu publicznego stwierdzono w krajach członkowskich UE, w których długpubliczny wynosił od 20% do 40% PKB.Uwzględniający prognozy zmian długu publicznego do 2020 roku w wybranychkrajach rozwiniętych gospodarczo i tzw. gospodarkach wschodzących (emergingmarkets), dokonane przez Deutsche Bank należy stwierdzić, iż spośród badanych krajówczłonkowskich UE pozytywnego wpływu długu publicznego na tempo wzrostugospodarczego doświadczą w szczególności kraje wschodzące, takie jak Polska, Czechy,Węgry i Rumunia, w których dług publiczny będzie w 2020 roku najbardziej zbliżony dooptymalnego.Tabl. 4. Macierz prognozy długu publicznego do 2020 roku w wybranych krajach członkowskich UERozwinięte gospodarczo kraje członkowskie UEUdział długupublicznego w PKB w%/TendencjaNiski udział długupublicznego w PKB(poniżej 73,7%)Średni udział długupublicznego w PKB(73,7%-131,4%)Wysoki udział długupublicznego w PKB(powyżej 131,4%)Tendencja spadkowa Dania, Szwecja Belgia WłochyStabilny poziomNiemcy, Irlandia,Hiszpania112
Tendencja rosnącaUdział długupublicznego w PKB w%/TendencjaTendencja spadkowaStabilny poziomFrancja, Słowacja,Wielka BrytaniaWschodzące kraje członkowskie UENiski udział długu Średni udział długupublicznego w PKB publicznego w PKB(poniżej 20%)(20%-52,2%)Grecja, PortugaliaWysoki udział długupublicznego w PKB(powyżej 52,2%)PolskaCzechy, Węgry,Tendencja rosnącaRumuniaŹródło: Public debt in 2020, “Deutsche Bank Research” 2010, March 24.Natomiast – zgodnie z danymi przedstawionymi w powyższej tablicy –większość rozwiniętych gospodarczo krajów członkowskich UE odnotuje ujemny wpływdługu publicznego na wzrost gospodarczy w 2020 roku, ponieważ poziom długupublicznego w tych krajach będzie znacząco przekraczał jego optymalne rozmiary.PodsumowanieNa podstawie przeprowadzonej analizy dotyczącej związku między długiempublicznym i wzrostem gospodarczym w UE w okresie od pierwszego kwartału 2000roku do pierwszego kwartału 2010 roku można wskazać na kilka kluczowych wniosków.Po pierwsze, stwierdzono, iż jednym z czynników, który w największymstopniu determinował tempo wzrostu PKB w UE w okresie 2000-2010 były zmianydługu publicznego. Mianowicie, współczynnik oddziaływania długu publicznego nawzrost gospodarczy wyniósł -0,3. Z drugiej strony, jednym z czynnikówdeterminujących rozmiary długu publicznego w UE w okresie 2000-2010 były zmianyPKB. W tym przypadku współczynnik oddziaływania PKB na zmiany długupublicznego w UE wyniósł 0,4. Obliczono również, że zmiany PKB wyjaśniaływ znacznie większym stopniu zmiany długu publicznego, niż stopień, w którym zmianydługu publicznego wyjaśniały zmiany PKB w UE.Po drugie, stwierdzono, że współczynniki oddziaływania długu publicznego nawzrost gospodarczy oraz oddziaływania wzrostu gospodarczego na zmiany długupublicznego znacząco różniły się w poszczególnych krajach członkowskich UE.Największe wartości bezwzględne współczynników oddziaływania długu publicznegona zmiany PKB odnotowano w Hiszpanii i Irlandii, zaś najmniejsze wartości na Łotwie.Natomiast, największe wartości bezwzględne współczynników elastyczności PKB nazmiany długu publicznego stwierdzono w Finlandii, zaś najmniejsze w Hiszpanii,Irlandii, Słowenii, Szwecji, Danii, Holandii i na Cyprze.Po trzecie, stwierdzono, iż największy, pozytywny wpływ długu publicznego narozmiary PKB miał miejsce w tych krajach członkowskich UE, w których udział długupublicznego w PKB był na poziomie zbliżonym do 65%. Natomiast nie stwierdzonoistotnej zależności między poziomem współczynników elastyczności długu publicznegona zmiany PKB oraz udziałem długu publicznego w PKB w poszczególnych krajachczłonkowskich UE, przy czym zauważono występowanie ujemnych wartościwspółczynników elastyczności długu publicznego na zmiany PKB w tych krajach,w których udział długu publicznego w PKB wynosił od 20% do 60%.113
Literatura1. Diamond P.: National debt in a neoclassical growth model, “American Economic Review”1965, No 55.2. Elbadaw I., Ndulu B., Ndung'u N.: Debt overhang and economic growth in Sub-SaharanAfrica, in: Iqbal Z., Kanbur R. (eds.), External finance for low-income countries, InternationalMonetary Fund, Washington 1997.3. Feldstein M.: Budget deficits and national debt, “K. Jha Memorial Lecture at the ReserveBank of India in Mumbai” 2004, No 12.4. Ferreira C.: Public debt and economic growth: a granger causality panel data approach,“Technical University of Lisbon Working Papers” 2009, No 24.5. Keho Y.: Budget deficits and economic growth: causality evidence and policy implications forWAEMU countries, “European Journal of Economics, Finance and Administrative Sciences”2010, Issue 18.6. Kumar M. S., Woo J.: Public debt and growth, “IMF Working Paper” 2010, No 174.7. Modigliani F.: Long-run implications of alternative fiscal policies and the burden of thenational debt, “Economic Journal” 1961, No 71.8. Moore W., Chrystol T.: A meta-analysis of the relationship between debt and growth, “MunichPersonal RePEc Archive Paper” 2008, No. 21474.9. Patillo C., Romer D., Weil D. N.: What are the channels through which external debt affectsgrowth?, “IMF Working Paper” 2004, No. 15.10. Pattillo C., Poirson, H., Ricci L.: External debt and growth, “IMF Working Paper” 2002, No02/69.11. Public debt in 2020,” Deutsche Bank Research” 2010, March 24.12. Reinhart C. M., Rogoff K. S.: Growth in a time of debt, “NBER Working Paper” 2010, No15639.13. Saint-Paul G.: Fiscal policy in an endogenous growth model, “Quarterly Journal ofEconomics” 1992, No. 107.14. Saleh A. S.: The budget deficit and economic performance: a survey, “University ofWollongong, Faculty of Commerce Economics Working Papers” 2003, No 78.15. Schclarek A.: Debt and economic growth in developing and industrial countries, “LundUniversity Working Papers” 2005, No 34.16. Smyth D. J. Hsing Y.: In search of an optimal debt ratio for economic growth, “ContemporaryEconomic Policy” 1995, Vol. 13, Issue 4.SummaryThe main aim of the article is to present the relationships between public debt and economicgrowth in the European Union in the period 2000-2010. The article consists of two parts. The firstpart deals with theoretical analysis of the relationships between public debt and economic growth,including reasons and factors determining these relationships. In the next part of article, there areexamined the relationships between public debt and gross domestic product in the EU by using theVector Autoregression Model (VAR). There are estimated elasticity coefficients of public debt toGDP and elasticity coefficients of GDP to public debt on the base of impulse response function.Then, there is made variance decomposition of the public debt and GDP in order to assess the impactof these factors on the variability of GDP and public debt respectively.Informacja o autorzeDr Piotr MisztalPolitechnika Radomska, Wydział EkonomicznyKatedra Międzynarodowych StosunkówGospodarczych i Integracji Regionalnejul. Chrobrego 31, 26-600 Radom; e-mail: p.misztal@pr.radom.pl114
5 (54) 2011Eugeniusz PudełkiewiczRefleksje wokół koncepcji marketingu w agrobiznesieReflections around the concept of marketing in agribusinessCelem opracowania jest zwrócenie uwagi na potrzebę rozwijania nowej dziedzinywiedzy, związanej z wykorzystaniem różnych typów i rodzajów współczesnych koncepcjimarketingowych w agrobiznesie.Potrzeba rozwijania nowej dziedziny określanej jako marketing w agrobiznesiewiąże się przede wszystkim z biznesową naturą, specyfiką i charakterem poszczególnychogniw agrobiznesu.Praktyczne zastosowania marketingu w agrobiznesie mają coraz większeznaczenie ze względu na konkurencyjność, innowacyjność i procesy globalizacji wewspółczesnym świecie.WstępAgrobiznes jest ważnym subsystemem dla wszystkich gospodarek świata, w tymtakże dla polskiej gospodarki narodowej 1 . Agrobiznes według A. Wosia możnarozpatrywać na trzy sposoby 2 :• jako wyodrębniony subsystem gospodarki narodowej,• jako dziedzinę aktywności podmiotów gospodarczych,• jako dziedzinę wiedzy i badań naukowych.Zaprezentowane podejście do agrobiznesu, jak sądzę, ma najbardziejwielowymiarowy, wszechstronny i uniwersalny charakter, w którym jednocześniezintegrowana działalność marketingowa może stać się istotnym i ważnymwyznacznikiem jego postępu i rozwoju.Opracowanie ma na celu rozpoznanie, identyfikację oraz uświadomienie potrzebywykorzystania różnych typów i rodzajów współczesnych koncepcji marketingowychw agrobiznesie, uwzględniając co najmniej sześć wzajemnie współzależnych ogniw.A więc:- zaopatrzenie w środki produkcji rolniczej (nawozy, paliwa, maszynyi urządzenia rolnicze, środki ochrony roślin itp.),- rolnictwo, rybołówstwo, leśnictwo,1 A. Woś, Agrobiznes. Makroekonomika, t.1, wyd. Key Text, Warszawa 1996.2 Tamże, s. 22.115
- przemysł spożywczy,- handel i dystrybucję,- konsumentów oraz- różnego rodzaju i charakteru usługi finansowo – ubezpieczeniowe, edukacyjno– szkoleniowe, weterynaryjne, logistyczno – transportowe itp.Marketing jako dziedzina wiedzy stosowanej w klasycznej formule4 elementowej (produkt, cena, dystrybucja, promocja) jest obecny we wszystkichwymienionych ogniwach agrobiznesu.Koncepcja agrobiznesu i gospodarki żywnościowej w perspektywiemarketingowejIstnieją istotne różnice między agrobiznesem a gospodarką żywnościową.Agrobiznes obejmuje znacznie szerszy zakres działania niż gospodarka żywnościowa.Gospodarka żywnościowa stanowi tą część agrobiznesu, która zajmuje sięwytwarzaniem żywności i tworzeniem warunków jej dostępności dla ogółuspołeczeństwa. We wszystkich na ogół krajach, a zwłaszcza w krajach UniiEuropejskiej, ta część agrobiznesu jest objęta szczególnymi regulacjami naturyorganizacyjno - prawnej 3 .Koncepcja agrobiznesu powstała w Stanach Zjednoczonych w połowie latpięćdziesiątych XX wieku. Za twórców agrobiznesu powszechnie uważa się J. H. Davisai R. A. Goldberga. Celem tej koncepcji było przeciwdziałanie negatywnym skutkomzmniejszania się dochodów rolników w wyniku malejącego popytu na produkty rolne.Koncepcja zaś gospodarki żywnościowej powstała na przełomie lat sześćdziesiątychi siedemdziesiątych XX wieku w krajach socjalistycznych Europy Środkoweji Wschodniej w warunkach ciągłych niedoborów produktów żywnościowych. Dlategoteż głównym celem gospodarki żywnościowej było przede wszystkim zapewnieniezaspokojenia wzrastającego zapotrzebowania społeczeństwa na produkty żywnościowe.Uwzględniając perspektywę marketingową w odniesieniu do agrobiznesui gospodarki żywnościowej nie trudno zauważyć między nimi zasadnicze różniceaksjologiczne dotyczące pojęcia, celów działania i zakresu działania.Koncepcja agrobiznesu jest znacznie szersza od koncepcji gospodarkiżywnościowej, gdyż obejmuje ona także te rodzaje działalności, które są związanez wykorzystaniem surowców rolniczych do wytwarzania produktównieżywnościowych 4 . Rolnictwo w różnych rozmiarach i zakresie wytwarza różnorodneprodukty wykorzystywane dla celów nieżywnościowych. Do podstawowych działalnościnieżywnościowych należy zaliczyć: produkcję sadzonek drzew i krzewów ozdobnych3 Por. m.in. na ten temat prace M. Adamowicza, J. Sawickiej, S. Urbana, R. Urbana, J. Rowińskiego, A. Wosia.4 F. Kapusta, Agrobiznes, Difin, Warszawa 2008, s. 53 – 54.116
oraz kwiaciarstwo, przetwórstwo skór zwierzęcych, produkcję włókien naturalnych i ichprzetwórstwo (włókiennictwo), produkcję biopaliw (gazowych, ciekłych i stałych),uprawę roślin specjalnych, produkcję barwników naturalnych, turystykę wiejską orazwiele innych.Uogólniając można także stwierdzić, iż agrobiznes ma w większym zakresieprzede wszystkim charakter organizacyjno – techniczny, biznesowy i marketingowyaniżeli gospodarka żywnościowa, która ma przede wszystkim charakter przyrodniczo –biologiczny i produkcyjno – ekonomiczny, a nade wszystko powinna być związanaz bezpieczeństwem żywnościowym społeczeństwa danego kraju, narodu, państwa.Istotne jednakże jest to, iż występująca różnica pomiędzy agrobiznesem a gospodarkążywnościową w niczym nie umniejsza roli i znaczenia działań marketingowych bezktórych ani agrobiznes ani gospodarka żywnościowa jako taka nie może współcześnieistnieć, a tym bardziej być konkurencyjną w układzie regionalnym, krajowym czy teżmiędzynarodowym. Wspólną cechą w systemie agrobiznesu i gospodarki żywnościowejjest rynek konsumencki, potrzeby nabywców, a więc człowiek, jednostka ludzka, grupyspołeczne, rodzina, społeczeństwo, naród jako wspólnota języka i terytorium 5 .Jednocześnie należy stwierdzić, że łańcuch żywnościowy jest centralną osiąorganizującą różne sfery agrobiznesu. Agrobiznes więc jako subsystem gospodarkinarodowej jest rozbudowanym i zróżnicowanym sektorem. Mimo malejącego znaczeniarolnictwa w gospodarce narodowej, agrobiznes ma w dalszym ciągu w każdejgospodarce istotne znaczenie w produkcji, zatrudnieniu i eksporcie 6 .Agrobiznes obejmuje więc zarówno samą produkcję rolniczą, zaopatrzenieprodukcyjne rolnictwa, przetwórstwo żywnościowe, transport, handel hurtowyi detaliczny, dystrybucję oraz infrastrukturę spożycia żywności. Jedną z kluczowychprzesłanek funkcjonowania agrobiznesu jest produkcja i dystrybucja żywności. Drogęi zasady przepływu żywności od rolnika do konsumenta określają ogniwa agrobiznesu,które kształtują łańcuch żywnościowy. Tomczak stwierdza, że „łańcuch żywnościowyzapewnia podaż żywności od bramy farmera do konsumenta, transformując surowcerolnicze w produkty, które mogą być wygodnie kupowane, przygotowanei konsumowane. Łańcuch ten obejmuje firmy skupu i przetwórstwa rolniczego,dystrybucji, usług żywnościowych i handlu detalicznego, a w wyniku ogólnychprzemian i potrzeb gospodarczych ulega ciągłym zmianom i unowocześnieniom 7 .Łańcuch żywnościowy jest więc procesem wytwórczym i usługowym koniecznym douzyskania z surowców żywnościowych finalnych dóbr konsumpcyjnych. Agrobiznesoczywiście jest pojęciem szerszym aniżeli gospodarka żywnościowa. Do łańcucha5 E. Pudełkiewicz, Socjoekonomiczna koncepcja rozwoju agrobiznesu, „Roczniki <strong>Nauk</strong>owe SERiA” 2009, tomXI (zeszyt 2), s. 208.6 F. Tomczak, Od rolnictwa do agrobiznesu. Transformacja gospodarki rolno – żywnościowej StanówZjednoczonych Ameryki Północnej, SGH w <strong>Warszawie</strong>, Warszawa 2004, s. 74.7 Tamże, s. 82.117
żywnościowego nie należy bowiem produkcja środków produkcji oraz usług dlawszystkich ogniw agrobiznesu. W łańcuchu żywnościowym nie uwzględnia się usługz otoczenia agrobiznesu (infrastrukturalne, finansowe, publiczne) 8 .W literaturze związanej z gospodarką żywnościową i agrobiznesem spotykamytakie pojęcia i określenia, jak:• marketing rolniczy,• marketing rolny,• marketing produktów żywnościowych,• marketing produktów spożywczych,• marketing spożywczy,• marketing rolniczych środków produkcji,• marketing spółdzielczy,• marketing ekologiczny,• marketing w agrobiznesie.W Polsce w gospodarce realnego socjalizmu nie było zapotrzebowania namarketing. Dopiero w gospodarce wolnorynkowej zaistniała taka potrzeba.Pojęcie marketingu w ogóle, jak i pojęcie marketingu rolniczego jest w sposóbróżny definiowane.Najbardziej adekwatną w stosunku do rolnictwa definicję marketingu podałKohls 9 . „Marketing jest to spełnienie wszystkich działań w biznesie obejmująceprzepływ dóbr i usług, począwszy od rozpoczęcia produkcji rolniczej aż do momentu,gdy znajdują się one w rękach ostatecznych odbiorców” 10 .Z definicji wynika – jak pisze J. Baker – że grupy o różnych interesach widząmarketing inaczej. Konsumenci będą zainteresowani nabywaniem pożądanych towarówpo możliwie najniższych cenach, a rolnicy, jak można zakładać, będą się starali osiągnąćmożliwie najwyższy zysk ze sprzedaży swoich produktów.Główną przyczyną, dla której definicja Kohlsa jest szczególnie odpowiednia dosytuacji rolnictwa jest to, że można jej użyć w celu określenia, które działania biznesumogą być właściwie powiązane z rynkiem. Marketingu nigdy nie wolno traktowaćrolnikom jako elementu neutralnego.Należy podkreślić, że marketing rolniczy nie znajduje się poza zasięgiem rolnika.Może on, co prawda, wybrać sposób gospodarowania, w którym będzie podejmowałniewiele lub nie będzie podejmował żadnych decyzji marketingowych, a mimo to jegoprodukcja będzie wciąż sprzedawana, jeśli nie przez niego samego, to przez dalsze8 J. Małysz, Łańcuch żywnościowy, w: Encyklopedia agrobiznesu, Fundacja Innowacja, Warszawa 1998,s. 476.9 R. L. Kohls, Marketing of agricultural products, Mac Millan, London 1968.10 Tłumaczenie podaję za polskim wydaniem książki Johna Bakera, Marketing rolniczy, WydawnictwoAkademii Rolniczej w Poznaniu, Poznań 1993, s. 17.118
połączenia sieci marketingowej. Należy być świadomym wszystkich aspektówrolniczego marketingu.Rolnictwo ma szczególną pozycję w marketingu zwłaszcza ze względu nagospodarstwa rolne nastawione na produkcję towarową. Gospodarstwa socjalne,produkujące na własne potrzeby, nie są na ogół zainteresowane marketingiem jakofilozofią myślenia i działania.Na poziomie gospodarstwa marketing można zdefiniować jako każdą, celowopodjętą przez rolnika działalność skierowania swoich produktów na wcześniej wybraneobszary rynku, aby maksymalizować, a przynajmniej zoptymalizować zysk.W definicji marketingu rolniczego można wyróżnić trzy kluczowe cechy,a mianowicie, iż:• marketing jest celową, planowaną działalnością;• przeznaczenie produkcji na wcześniej wybrane segmenty rynku;• celem marketingu jest maksymalizowanie, a przynajmniejzoptymalizowanie zysku.Motyw zysku staje się siłą napędową marketingu w rolnictwie zwłaszczagospodarstw wielkotowarowych o charakterze przedsiębiorstwa.Sposób, w jaki rolnicy patrzą na swoją działalność zależy w dużej mierze od ichosobistych aspiracji i poglądów. Są rolnicy ukierunkowani przede wszystkim naprodukcję i rolnicy ukierunkowani na marketing. Rolnik ukierunkowany na marketingbędzie starał się wyprodukować dobra, które będzie mógł sprzedać z zyskiem,a prawdopodobieństwo osiągnięcia zysku będzie rozważał przed podjęciem produkcji.Dla tych rolników istotne będą systemy i źródła informacji rynkowej, gdyż one pozwoląpodejmować decyzje marketingowe, co produkować i w jaki sposób i gdzie sprzedawać.Aby gospodarstwo rolne będące przedsiębiorstwem rolnym mogło trwaći rozwijać się musi realizować następujące zadania:• rozpoznawać potencjalnych klientów swoich produktów, określić kimoni są, gdzie się znajdują i jakie czynniki powodują, że produkty sąkupowane lub nie;• ustalić ceny i warunki odpowiednie dla kupujących i jednocześniezapewnić sobie godziwy zysk;• zapewnić odpowiednią dla nabywców dystrybucję produktów,dostępnych we właściwym miejscu i czasie;• uruchomić metody przekonywania klientów do zakupu.Marketing rolniczy, marketing w agrobiznesie jest specyficznym rodzajemmarketingu, w którym ma miejsce konflikt interesów pomiędzy rolnikami, którzy chcąosiągnąć jak najwyższy zysk ze sprzedaży swoich produktów, a konsumentami, którzychcą nabyć towar po możliwie najniższych cenach.Marketing rolniczy na ogół nie leży poza zasięgiem kompetencji rolnika, choćmoże on nie podejmować żadnych decyzji o charakterze marketingowym, to i tak ma on119
wpływ na swoje towary. Rolnik musi być świadom chociażby takiego prostego faktu, żezmiany w popycie na produkty rolnicze dotyczą jego samego i że to w jego interesieleży, aby jak najwięcej wiedzieć o wszystkich aspektach tego szczególnego rodzajumarketingu, jakim jest marketing rolniczy czy marketing w agrobiznesie.Marketing rolniczy, marketing w agrobiznesie jest także jednym z decydującychaspektów zarządzania gospodarstwem rolniczym, w którym obserwuje się jak zmieniasię rola i funkcja rolnika w zależności od wzrostu zapotrzebowania na żywność w skaliświatowej oraz stopnia globalizacji rynku.Rolnictwo jest najsłabszym, a jednocześnie podstawowym ogniwem agrobiznesu,gdzie rolnik powinien w sposób świadomy prowadzić działalność marketingową.Polskie rolnictwo, szerzej agrobiznes jako subsystem gospodarki narodowejnapotyka na wiele problemów natury marketingowej.Wymagania konsumentów ciągle się zmieniają, a popyt na produkty rolnicze niema charakteru stałego, ma on charakter sezonowy. Tradycyjnie uważa się, że zadaniemrolnika jest wyprodukowanie takich dóbr, które odpowiadają jego systemowigospodarowania, a zadaniem handlowców jest znalezienie rynku na te produkty. Takiespojrzenie na marketing w rolnictwie, szerzej w agrobiznesie nie jest zadowalające,ponieważ rolnicy sami powinni promować swoją rodzimą produkcję. Rolnik powinienmieć odpowiednią wiedzę na temat tendencji marketingowych i potrzeb konsumentów,przed podjęciem decyzji dotyczących produkcji.Ważnym problemem w zakresie marketingu w rolnictwie jest dokładność, z jakąceny odzwierciedlają popyt konsumentów. Problem ten wiąże się z brakiembezpośredniego kontaktu producentów żywności i ciągle zmieniającymi się potrzebamikonsumentów. Dzieje się tak dlatego, że produkty żywnościowe sprzedawane są przezpośredników i rolnicy nie mają bezpośredniego kontaktu z klientem, przez co nie mogąpoznać wszystkich wymagań konsumentów.Kolejny problem marketingu w rolnictwie dotyczy dostarczania produktówrolnych od rolnika do konsumenta po najniższych kosztach.Istotą marketingu rolniczego, marketingu w agrobiznesie, jest wypracowanie,w wyniku działań marketingowych, zadowalających relacji w stosunku do trzech częściskładowych każdego rynku produktów rolniczych, a więc efektu cenowego, podażowegoi popytowego.Marketing rolniczy nie zaczyna się od momentu, w którym produkt opuszczagospodarstwo, lecz już dużo wcześniej. Jest celowym działaniem, które producentpodejmuje w celu wytwarzania i skierowania swojej produkcji do wcześniej wybranychobszarów rolnych, by maksymalizować zyski.Sukcesy rynkowe osiągają tylko te gospodarstwa rolne, które potrafią umiejętniepołączyć wiedzę z zakresu technologii, agrobiznesu oraz marketingu.Zarządzanie marketingowe w rolnictwie, w agrobiznesie zależy od inwencjipodmiotów i przedmiotów uczestniczących w otoczeniu bliższym i dalszym wszystkich120
ogniw agrobiznesu (zaopatrzenia w środki produkcji, rolnictwo, przemysł przetwórczy,handel i dystrybucja, konsument).Gromadzenie i przetwarzanie informacji jest niezwykle istotne dla gospodarstwrolnych, które chcą zaistnieć i funkcjonować w agrobiznesie.Strategia marketingowa obejmuje zespół działań pozwalających gospodarstwurolnemu osiągnąć pewne założone cele, którymi są 11 :- wybór rynków docelowych,- określenie pozycji na rynku,- podejmowanie decyzji dotyczących programu marketingowego,- podejmowanie decyzji w kwestiach rozwoju firmy,- badania rynkowe.Strategia ta jest długofalowa i w jej punkcie wyjścia powinna znajdować sięanaliza SWOT.Zarządzanie marketingowe w gospodarstwach rolnych ukierunkowane jestw dużym stopniu na zwiększenie sprzedaży i produkcji, przy jednoczesnym skierowaniudziałalności na stworzenie możliwie najsprawniejszego i najtańszego systemulogistycznego. Tylko sprawne zastosowanie i wykorzystanie idei marketinguw gospodarstwie rolnym, jak we wszystkich ogniwach agrobiznesu może przynieśćoczekiwane rezultaty. Dzięki temu rolnik staje się innowatorem, czyli osobą, którazgodnie z założeniami marketingu wprowadza do produkcji i na rynek nowy wyrób,nową technikę produkcji, odkrywa nowe rynki zbytu, nowe źródła pochodzenia surowca,wprowadza nową organizację produkcji, umożliwia istnienie i funkcjonowanierolnictwa, agrobiznesu na rynkach lokalnych, regionalnych, krajowychi międzynarodowych.Marketing rolniczy, marketing w agrobiznesie to celowa, planowana działalnośćmająca na celu wprowadzenie jego towarów (produktów) na rynek, celem osiągnięciazysku. Rozumiany w tym sensie odznacza się pewnymi cechami, do których należąświadomie podjęta decyzja, przeznaczenie produktu na uprzednio zbadany rynek orazoptymalizowanie zysku, który w sektorze rolniczym jest główną siłą napędowąmarketingu.Marketing odgrywa bardzo istotną rolę nie tylko w rolnictwie jako podstawowymogniwie agrobiznesu, ale i w całym agrobiznesie, wszystkich jego ogniwach. Szczególneznaczenie ma marketing w grupach producenckich.Według Rhodesa marketing rolniczy w ujęciu makro jest działalnościąwszystkich aktywności biznesowych związanych z przepływem produktówżywnościowych z gospodarstw rolnych do konsumentów. W ujęciu mikro marketingrolniczy jest działalnością biznesową, która bezpośrednio oddziałuje na przepływ11 J. Adamczyk, Marketing i zarządzanie w agrobiznesie, Oficyna Wydawnicza Politechniki w Rzeszowie,Rzeszów 1999.121
produktów i usług do konsumentów, wspierając realizację celów rolników lub firm 12 .Brans i Norvell wyróżniają marketing rolniczy (jako sprzedaż produktów rolniczych dofirm handlowych i przetwórczych skupujących produkty rolne) oraz marketingw agrobiznesie (agrobussines marketing). Marketing w agrobiznesie określają jakodziałania realizowane między podmiotami skupiającymi produkty rolne a finalnymikonsumentami. Próbując połączyć te dwa pojęcia, Brans i Norvell wprowadzają pojęcieagromarketingu (agrimarketing), który definiują jako ogół aktywności, związanychz produkcją rolniczą, skupem produktów rolnych, przetwórstwem oraz dystrybucją dofinalnych konsumentów (łącznie z badaniem potrzeb i motywacji konsumentów).Autorzy ci definiują również pojęcie systemu marketingowego (marketing system) jakosekwencji podmiotów gospodarczych uczestniczących w dostarczaniu produktówżywnościowych finalnym konsumentom 13 .Kohls i Uhl wprowadzają pojęcie marketingu żywności (food marketing).Postrzegają oni marketing żywności jako pomost między wyspecjalizowanymiproducentami a konsumentami. Obejmuje ono zarówno fizyczne, jak i ekonomicznerelacje umożliwiające przepływ i wymianę towarów między gospodarstwem rolnyma konsumentem.W najbardziej ogólnym ujęciu używają natomiast określenia systemu marketingużywnościowego (food marketing system). System ten jest kompozycją alternatywnychprzepływów produktów (określanych jako kanały marketingowe), różnorodnych firm(pośredników – agentów) i wielu rodzajów działalności gospodarczej (określanych jakofunkcje marketingowe) 14 . Podejmowane w systemie marketingowym decyzje wpływająna jakość, różnorodność i koszty podaży żywności. Użycie słowa system podkreśla fakt,iż łączy on w całość firmy, gałęzie przemysłu i cele społeczne.Kos i Szwacka Salmonowicz wskazują, że w kontekście pojęcia marketingżywnościowy zostaje rozwinięty termin system marketingu żywnościowego, któryzwraca uwagę na podmiotową strukturę trzech głównych sektorów, a mianowicierolnictwa (producentów rolnych), przemysłu spożywczego, hurtowego i detalicznegohandlu żywnością 15 .W wielu publikacjach autorzy podejmują przede wszystkim zagadnieniamarketingu w ujęciu mikro, rzadziej w ujęciu makro. Odnoszą się oni na ogół do12 V. J. Rhodes, The agricultural marketing system, John Wiley and Sons, New York 1983, s. 7 – 10. Podaję zaJ. Gołębiewski, Efektywność systemów marketingowych w gospodarce żywnościowej, Wydawnictwo <strong>SGGW</strong>,Warszawa 2010, s. 79.13 R. E. Branson, D. G. Norvell, Introduction to agricultural marketing, McGraw – Hill Book Company, NewYork 1983. s. 4. Podaję za J. Gołębiewski, Efektywność …, jw., s. 79.14 R. L. Kohls, J. N. Uhl, Marketing of agricultural products, MacMillan Publishing Company, New York1990, s. 5. Podaję za J. Gołębiewski, Efektywność …, jw., s. 80.15 A. Kos, J. Szwacka-Salmonowicz, Marketing produktów żywnościowych, PWRiL, Warszawa 1997, s. 10122
przedsiębiorstw funkcjonujących w gospodarce żywnościowej, zwracając uwagę naspecyfikę instrumentów wykorzystywanych przez firmy działające na rynkach 16 .Tymczasem nie mniej ważne jest także wykorzystanie i zastosowanie marketinguw agrobiznesie w ujęciu globalnym, międzynarodowym jak i na płaszczyźniemakroekonomicznej (gospodarki narodowej), czy też mezeoekonomicznej (naszczeblach rejonu, branży). Szczeble można rozumieć i opisywać na wiele sposobów. Naprzykład w teorii światowego systemu gospodarczego wyróżnia się centrum,półperyferie i peryferie. Wtedy zasadne jest pytanie, czy działania marketingowebędziemy odnosić do gospodarki polskiej jako całości, czy do gospodarki polskiej jakoczęści Unii Europejskiej.Podejście marketingowe mikro, makro i mezeo stwarza inną perspektywęaksjologiczną, humanistyczną i biznesową zarówno dla gospodarki żywnościowej, jaki szerzej agrobiznesu jako subsystemu (a może nawet samodzielnego systemu)gospodarek narodowych, Wspólnoty Europejskiej, a także całego świata.Warto w tym względzie zwrócić uwagę, iż podejście do gospodarkiżywnościowej, a szerzej do agrobiznesu obejmowało co najmniej kilka etapów ewolucjimyśli marketingowej, od orientacji produkcyjnej, produktowej, sprzedażowej,marketingowej po orientację marketingu społecznego, internetowego, marketinguekologicznego czy też marketingu relacyjnego.Agrobiznes, a wraz z nim marketing, przeszedł długą drogę historycznegorozwoju od społeczeństwa tradycyjnego (społeczeństwo agrarne, społeczeństwofeudalne) przez społeczeństwo nowoczesne (społeczeństwo przemysłowe, kapitalizmkontra socjalizm państwowy) do społeczeństwa informacyjnego (społeczeństwopostindustrialne) 17 . Głównym czynnikiem sprawczym tego rozwoju były kolejnerewolucje technologiczne. Pierwsza rewolucja przemysłowa około 1770 r.charakteryzowała się tym, iż maszyny zastępują pracę rąk. Druga rewolucjaprzemysłowa od 1850 r. wiąże się z wykorzystaniem nauki do produkcji. Kolejna trzeciarewolucja, na przełomie lat sześćdziesiątych i siedemdziesiątych XX w., nosi mianorewolucji naukowo – technicznej, zwłaszcza rewolucji technologii informacyjnych,gdzie ma miejsce zastosowanie wiedzy i informacji do wytwarzania i przetwarzaniawiedzy oraz informacji.16 Por. K. Cholewicka – Goździk (red.),Marketing produktów rolno – żywnościowych, FAPA, Warszawa 1997;M. Sznajder, A Przepióra, A. Trębacz, Marketing produktów rolno – spożywczych, Top Druk s.c., Poznań1997; R. Urban, Marketing produktów spożywczych, Wyd. Uniwersytetu Ekonomicznego we Wrocławiu,Wrocław 2008; T. Domański, P. Bryła, Marketing produktów żywnościowych, PWE, Warszawa 2010;B. Pilarczyk, R. Nestorowicz, Marketing ekologicznych produktów żywnościowych, Oficyna a WaltersKluwer Business, Warszawa 2010; J. Gołębiewski, Marketing produktów rolno – żywnościowych, w: Rynekrolny w ujęciu funkcjonalnym, Wyd. Wyższa Szkoła Finansów i Zarządzania, IERiGŻ – PIB, Warszawa 2007.17 W. Morawski, Socjologia ekonomiczna, PWN, Warszawa 2001, s. 98 – 118.123
Specyfika marketingu w agrobiznesie we współczesnym świecieZe względu na odmienność procesów i zjawisk, jakie występują i mają miejscew działalności agrobiznesowej, zasadne i jak sądzę słuszne merytorycznie jestwydzielenie nowej dyscypliny wiedzy zwanej marketingiem w agrobiznesie. Marketingjako dziedzina wiedzy stosowanej, wyposażony w określone instrumenty, zasady, regułydziałania jest oczywiście jeden. Jednakże jego wykorzystanie dotyczy różnych sferludzkiej działalności, a te mają swoją odrębność, specyfikę. Z tego też powoduwyodrębnienie takiej dziedziny wiedzy jak marketing w agrobiznesie nie powinnobudzić sprzeciwu ani teoriopoznawczego, ani metodologicznego a nade wszystkoaplikacyjnego. W moim rozumieniu takie podejście nie osłabia i nie rozmywa spójnościteorii i metodologii marketingu, a jedynie je wzmacnia i wzbogaca o nowe elementy,przynależne w tym przypadku do szeroko rozumianej sfery agrobiznesu, jego conajmniej sześciu głównych ogniw, o czym pisaliśmy wcześniej.Dzisiaj nie sposób nie zauważyć, iż mamy do czynienia z różnymi dziedzinamimarketingu i jego zastosowaniami. Stąd marketing usług, marketing bankowy, marketinginternetowy, neuromarketing, marketing ubezpieczeniowy, marketing terytorialny,automarketing, marketing turystyczny, hotelarski, marketing społeczny, marketingrelacyjny, marketing personalny, marketing polityczny, marketing oparty na wiedzy itp.dziedziny zastosowań, wykorzystania marketingu.W związku z co najmniej sześcioma głównymi ogniwami agrobiznesu możnazasadnie wyodrębnić:• marketing środków produkcji (maszyn, urządzeń rolniczych, nawozów,środków ochrony roślin itp.),• marketing związany z rolnictwem, rybołówstwem i leśnictwem,• marketing związany z branżami przemysłu spożywczego,• marketing związany z handlem i dystrybucją finalnych produktówżywnościowych,• marketing związany z konsumpcją,• marketing związany z funkcjonowaniem usług w agrobiznesie (naprzykład finansowo – bankowych, logistyczno – transportowych,mechanizacyjnych, chemicznych, weterynaryjnych i innych).W wyodrębnionych ogniwach marketingu agrobiznesowego warto byłobyzidentyfikować aktualny stan analiz, studiów i badań związanych z działalnościąmarketingową. Na podstawie ogólnego rozeznania, jakie posiada autor niniejszegoopracowania, można jedynie stwierdzić, iż najwięcej badań marketingowych ma miejscew przedsiębiorstwach przemysłu spożywczego, w handlu i dystrybucji żywności orazw konsumpcji gospodarstw domowych, najmniej zaś badań marketingowych124
związanych jest z marketingiem środków produkcji, z rolnictwem, rybołówstwemi leśnictwem oraz usługami weterynaryjnymi.Przedsiębiorstwa sfery przetwórstwa żywnościowego, w tym i wielkie koncernyprowadzą rzeczywiście profesjonalną działalność marketingową, co związane jest przedewszystkim z ogromną konkurencją na rynku żywności. We współczesnym świecie niewystarczy tylko wyprodukować nawet najlepszy artykuł żywnościowy, ale należy gotakże atrakcyjnie opakować, ustalić adekwatną cenę, poinformować potencjalnychklientów i konsumentów o jego nadzwyczajnych, niepowtarzalnych walorach, zachęcićich do kupna atrakcyjnym i trafnym sloganem reklamowym. Natomiast działalnośćmerchandisingowa, realizowana przez placówki handlowe, zwłaszcza większe superi hipermarkety wydaje się być w tym względzie nieodzowna.Merchandising, zarówno wewnętrzny jak i zewnętrzny, rozumiany jest jakokompleks działań marketingowych realizowanych przez firmy handlowe, które mająprzede wszystkim na celu intensyfikację sprzedaży oferowanych produktów. Działaniamerchandisingowe w sektorze produktów spożywczych szeroko wykraczają pozastrategię promocji.Należy także zwrócić uwagę na działania marketingowe, w tym takżei promocyjne, realizowane przez przedsiębiorstwa oferujące środki do produkcji rolnej,zwłaszcza produkty przemysłu chemicznego, maszynowego, paszowego itp. Ważnyw tym względzie jest poziom koncentracji firm zajmujących się wytwarzaniemi dystrybucją środków do produkcji rolnej, a także zasoby kapitałowe koncernów itp.Najsłabszym ogniwem w koncepcji marketingu agrobiznesowego jest oczywiściemarketing produktów rolniczych, zwany przez niektórych autorów marketingiemrolniczym. Dzieje się tak dlatego, iż rolnictwo jest rozdrobnione i każdeprzedsiębiorstwo, jak i gospodarstwo rolne jest zróżnicowane pod względem zasobówkapitałowych i ma swoje odrębne cele działania (główne i szczegółowe). Wybór celówzależy od motywów działania 18 :• dochodowy lub maksymalizacji zysku,• prestiżu i znaczenia,• obowiązku lub generacyjny.Wymienione motywy w sposób odmienny wyznaczają strategie marketingowedziałania przedsiębiorstw rolniczych, jak i gospodarstw rolnych. Gospodarstwa rolne(gospodarstwa chłopskie), pracujące w dużej mierze na samozaopatrzenie, nastawione sąprzede wszystkim na zabezpieczenie odpowiednich dochodów dla rodziny chłopskiej.Mają one charakter generacyjny, muszą dać zatrudnienie wszystkim członkom rodzinyi zabezpieczyć warunki jej trwania i rozwoju w przyszłości. Natomiast przedsiębiorstwarolnicze, o charakterze rynkowym, z udziałem pracy najemnej, są nastawione na18 K. Safin, Przedsiębiorstwo rodzinne – istota i zachowania strategiczne, Wyd. Akademia Ekonomiczna,Wrocław 2007, s. 206.125
maksymalizację zysku, na pragnienie odniesienia sukcesu gospodarczego, zrealizowaniazamierzonych inwestycji, zakup nowych technologii, wprowadzania innowacji.Właściciele tych przedsiębiorstw są chłonni wiedzy, informacji marketingowych,nowych, menedżerskich metod organizacji pracy i zarządzania, nowinek i innowacjitechnologicznych, w o wiele większym stopniu aniżeli właściciele gospodarstw rolnych(typowo chłopskich).Rozważając specyfikę marketingu w agrobiznesie należy przede wszystkimstwierdzić:• nie ma oddzielnej, specjalnej teorii i metodologii marketingu w agrobiznesie,• koncepcje i strategie marketingowe oraz wszystkie znane metody analizymarketingowej (metoda analizy SWOT, metoda analizy BCG, GeneralElectir i wszystkie inne metody analizy portfelowej) mają charakteruniwersalny i powszechne zastosowanie.Na czym więc polegałaby specyfika marketingu w agrobiznesie?Według wielu autorów 19 zajmujących się rolnictwem, gospodarką żywnościową,też szerzej agrobiznesem wiąże się ona ze:• specyfiką przedsiębiorstw, firm, koncernów zajmujących się produkcjąmaszyn i urządzeń rolniczych, nawozów mineralnych, środków ochronyroślin, specyfików farmaceutycznych stosowanych w chowie i hodowlizwierząt, przygotowaniem pasz treściwych itp.,• specyfiką przedsiębiorstw, gospodarstw rolnych jako podmiotówrynkowych (w mniejszym lub większym stopniu związanych z rynkiem);• specyfiką podaży i popytu na surowce i produkty rolno – żywnościowe(związana z tym m.in. sezonowość, regularność spożycia, substytucyjnośćniektórych artykułów spożywczych, ograniczone możliwości w zakresiegromadzenia zapasów, niska na ogół elastyczność i dochodowość popytu nażywność, (wyjątkiem jest żywność najwyższej jakości, która wymagabardziej intensywnej promocji);• specyfiką branż przemysłu spożywczego;• specyfiką handlu i dystrybucji surowców i produktów rolnych i artykułówspożywczych, występujących kanałów o różnym stopniu zorganizowania,instytucjonalizacji (targowiska, rynki hurtowe, aukcje, giełdy, superi hipermarkety, sklepy osiedlowe itp.);• specyfiką konsumentów i klientów uczestniczących w zakupie produktówrolno – żywnościowych (gospodarstwa domowe, kupcy);19 Warto w tym względzie odwołać się m.in. do prac A. Wosia, M. Adamowicza, S. Urbana, A. Czyżewskiego,J. Gołębiewskiego, S. Grabowskiego, F. Kapusty, J. Małysza, B. Iwana, M. Sznajdera, F. Tomczaka, M. Tracy,R. Urbana, E. Pudełkiewicza i wielu innych.126
• możliwościami sfinansowania profesjonalnych działań marketingowychprzez podmioty uczestniczące w sferach (ogniwach) agrobiznesu;• świadomością marketingową wszystkich uczestników kolejnych ogniwagrobiznesu, wchodzących w różne powiązania, relacje i stosunkiz otoczeniem bliższym i dalszym, a więc 20 :- stosunki kooperacji (współdziałania),- konkurencji (współzawodnictwa),- podległości (zależności), ze względu na określony system prawny,w którym działają przedsiębiorstwa agrobiznesu.W sektorze agrobiznesu działają różne struktury organizacyjne, instytucjonalne,prawno – ekonomiczne (wielkie korporacje, nierzadko o zasięgu światowym(globalnym) i bardzo małe firmy prowadzone przez jednego człowieka, który jestzarówno właścicielem, jak i pracownikiem). Istnieje ogromna liczba przedsiębiorstwtypu „jeden właściciel”, ale dominującą pozycję zajmują nieliczne korporacje. Trzebatakże zauważyć, że w określonych warunkach swoje oczywiste walory wykazująspółdzielnie lub przedsiębiorstwa państwowe.W ostatnich dekadach XX wieku, jak i na początku XXI wieku w światowymagrobiznesie obserwuje się wyjątkowy boom na powstanie różnorodnych spółekakcyjnych i kapitałowych. Z orientacji rynkowej poszczególnych ogniw agrobiznesuwynikają podstawowe wnioski i wskazania w zakresie ich lokalizacji. Kosztyprzewozów surowców i gotowych produktów żywnościowych odgrywają istotną w nichrolę. Produkcja surowców rolniczych i żywności, a także ich spożycie jest terytorialnierozproszone. Mamy około 2 mln gospodarstw rolnych (w tym około 30%wysokotowarowych) i około 12 mln gospodarstw domowych, w których ma miejscekonsumpcja żywności. Wielkie aglomeracje miejskie reprezentują wysoką koncentracjępopytu na żywność.Ukształtowana historycznie struktura jednostek gospodarczych agrobiznesu manie tylko swoje aspekty lokalizacyjne (przestrzenne), ale również w dużym stopniuprzesądza stopień konkurencyjności i monopolizacji w tym sektorze. Każdeprzedsiębiorstwo w sektorze agrobiznesu ma konkurentów faktycznych orazpotencjalnych, do których należy zaliczyć firmy wchodzące i zainteresowane wejściemna dany segment rynku.Globalizacja światowego rynku nie pozostaje bez wpływu na agrobiznes jakosubsystem gospodarki narodowej (a może nawet samodzielny system). Wymusza onawysoką jakość, konkurencyjność oraz innowacyjność w poszczególnych ogniwachagrobiznesu, w obrębie których czymś nieodzownym i koniecznym jest podjęciezintegrowanych działań marketingowych. W skali pojedynczego przedsiębiorstwaoznacza to, że działalność marketingowa powinna polegać na dostarczeniu określonych20 A. Woś (red.), Agrobiznes. Mikroekonomia (t. 2), Wyd. Key Text, Warszawa 1996, s. 32 – 37.127
dóbr i usług wybranym klientom w oznaczone miejsce, w określonym czasie, poodpowiednich cenach i przy udziale dobranych odpowiednio form i środkówkomunikacji marketingowej i promocji.Działania marketingowe, jakie powinny być podejmowane w agrobiznesie jakosektorze gospodarki, jak i w poszczególnych jego ogniwach powinny oczywiście opieraćsię na fundamentalnych prawach ekonomii, rachunku ekonomicznego, zasadachorganizacji i zarządzania przedsiębiorstwem, a przede wszystkim na aksjologicznychzałożeniach socjoekonomicznej koncepcji rozwoju agrobiznesu, z których wynika, iżwszelkie działania podejmowane w agrobiznesie mają służyć człowiekowi i nie mogąone mieć zgubnego wpływu na niego samego 21 .Podsumowanie i wnioskiPraktyczne zastosowania marketingu w agrobiznesie mają coraz większeznaczenie ze względu na konkurencyjność, innowacyjność i procesy globalizacji wewspółczesnym świecie. Marketing w agrobiznesie ma przed sobą ogromną przyszłość.Historycznie powstał on w wyniku nadwyżek produktów rolnych i miał na celuzwiększenie ich sprzedaży.Przyszłość marketingu produktów żywnościowych, a szerzej marketinguw agrobiznesie, będzie przede wszystkim zdeterminowana pozycją największychproducentów oraz ich strategiami. Wszystkie kolejne ogniwa agrobiznesu musząprowadzić profesjonalne zarządzanie, a jednocześnie dzięki odpowiednim budżetomrozwijać skuteczne i efektywne działania marketingowe, uwzględniające specyfikęi charakter poszczególnych ogniw agrobiznesu. Na przykład w handlu i dystrybucji musimieć miejsce współpraca z największymi sieciami handlowymi. One bowiem mogątylko zagwarantować silne relacje partnerskie z producentami żywności, w tym takżez grupami marketingowymi producentów rolnych. Stałość oraz stabilność zasadwspółpracy będzie przyczyniać się do wytwarzania marek własnych oraz doskonaleniastrumienia dostaw. Efektywność wzajemnej współpracy i poszukiwanie źródeł przewagikonkurencyjnej w agrobiznesie następować będzie w zakresie różnych form integracjipionowej i poziomej kanałów rynku.Podstawowym, w zakresie integracji pionowej, problemem są systemy integracjiźródeł zaopatrzenia, gwarantujące producentom ciągłość zaopatrzenia surowców zapośrednictwem różnego rodzaju form kontraktacji. Ważnym obszarem integracjipionowej jest także sfera handlu detalicznego i tworzenie własnych lub patronackichsieci sklepów przez wybranych producentów.21 Szerzej na ten temat zobacz: E. Pudełkiewicz, Socjoekonomiczna koncepcja rozwoju agrobiznesu, „Roczniki<strong>Nauk</strong>owe SERIA” 2009, tom XI, zeszyt 2.128
Wiodący polscy producenci żywności stają się przede wszystkim lideramiw zakresie wdrażania innowacji marketingowych nie tylko na polskim rynku, leczrównież na rynku Unii Europejskiej. Na przykład liderzy polskiego rynku soków lansująwiele innowacji w zakresie komunikacji na temat marki oraz wykorzystania nowychmediów do budowania relacji z otoczeniem.Stosowanie innowacji marketingowych w obszarze poszczególnych ogniwagrobiznesu będzie także w dużym stopniu zależeć od profesjonalizmu agencjimarketingowych, współpracujących z bliższym i dalszym otoczeniem agrobiznesu. Napodstawie obserwacji działalności najlepszych firm w obszarze agrobiznesu możnawnioskować, że nie tylko współpracują one z najlepszymi agencjami, lecz tworząrównież specjalne stanowiska w firmie w celu wykorzystania nowych medióww obszarze komunikacji marketingowej, a zwłaszcza do budowy społecznościużytkowników oraz sympatyków zainteresowanych daną marką 22 .Literatura1. Adamczyk J., Marketing i zarządzanie w agrobiznesie, Oficyna WydawniczaPolitechniki w Rzeszowie, Rzeszów 1999.2. Baker J., Marketing rolniczy, Wydawnictwo Akademii Rolniczej w Poznaniu,Poznań 1993.3. Branson R. E., Norvell D. G., Introduction to agricultural marketing, McGraw –Hill Book Company, New York 1983.4. Cholewicka – Goździk K. (red.), Marketing produktów rolno – żywnościowych,FAPA, Warszawa 1997;5. Domański T., Bryła. P., Marketing produktów żywnościowych, PolskieWydawnictwo Ekonomiczne, Warszawa 2010.6. Gołębiewski J., Efektywność systemów marketingowych w gospodarceżywnościowej, Wydawnictwo <strong>SGGW</strong>, Warszawa 2010.7. Gołębiewski J., Marketing produktów rolno – żywnościowych, w: Rynek rolnyw ujęciu funkcjonalnym, Wyd. Wyższa Szkoła Finansów i Zarządzania, IERiGŻ –PIB, Warszawa 2007.8. Kapusta F., Agrobiznes, Difin, Warszawa 2008.9. Kohls R. L., Marketing of agricultural products, Mac Millan, London 1968.10. Kohls R. L., Uhl J. N., Marketing of agricultural products, MacMillan PublishingCompany, New York 1990.11. Kos A., Szwacka-Salmonowicz J., Marketing produktów żywnościowych, PWRiL,Warszawa 1997.12. Małysz J., Łańcuch żywnościowy, w: Encyklopedia agrobiznesu, FundacjaInnowacja, Warszawa 1998.13. Morawski W., Socjologia ekonomiczna, PWN, Warszawa 2001.22 T. Domański, P. Bryła, Marketing produktów żywnościowych, Polskie Wydawnictwo Ekonomiczne,Warszawa 2010, s. 224.129
14. Pilarczyk B., Nestorowicz R., Marketing ekologicznych produktówżywnościowych, Oficyna a Walters Kluwer Business, Warszawa 2010;15. Pudełkiewicz E., Socjoekonomiczna koncepcja rozwoju agrobiznesu, „Roczniki<strong>Nauk</strong>owe SERiA” 2009, tom XI (zeszyt 2).16. Rhodes V. J., The agricultural marketing system, John Wiley and Sons, New York1983.17. Safin K., Przedsiębiorstwo rodzinne – istota i zachowania strategiczne, Wyd.Akademia Ekonomiczna, Wrocław 2007.18. Sznajder M., Przepióra A., Trębacz A., Marketing produktów rolno –spożywczych, Top Druk s.c., Poznań 1997.19. Tomczak F., Od rolnictwa do agrobiznesu. Transformacja gospodarki rolno –żywnościowej Stanów Zjednoczonych Ameryki Północnej, SGH w <strong>Warszawie</strong>,Warszawa 2004.20. Urban R., Marketing produktów spożywczych, Wyd. UniwersytetuEkonomicznego we Wrocławiu, Wrocław 2008.21. Woś A., Agrobiznes. Makroekonomika, t.1, wyd. Key Text, Warszawa 1996.22. Woś A. (red.), Agrobiznes. Mikroekonomia (t. 2), Wyd. Key Text, Warszawa1996.SummaryThe aim of this paper is to draw attention to the need to develop new areas ofknowledge related to the use of different types and kinds of modern marketing conceptsin agribusiness.The need to develop a new field of knowledge known as the marketing inagribusiness are mainly associated with a business nature, specificity and nature of theindividual cells of agribusiness.Practical applications of marketing in agribusiness are becoming increasinglyimportant because of the competitiveness, innovation and globalization in thecontemporary world.Informacje o autorzeDr hab. Eugeniusz Pudełkiewicz, prof. <strong>SGGW</strong>Szkoła Główna Gospodarstwa WiejskiegoWydział <strong>Nauk</strong> <strong>Ekonomicznych</strong>Katedra Polityki Europejskiej,Finansów Publicznych i MarketinguZakład Marketingu i Analiz RynkowychUl. Nowoursynowska 166, 02 – 787 WarszawaTel. (22) 593 40 72e-mail: eugeniusz_pudelkiewicz@sggw.pl130
5 (54) 2011Récky Roman, Klimentová Katarína, Dobák DušanKOMPARÁCIA VÝROBNO-EKONOMICKÝCHZÁVISLOSTÍ PRI PESTOVANÍ SLNEČNICE ROČNEJV SRCOMPARISON OF PRODUCTION AND ECONOMIC DEPENDENCEWITHIN THE GROWING OF SUNFLOWER IN THE SLOVAKREPUBLICGrowing of oil crops has spread considerably in the last years. The most importantoil crop grown in our conditions is oilseed rape. Sunflower is the second most importantcrop grown in the Slovak Republic. In this paper we evaluate the growing of sunflowerfrom the production and economic point of view. Only the years 1996, 2004 – 2009 aredealt with in the paper. Obtained results show that economic advantage of growing ofsunflower is affected mainly by the climatic conditions as well as by the intensification ofproduction and support policy. The year 2007 was economically most advantageous ofevaluated years. The highest loss within the growing of sunflower was recorded in 2009.Higher hectare yield of sunflower can be achieved by the intensification of production.INTRODUCTIONOil crops are important group of crops within the plant production in the world.They occupy second largest growing areas on arable land. The importance of growing ofoil crops has increased recently due to different possibilities of their usage. One of themost significant oil crops is sunflower. Concerning its growing, it is the fourth mostspread oil crop in the world and second most spread oil crop in Slovakia.Sunflower – (Helianthus annuus) is native to Central America (Mexico). AmericanIndians domesticated it 3000 BC. It belongs to the crops (potatoes, corn, and tobacco)that were introduced to other parts of the world in the beginning of the 16 th century. Itwas first grown as a field crop in Germany and France. It started to be grown in formerCzechoslovakia, mainly in warmer regions of the south of Slovakia, after the First WorldWar.The importance of sunflower consists in its growing and consequent obtaining ofhigh quality oil. This oil is dietetically valuable and is used for technical but mainly forcooking purposes. Annual production in the world is 9 million tons of sunflower oil,which stands for 10% of plant oil production in the world. The main product of growingof sunflower is achenes. They present second most important source for the productionof oil of excellent dietetical qualities. Sunflower can be used in many different ways.131
Fibres from sunflower stems are used in China for paper production and in textileindustry. Sunflower stems are source for heating. Extracted sunflower groats is a byproductthat is formed within the oil production. It is used to produce fodder mixtures,which are important protein components. Sunflower is also grown as a fodder crop or asa crop for green manuring. It is thought to use the oil and its derivatives for the biofuelproduction. Different ways of using sunflower increase its advantage to be used as analternative crop within the area ploughing in of frozen winter crops and winter rape.Sunflower is an important crop, mainly in suitable natural conditions. It is grownfor oil achenes that are used for cooking purposes (production of oil and fats –margarines) as well as for technical purposes (soft soaps and oil colours produced fromless quality materials). The oil content varies according to sunflower varieties. Theachenes contain 25 – 46% and seeds 40 – 65% of oil. The largest growing areas can befound in western part of Slovakia (69%). In central part of Slovakia they occupy 16%and in the eastern part 15% of agricultural land (Šimo, Rovný 2010).MATERIAL AND METHODSThe main aim of the paper is to compare production and economic dependencewithin growing of sunflower in the Slovak Republic. The paper is based on theinformation gathered from the materials published by the Research Institute ofAgricultural and Food Economics in Bratislava. Only the years 1996, 2004 – 2009 aredealt with in the paper. It also analyzes the production of sunflower from the followingpoints of view: prime costs, yield, producer prices and subsidies. These are used toevaluate economic relations such as sales, cost efficiency, share of subsidies onsettlement costs, share of subsidies on sales and break-event point of yield.Also other materials published by the Ministry of Agriculture of the SlovakRepublic and Statistical Office of the Slovak Republic are used to achieve the setobjective. Yields presented in Table 1 as well as in other tables are gathered fromdifferent sources.Efficiency of costs presents the index value which expresses the rate of profit(loss) from each Euro put into production.The break-event point from 1 hectare (without subsidies) is expressed by thefollowing formula:VNÚ =PThe break-event point from 1 hectare (with subsidies) is expressed by thefollowing formula:VNÚ =( P + D)132
The above mentioned point shows the minimum hectare yield of sunflowerwhen the prime costs of sunflower production are equal to revenues.VN – prime costs (€. ha -1 )P – exercise price (€. ha -1 )Ú – yield (t . ha -1 )D – subsidies per hectareRESULTS AND DISCUSSIONNowadays, within the production conditions of Slovakia, an attention is paid tosolving production and economic relations of growing of sunflower. The aim is todetermine development trends of growing in conditions of Slovakia within recentclimate changes.Table 1 shows selected marketing information on sunflower within given years.The observed indicators are rising. Harvested areas of sunflower rose by 58%(30,497 ha) from 1996 – 2009. The largest harvested areas were recorded in 2006 whenthey reached the area of 108,816 ha. The hectare yield increased as well. Concerningproducers, the year 2008 was the best because the average hectare yield of sunflowerreached 2.57 t.ha -1 . The production increased by 79%. The most significant increase(in %) was determined in relation to import due to the fact that in 1996, the import ofsunflower into Slovakia was neglectable (408 ton) and within the domestic production itaccounted for 0.4%. The domestic production rose by 19%. In our conditions, thedomestic consumption of sunflower is used in food processing industry. The rest of theproduction is aimed at export which increased by 229% within given years. Sunflowerbelongs to Slovak pro-export commodities and it is very popular on the EU market.Tab 1 Selected information on sunflower in Slovakia according to years (in ha, t.ha -1 , t)YearsIndicatorIndex1996 2004 2005 2006 2007 2008 200909/96Harvested area 52,447 90,031 91,000 108,816 64,746 74,934 82,944 1.58Yield 1.98 2.18 2.14 2.10 2.05 2.57 2.26 1.14Production 104,753 196,351 195,000 228,606 132,656 192,346 187,238 1.79Import 408 500 450 2,879 2,728 5,734 9,018 22.10Export 59,600 134,000 96,668 108,490 97,678 118,080 136,256 2.29Domesticconsumption50,332 63,000 68,000 102,701 65,000 80,000 60,000 1.19Source: VÚEPP Bratislava : Olejniny. Situačná a výhľadová správa , own calcutations.Table 2 presents hectare yields, producer prices, prime costs and cost efficiencywithin the growing of sunflower. The highest producer price was recorded in 2007(374.63 €.t -1 ) and the lowest producer price was observed in 2009 (198.27 €.t -1 ).A significant decrease in producer prices of sunflower after the year 2007 was caused by133
the incoming world economic crisis, above average yield and consequent oversupply ofsunflower in conditions of the Slovak Republic. In 2007 – 2009 the price of sunflowerdecreased enormously by 176.36 €.t -1 which was 53%. Prime costs increased by 103%from 1996 – 2009. The increase of prices of fertilizers and means of chemical cropprotection affected considerably the increase of costs. There was a significant decreaseof production efficiency in 2008 and 2009. The producers of sunflower reached the salesof 0.85 or 0.65 € (without subsidies) for 1 € invested into the production. Graph 1presents the development of producer prices and prime costs of sunflower within givenyears. Graph 1 shows the increase of prime costs and fluctuation of producer prices ofsunflower.Tab 2 Production and economic analysis of growing of sunflower in Slovakia accordingto years (without subsidies)YearsYield Producer Prime costs Sales Costin t.ha -1 price in €.t -1 in €.ha -1 in €.ha -1 efficiency in €1996 2.03 247.86 401.78 503.16 1.252004 2.39 238.83 659.23 570.80 0.872005 2.32 236.17 659.60 547.91 0.832006 2.22 238.70 685.92 529.91 0.772007 2.27 374.63 804.22 850.41 1.062008 2.85 257.39 866.69 733.56 0.852009 2.51 198.27 816.60 497.66 0.61Index09/961.24 0.80 2.03 0.99 -Source: Prime costs and economic results of agricultural companies in Slovakia in 1996,2004 – 2009 VÚEPP Bratislava, own calculations.Graph 1 Development of producer prices and prime costs of sunflower (€.t -1 , €.ha -1 )Source: Prime costs and economy results of agricultural companies in Slovakia in 1996,2004 – 2009 VÚEPP Bratislava134
Concerning the cost efficiency it can be stated that the highest cost efficiency(without subsidies) for 1 € invested into the production was recorded in 1996 (1.25 €). Thelowest cost efficiency for 1 € invested into the production was reached in 2009 (0.61 €).Table 3 indicates the efficiency of sunflower subsidies within given years. Theresults show that the highest share of subsidies on settlement costs was recorded in 2004(23.74%) and the lowest one in 1996 (9.5%). The subsidies per hectare of growingsunflower reached the lowest value in 1996 (38.17 €.ha -1 ) and the highest one in 2007(172.77 €.ha -1 ). Obtained results clearly indicate that the entrance of Slovakia into theEU (2004) increased considerably sunflower subsidies.Tab 3 Efficiency analysis of sunflower subsidies in Slovakia according to yearsShare of subsidiesSubsidies SubsidiesYearv €.t -1v €.ha -1 on settlementcosts in %Share ofsubsidies onsales in %1996 18.82 38.17 9.50 7.592004 65.46 156.48 23.74 27.412005 63.87 148.14 22.46 27.042006 55.20 122.52 17.86 23.122007 76.11 172.77 21.48 20.322008 48.36 137.82 15.90 18.792009 61.57 154.58 18.93 31.06Index 09/96 - 4.05 1.99 -Source: Prime costs and economy results of agricultural companies in the SlovakRepublic in 1996, 2004 – 2009 VÚEPP Bratislava, own calculations.Break-event points of sunflower yield are evaluated in Table 4. The break-eventpoint expresses economic situation when all costs are covered and there is neither profitnor loss. The bigger amount of production is achieved above the break-event point, thebigger profit is gained in the evaluated year. Moreover, this year is less influenced byrisk factors such as the change of exercise price within the sale. The bigger amount ofproduction is achieved below the break-event point, the bigger loss is recorded inrelation to the sunflower production within the evaluated year.The biggest difference in calculated break-event point of sunflower yield(without subsidies) was reached in 2009 (-1.61 t.ha -1 ). This means that if the sunfloweryield increased by 1.61 t.ha -1 , the costs of growing of sunflower would be equal to sales.Economically most advantageous years of growing of sunflower were years 1996 and2007 when the growing of sunflower was profitable also without the implementation ofany subsidies. The growing of sunflower was loss-making even with the implementationof subsidies in 2006 and 2009. The production of sunflower was profitable with theimplementation of subsidies in 2004, 2005 and 2008.The data in Table 4 indicate the need for the intensification of production. Thiscan be done mainly by implementing positive experience and results of successfulproducers who reach the yield 2.6 - 3 t.ha -1 and more. The profitability of growing ofsunflower was influenced by the following important factors: hectare yields, prime costs,subsidies and exercise prices.135
Tab 4 Break-event points of sunflower yield in Slovakia according to yearsIndicatorYears1996 2004 2005 2006 2007 2008 2009Yield in t.ha -1 2.03 2.39 2.32 2.22 2.27 2.85 2.51Break-event point in t.ha -1 1 1.62 2.76 2.79 2.87 2.15 3.37 4.122 1.47 2.11 2.17 2.36 1.69 2.83 3.34Difference in t.ha -1 1 0.41 - 0.37 - 0.47 - 0.51 0.12 - 0.52 - 1.612 0.56 0.28 0.15 - 0.14 0.58 0.02 - 0.83Profit (loss) in €.ha -1 1 101.37 - 88.73 - 111.66 - 156.01 46.17 - 133.14 - 318.962 139.55 68.05 36.47 - 33.49 218.95 4.68 - 164.37Source: Prime costs and economy results of agricultural companies in the SlovakRepublic in 1996, 2004 – 2009 VÚEPP Bratislava, own calculations.Note: 1 – without subsidies, 2 – with subsidiesUpcoming yields will be significantly influenced by climate changes (increaseof average temperatures together with the reduction of rainfall). This fact has alreadybeen recorded in the last years. Therefore, the agricultural companies will have to focuson the selection of appropriate forecrop and to respect the growing procedure within theproduction. They will also have to pay attention to the consequent soil preparation, dateand density of sowing and to the provision of optimal protection and nutrition which isthe task of the management of agricultural company.REFERENCESBurianová, V. 2010. Náklady a výnosy poľnohospodárskych výrobkov v SR za rok 2009.Bratislava: VÚEPP, 2010. ISBN 978-80-8058-551-8.Kubanková, M. - Burianová, V. 2009. Náklady a výnosy poľnohospodárskych výrobkovv SR za rok 2008. Bratislava: VÚEPP, 2009. ISBN 978-80-8058-525-9.Kubanková, M. - Burianová, V. 2008. Náklady a výnosy poľnohospodárskych výrobkovv SR za rok 2007. Bratislava: VÚEPP, 2008. ISBN 978-80-8058-492-4.Kubanková, M. - Burianová, V. 2007. Náklady a výnosy poľnohospodárskych výrobkovv SR za rok 2006. Bratislava: VÚEPP, 2007. ISBN 978-80-8058-525-9.Kubanková, M. - Burianová, V. 2006. Náklady a výnosy poľnohospodárskych výrobkovv SR za rok 2005. Bratislava: VÚEPP, 2006. ISBN 80-8058-444-3.Kubanková, M. - Burianová, V. 2005. Náklady a výnosy poľnohospodárskych výrobkovv SR za rok 2004. Bratislava: VÚEPP, 2005. ISBN 80-8058-381-1.Kubanková, M. - Burianová, V. 1997. Náklady a výnosy poľnohospodárskych výrobkovv SR za rok 1996. Bratislava: VÚEPP, 1997. ISBN 80-88731-83-6.Šimo, D. - Rovný, P. 2010. Agrárny marketing. Nitra: SPU, 2010. 279 s. ISBN 978-80-552-0472-7.Tibenská, H. 2010. Olejniny. Situačná a výhľadová správa. Bratislava: VÚEPP, 2010.59 s. ISSN 1337-4540.Syngenta, n.d. Slnečnica. [cited 21.03.2011]. Dostupné na:http://www.syngenta.sk/index.php?produkty&plodina=Slnecnica.136
CONTACTIng. Roman Récky,Department of Marketing, FEM, SPU,Tr. A. Hlinku 2,949 76 Nitra, Slovakia,tel. 00421 37 6508 4159Mgr. Katarína Klimentová,Department of Professional Language Education, FEM, SPU,Tr. A. Hlinku 2,949 76 Nitra, Slovakia,tel. 00421 37 6508 4557Ing. Dušan Dobák,Department of Marketing, FEM, SPU,Tr. A. Hlinku 2, 949 76 Nitra,Slovakia,tel. 00421 37 6508 4159e-mail: roman.recky@fem.uniag.skkatarina.klimentova@fem.uniag.skdusan.dobak@fem.uniag.sk137
5 (54) 2011Beáta Rizovová, Veronika Gašparíková, Ľudmila NagyováPerception of advertisement in Visegrad Four countriesPostrzeganie reklamy w krajach Grupy WyszehradzkiejZnaczenie komunikacji marketingowej ciągle wzrasta. Prowadzonych jest wiele debat natemat integracji narzędzi komunikacyjnych, które mogą pomóc osiągnąć lepsze rezultatyzwłaszcza, gdy firmy starają się działać na arenie międzynarodowej. Prezentowanapraca zawiera wyniki badań prowadzonych w krajach Grupy Wyszehradzkiej, któremiały na celu znalezienie różnic wśród młodych ludzi w zakresie percepcji reklamy. Niestwierdzono istotnych statystycznie różnic w zakresie efektywności reklamy internetowej,jednak pierwsze miejsce pod względem dokonywania zakupów elektronicznych zewzględu na reklamę internetową w zajęli polscy respondenci.IntroductionThe importance of communication and continuous usage of new marketingcommunication features is still increasing in current dynamic market conditions inSlovakia and within the whole world.1 Nowadays, when integrated marketing communication and communicationreaching synergy is emphasized the concept that "media" include all the communicationtools that create an effective mix is preferred. Thus, communication medium is also theevent, sponsorship, direct mail, promotional item tasting, competition, customer orbusiness magazine, trade and service personnel, exhibitions and fairs, all companyidentification symbols etc., not to mention all new tools from the area of informationtechnology.Media market and its development is characterized by continuous growth ofmedia channels and even more varied range of titles, whether print, electronic or others.New advertising and communication media are very dynamic and require innovation andoriginality in approaches and process of media mix planning. Medium is a communicationchannel through which advertising message is extended, carried and transmitted. Into thecategory of "medium" some authors in communication theory include only mass mediathus classic and modern advertising media such as: television, radio, print, cinema, posters,Internet.1 LABSKÁ H., TAJTÁKOVÁ M., LOYDLOVÁ M., MIKLOŠÍK A. 2008. Marketingová komunikácia II.2008.138
TABLE 1.CHARACTERISTICS OF ADVERTISEMENT MEDIATABELA 1. CHARAKTERYSTYKA MEDIÓW REKLAMYASSESSMENTNEWSPAPERS MAGAZINES TV RADIOCRITERIAFunctionof mediaSituation(meetingsbetween theadvertisementobject andadvertisementmessage)Options ofpresentationTime frequencyTime factorPossibilities ofusagePenetration andaccess of peoplePossibilities ofchoiceActualinformation, newsDomesticatmosphere,workplace,morningstext and picture,no movesDailyPossibility ofrepeatingUnlimitedFrom moderate tohigh impact,crossings withother newspapersselection underregional criteria,on the basis ofanalyzing thestructure ofreaders there is areach of wideaudience, regionaldeploymentInformation,fun, educationDomesticatmosphere,evenings,weekendsPicture (color aswell) and text,no movesWeekly,monthlyPossibility ofrepeating,different phasesof usageUnlimitedHigh impact,big crossingSelection ofmagazinesaccording togoal group, overregionaldeploymentActualinformation, funeducationDomesticatmosphere,eveningsMoving picture,color as well,acousticsDaily within aspecified timesingle track,time limitationLegislativelimitationsHigh impact(cumulatedeffect)Real selection ispossible onlyaccording toregional criteriaActualinformation,fun, educationDomesticatmosphere,workplace, outof home, all dayOnly acoustics(speech, music,sounds)dailySingle receive,time limitationDifferentlimitations,Limitedcapacityimpact in therestricted area,possibility ofcrossingsSelection underregional criteriaPhilosophyInformative andargumentationadvertisementArgumentativeadvertisement,emotionalArgumentativeadvertisement,emotionalRationaladvertisingmessages,139
CostsImportance ofmedia withincommunicationmixMedium even highcosts on 10000clientsmediation of thecurrentadvertisingmessages,productintroduction tomarketappeals appeals emotionalappeals (onlyadditionalmedia)Relatively lowcosts on 10000clientsDetailedarguments,imagecreationaverage costs on10000 contactsIntroductionadvertisement,newsannouncement,productdemonstrationLow on 1000contactsQuickdemonstrationof product,introductionadvertisementThe status ofBasic basic basic additionalmediaSource: Kretter et al. 2008. Marketing.Źródo: Kretteri in. 2008. MarketingInternet advertisementUsing the Internet is extremely important to access current information foryoung people, which is reflected as a constantly evolving trend of the communicationmix.Currently new technologies that allow inspection of new products on thewebsite are constantly developed. The customer has the opportunity to zoom in thegoods or turn it as it is for example with cars, motorcycles, handbags. Thus people getmore attractive and interesting innovative products from online environment. Theiractivities are focused on different actions; they can compare different ads and offers thatthey are affected by.2 TNS company conducted in 2010 regular research focused on the utilization ofthe Internet in Slovakia. The study was conducted within an omnibus survey throughpersonal interviews by trained interviewers from TNS SK Ltd. Data collection tookplace in March 2010 on a representative sample of 1031 respondents. The sample ofrespondents interviewed is representative in terms of gender, age, education, region andsize of place. The main findings: Trend of Internet use is growing in Slovakia. While lastyear Internet was actively used by more than half (54.3%) of the population of Slovakia,in March this year there were three fifths of respondents (59.4%). Three fifths ofrespondents (59.3%) have their own home Internet connection. Compared to the sameperiod last year, this proportion increased by almost 9%. From those who do not yethave Internet connection at home, almost one quarter plans to establish a connection tothe Internet over the next year.2 17.05.2010: http://www.tns-global.sk/docs/Ponuka_Slovensko_a_internet_2010.pdf140
The issue of advertisement perception may differ from country to country due tocultural differences characteristic for every country. This aspect was taken into accountwhen processing this paper. The presented survey was conducted in the Visegradcountries. V4 was not created to compete with the existing European institutions noteven to isolate because from other countries but the aim was to make the best possibleintegration into EU structures, in order to preserve its historical and cultural identity andcohesion and also promote regional cooperation. Its paramount concern is to increasestability and democracy for all parts of Europe and the promotion of joint efforts withina specific regional grouping.Top 10 advertisers and top 10 product categories within V4 countriesFollowing tables 2, 3, 4, 5 give review of top ten advertisers and top ten productcategories provide in each of V4 country according to amount of advertising expenditures.3 TABLE 2. TOP 10 ADVERTISERS AND TOP 10 PRODUCTCATEGORIES IN CZECH REPUBLIC IN mil. €TABELA 2. TOP 10 REKLAMODAWCÓW I TOP 10 KATEGORIIPRODUKTÓW W REPUBLICE CZESKIEJ W MIL. €Top 10 advertisersAmount (mil.euro)Top 10 product categoriesAmount (vmil. euro)RINGIER 61,9 PRINT AND BOOKS 274,4PROCTER & GAMBLE 57,6 TELECOMMUNICATIONS, INTERNET 162,5MAFRA 52 AUTOMOBILES 159,8UNILEVER 50,4 DRINKS 129,3HENKEL 42,6 BANCS 116,2VODAFONE 39,3 COSMETICS 103TELEFÓNICA O2 34,1 MEDICINE 84,1VOLKSWAGEN 32,7 FOOD 81,5VLTAVA LABE PRESS 32,1 SWEET AND SALT PRODUCTS 79,4RECKITT BENCKISER 31,9 ELECTRONICS 68,1Source: TNS Media Inteligence, 2009Źródło: TNS Media Inteligence, 2009According to the amount of advertising expenditures belong among the largestCzech advertisers, Ringier, Procter & Gamble, Unilever and Mafra those invested inmedia campaigns more than 50 million €. Product categories in which it was incurredmore than 150 million € are Print, Internet and Telecommunications and Automobilebrands (Table 2).3 Note: For pricing current price lists of controlled media were used. Exchange rate from 15.5. 2009: 1€ =27,028 Kč141
4 TABLE 3. TOP 10 ADVERTISERS AND TOP 10 PRODUCTCATEGORIES IN HUNGARY IN mil. €TABELA 3. TOP 10 REKLAMODAWCÓW I TOP 10 KATEGORIIPRODUKTÓW NA WĘGRZECH W MIL. €Top 10 advertisersAmount(mil. €)UNILEVER 67,7Amount(mil. €)Top 10 product categoriesBANC AND INSURANSECOMPANIES 233,9PROCTER & GAMBLE 57,6 FOOD 224,4TRADE, WHOLESALET-MOBILE188,440,0 TRADE, SHOPPING CENTERSHENKEL 38,5 TELECOMMUNICATION 187,2BAYER 37,3 COSMETICS 186,5PANNON GSM 36,9 CARS 182,3VODAFONE 30,4 MEDICINE 167,0DANONE 29,5 FREE TIME 114,8L'OREAL 27,9 MEDIA, BOOKS, CD, DVD 95,8RECKITT BENCKISER 26,9 DRINKS 88,6Source: TNS Media Inteligence, 2009Źródło: TNS Media Inteligence, 2009A similar situation as in the Czech Republic is also in Hungary where the mostimportant advertisers according to the amount of the financial expenditures arecompanies Unilever and Procter & Gamble. Product categories represented by thebusinesses those spent more than 200 million € for promotion are banks and insurancecompanies and food industry firms (Table 3).Slovak advertisers, who spent on advertising campaigns most financial meansare telecommunications companies Orange and T-Mobile. Logically, therefore, the firstposition in product categories belong to telecommunication companies which togetherwith Internet companies spent on advertising 281, 6 million €. These are followed bybanking, automobile companies and businesses producing nonalcoholic drinks (Table 4).In Poland, as well as in previous V4 countries the largest advertisers areUnilever (156.2 million €) and Procter & Gamble (115.3 million €). Among the top 10product categories companies of food industry and telecommunications lead. Theseenterprises expended more than 500 million € for promotion (Table 5).4 Note: For pricing current price lists of controlled media were used. Exchange rate from 15.5. 2009: 1€ =289,4 HUF142
5 TABLE 4. TOP 10 ADVERTISERS AND TOP 10 PRODUCTCATEGORIES IN SLOVAK REPUBLIC IN mil. €TABELA 4. TOP 10 REKLAMODAWCÓW I TOP 10 KATEGORIIPRODUKTÓW W REPUBLICE SŁOWACJI W MIL. €Top 10 advertisersAmount(mil. €)ORANGE 96,0Amount(mil. €)Top 10 product categoriesTELECOMMUNICATIONS,INTERNET 281,6T-MOBILE 83,3 BANCS 146,7HENKEL 57,9 AUTOMOBILES 124,1PROCTER & GAMBLE 57,2 DRINKS 111,0RECKITT BENCKISER 50,4 COSMETICS 105,0CONFECTIONERY AND SALTYUNILEVER 45,3 PRODUCTS 76,9TELEFÓNICA O2 43,6 MEDICINE 66,4L'OREAL 43,0 FOOD 62,2T-COM 41,5 PARFUMES 61,1NESTLÉ 33,4 DETERGENTS AND SOFTENERS 55,0Source: TNS Media Inteligence, 2009Źródło: TNS Media Inteligence, 20096 TABLE 5. TOP 10 ADVERTISERS AND TOP 10 PRODUCTCATEGORIES IN POLAND IN MIL. €TABELA 5. TOP 10 REKLAMODAWCÓW I TOP 10 KATEGORIIPRODUKTÓW W POLSCE W MIL. €Top 10 advertisersAmount(mil. €)Top 10 product categoriesAmount(mil. €)UNILEVER 156,2 FOOD 580,4PROCTER & GAMBLE 115,3 TELECOMMUNICATION 524,8POLSKA TELEFONIA CYFROWA 99,9 COSMETICS 435,1POLKOMTEL 93,8 BANCS 392,8PTK CENTERTEL 92,9TRADE, WHOLESALE TRADE,SHOPPING CENTERS353,6L'OREAL 81,8 MEDICINE 346,5NESTLÉ 74,2 MEDIA, BOOKS, CD, DVD 303,3DANONE 51,7 CARS 299,4US PHARMACIA 51,6 DRINKS 208,5P4 42,6 FREE TIME 167,2Source: TNS Media Inteligence, 2009Źródło: TNS Media Inteligence, 20095 Note: For pricing current price lists of controlled media were used. Exchange rate from 15.5. 2009: 1€ = 30,126 Sk6 Note: For pricing current price lists of controlled media were used. Exchange rate from 15.5. 2009: 1€ = 4, 4796 zl.143
Own surveyFor processing the problem of advertisement perception the questionnaireresearch was held within respondents at the age from 15 – 25 from V4 countries –Slovak Republic, Czech Republic, Poland and Hungary. 250 respondents from eachcountry participated in this research. In this paper we state chosen parts of research thoserelate to perception of individual types of advertisement and impact of theseadvertisements on purchasing behavior of respondents from mentioned countries.According to the evaluation of individual questions attention was focused onthe length of time over 3 hours spent either by watching or listening the media.Therefore, it can be stated that 28% of respondents within V4 countries spend more thanthree hours daily by watching TV programs, but 10% of respondents do not watch TVprograms ever. Regarding listening to the radio the situation is different; only 13% ofrespondents listen to radio more than three hours daily and 25% do not listen at all.Based on the evaluation of responses we think that 32% of respondents spend more than3 hours daily by using an Internet and 3% of respondents are constantly increasing theintensity of Internet use.Advertising messages communicated by individual advertising media may beperceived by respondents as more or less interesting. Among respondents from the V4countries, there is no statistically significant difference in this perception. The mostinteresting are in respondents’ opinion advertisements broadcasted on television, Internetand print advertising. Radio, leaflets and advertisements out of home do not take somuch interest of respondents (Chart 1).Respondents from individual V4 countries consider being the most attractiveadvertisement broadcasted on TV, this is followed by Internet advertisement, print,billboards, radio and leaflets advertisement. This perception is the same in every countryof Visegrad Four, there is no statistically significant difference among mentionedcountries.Which are the most favorite kinds of advertisement according to respondents isdescribed in chart 2. Among the V4 countries there were no statistically significantdifferences; Hungarian, Slovak, Polish and Czech people find car advertisements to bethe most attractive and interesting. These are followed by cosmetic, food industryproduct and service advertisements.144
CHART 1.WYKRES 1.PERCENTAGE OF ATTRACTIVENESS OF INDIVIDUALADVERTISEMENT TYPESPROCENT ATRAKCYJNOŚCI POSZCZEGÓLNYCH TYPÓWREKLAMYSource: Own processingŹródło: badania włąsneCHART 2.WYKRES 2.PERCENTAGES OF THE MOST FAVOURITEADVERTISEMENTS WITHIN V4 COUNTRIESUDZIAŁ PROCENTOWY ULUBIONYCH REKLAMW KRAJACH GRUPY WYSZEHRADZKIEJSource: Own processingŹródło: badania włąsne145
Following chart 3 give a review of percentages Internet purchases in VisegradFour countries. There is a statistically significant difference between individual countriesin making purchases using Internet but the level of dependence is very low. More thanhalf of Polish (65%) expressed they use to buy products through Internet. They arefollowed by Slovak (54%) and Czech respondents (38%). Only 4% of Polish people donot use Internet for buying things at all, in Hungary this level is higher (20%). Almostone quarter of respondents in Slovakia and Czech Republic watch Internet offers butonly because of their curiosity. This level is much lower in Hungary and Poland.CHART 3.WYKRES 3.PERCENTAGES OF INTERNET PURCHASES DUE TOADVERTISEMENT WITHIN V4 COUNTRIESUDZIAŁ PROCENTOWY ZAKUPÓW INTERNETOWYCHW WYNIKU REKLAMY W KRAJACH GRUPYWYSZEHRADZKIEJSource: Own processingŹródło: badania włąsneConclusionsThe above-mentioned dilemmas in the field of advertisement perception bypeople within Visegrad Four countries can determine the actual amount of advertisementand type of media that will find right customer in optimal way. There are almost nostatistically significant differences among Polish, Czech, Slovak and Hungarian youngpeople in surveyed areas. They find the most attractive advertisement broadcasted on146
TV, this is followed by Internet advertisement, print, billboards, radio and leafletsadvertisement. The most favorite kinds of advertisement according to respondents arecar advertisements. These are followed by cosmetic, food industry product and serviceadvertisements. Statistically important differences were found in field of makingelectronic purchases due to Internet advertisement. That can be called effective onlineadvertisement. The highest percentage was measured among the Polish who werefollowed by Slovak and Hungarian. Czech young people do this just occasionally or theylook advertised offers just because of curiosity.Similarity within V4 countries does not have only historical and culturalbackground but it also demonstrates in way how young people perceive theadvertisement. This can be very helpful for companies those operate internationallywithin these countries because they do not have to change their marketingcommunication strategies.Literature:1. 17.05.2010. Online [23.03.2011]. Available on internet: < http://www.tnslobal.sk/docs/Ponuka_Slovensko_a_internet_2010.pdf>2. Analýza reklamného a mediálneho trhu 2008 - 2009. 2010. Online[23.03.2011]. Available on internet: < http://www.tns-global.sk/docs//prezentacia2009_FINAL.pdf>3. LABSKÁ H., TAJTÁKOVÁ M., LOYDLOVÁ M., MIKLOŠÍK A.:Marketingová komunikácia II, 1.vydanie, Bratislava : VydavateľstvoEKONÓM Bratislava, 2008, 10-16 s., 154 s., ISBN 978-80-225- 2485-84. KRETTER A., a kol: Marketing: 3.vydanie, Nitra: Slovenská poľnohospodárskauniverzita, 2008, 107-110 s., 264s., ISBN 978-80-552-0134-4SummaryThe importance of marketing communication is still increasing. There are a lotof debates about integration of communication tools that can help to achieve moreeffective results mostly when companies try to operate internationally. The presentedpaper provides results of survey conducted within Visegrad Four countries that wasaimed to find out differences among young people in the field of advertisementperception. There were almost no statistically significant differences just in the area ofInternet advertisement effectiveness where the first position of making electronicpurchases due to Internet advertisement is held by Polish respondents.147
Information about authorsIng. Veronika GašparíkováSlovak University of AgricultureFaculty of Econimics and ManagementDepartment of MarketingTr. A. Hlinku 2, 949 76 Nitra, Slovakiagasparikova.v@gmail.comprof. Ing. Ľudmila Nagyová, PhD.Slovak University of AgricultureFaculty of Econimics and ManagementDepartment of MarketingTr. A. Hlinku 2, 949 76 Nitra, Slovakialudmila.nagyova@fem.uniag.sk148
5 (54) 2011Patrik Rovny, Sona Supekova, Maria HambalkovaComparison of Slovak and Polish foreign agrarian tradeForeign trade in agricultural and food products is a very important componentof trade and agricultural policy. In the recent years these policies change influencing onthe result of this trade and indirectly on food producers as well as consumers. The aimof this paper is look through the agrarian trade between Slovakia and Poland. TheSlovak and Polish agriculture is managed by the Common Agricultural Policy. It hasmain impact on both national agrarian policies. The situation in agriculture in bothcountries is different. It is because of the historical development of agriculture in Polandand in Slovakia.IntroductionAgriculture and food industry are the strongest sector of national economy and thebiggest employer, too. These facts points out the important role of agriculture in thenational economy.Very important is the fact, that agriculture creates the countryside economy, situated outof big cities, and forms the primary economy producing material assets. 1 Material assetsare then connected with services, industry and commerce. It is the most important sectorof the national economy and that’s reason why the government has to pay attention tothis sector.Common agricultural policyCommon agricultural policy (CAP) is the most integrated and one of the most importantEU policies based on EU agricultural subsidies and programs. It was created more than50 years ago after Second World War as a respond on the fears of food shortagesexperienced during the war times. It was established to subsidize farmers and encouragethem to produce more to ensure stable food supplies.In the past CAP represented more than 50 % of EU budget. But it led to supportingunsustainable agricultural sectors so after three reforms in 1992, 1999 and 2003 it wasreduced to recent 45 % (55 billion Euro per year) with the prospect of further reductionsin frame of new long term EU budget 2014 – 2020.CAP has two pillars. The current Single Farm Payment comes under Pillar 1 andmeasures of Pillar 2 aim to support rural communities development and diversification.In 2008 the CAP Health Check was launched. It aims to modernize the policy andprovide assistance when answering to new challenges such as climate change. The EU1 Zeitschrift für ausländische Landwirtschaft, 17. Jahrgang, Heft 2, April - Juni 1998, S. 77 — 88149
27 also agreed to further cut direct subsidies to farmers, for the benefit of ruraldevelopment policy, and to abolish milk production quotas.The discussion of the CAP’s future beyond 2010 in context of the general reform of EUbudget has started in 2010. The first contribution to the discussion from EuropeanCommission stressed that agriculture must do more to mitigate climate change andconsider the option to established third pillar of the CAP focusing on this issue. And thecurrent single payment scheme could by maintained but targeted at providing so called"public goods" – to create real EU added value. Former commissioner Mariann FischerBoel committed farmers to help to fulfill EU commitment to reduce carbon emission by20 % by 2020.France is the biggest recipient of CAP funds. The largest per capita beneficiaries fromthe CAP are Greece and Ireland. All four Visegrad countries are net beneficiaries of EUbudget and CAP funding. At the beginning of February 2010 the ministers of agricultureof Hungary, Slovakia and Poland and Romania, Lithuania, Latvia, Estonia, Cyprus andBulgaria agreed in Warsaw on common statement on the future of CAP after 2013. Theywant both pillars to be preserved. They also oppose the idea to base the level of paymenton historical principle.The economic crisis seriously hit European agricultural sector, especially diary farming.Farm milk prices began to fall in late 2008 until it brought the whole sector at the edge.Due to surplus production of milk and diary products and falling prices – Europe wasa witness of several protests of farmers calling for action against volatility of prices andphasing out milk quotas as soon as possible. 2Situation of Agriculture in PolandAgriculture is one of the sectors that profited the most from the Polish accession to theEU. About 15% of the country’s labor force, what is equivalent to 2.2 million full-timeworkers, is employed in farming, thereby providing the biggest - 20% - share in EU27employment in agricultural sector. Despite very high level of employment, theeffectiveness of Polish rural workforce is very small, what is portrayed by the fact thatagriculture contribution to the Polish GDP is just 3%.Polish farmers have experienced a significant rise in their real incomes during 2000-2009, which increased by 107%. EU27 average is just 5%, and the average of the newMember States (EU-12) is 61%. Last year the farmers’ incomes decreased, mainly due tothe plunge in prices of most animal products and almost all plant products.Most Polish farms (over 90%) are operated by the farm holders and their families. Theshare of own-farmed land is 75%. Agricultural land constitutes over the half of the totalarea of the state. Poland is the third largest producer of cereals in the EU-27 – leadingthe rye and oates production, with second best results in potato production. Polandpossesses also the third largest share of EU-27 orchard area and it constitutes the largestapple tree orchard in the EU-27. Moreover, Poland is the fourth largest poultry producer(represents 11% of EU poultry meat production). Furthermore, it provides 6,6% of themilk produced in the EU. Although Polish farmers are very much concerned about2Present and future of Common agricultural policy in Visegrad. Online: http://www.visegrad.info/agricultureand-cap-reform/factsheet/present-and-future-of-common-agricultural-policy-in-visegrad.html150
environmental matters, according to the Eurobarometer survey, Poland is the sixthlargest emitter of Greenhouse Gas emissions from agriculture in the EU (34 mil.tonnes).Poland, along with other 10 out of EU-12, applies SAPS (Single Area Payment Scheme),the simplified version of SAS support scheme. Similarly to all farmers receiving directpayments, Polish farmers are subject to compulsory cross-compliance (CC). However,CC comprises a great concern for farmers, as those failing to meet requirements couldloose direct payments, even if their farms have been traditionally cultivated forgenerations. This poses a problem especially to states like Poland with a majority oftraditional farms struggling economically and thus struggling to meet CC requirements.Poland implemented the Rural Development Programme 2007-2013 (RDP) with totalbudget of 17 billion Euro. Poland’s RDP is based on the multifunctionality of agricultureand rural areas. The aims of RDP in Poland are: strengthening of the economiccompetitiveness of agricultural holdings and of the agri-food sector, contributing to landmanagement and environmental protection, and enhancing the quality of life anddiversify the agricultural economy.The Polish main priorities for the next CAP programming period are: simplifying thesystem of agriculture funding system for all farmers in the EU, withdrawing historicalprinciple when assessing the base level of payment (the system that contributes to unjustdifferentiation in support allocation to farmers). Poland also wants the currentinstruments of the CAP to be maintained. According to the Eurobarometer survey, 85%respondents in Poland support the standpoint of Minister Sawicki.Situation of Agriculture in SlovakiaSince 1989 Slovak agricultural sector has faced several challenges. The productionreduced by 30 % because of low demand and high import between 1990 and 1997.Former agricultural cooperatives and state-owned companies were transformed intoprivate business companies and co-partner cooperatives.According to Eurostat Farm structure Survey in Slovakia 2007 – 92 % of utilizedagricultural area in Slovakia was in farms of over 100 ha. Only 9 % of the agriculturalarea was farmed by its owners. It also recorded 69,000 agricultural holdings. Quarter ofSlovak farms specialized in cereals, oil seed and protein crops.The strategic objective of the agricultural and food policy for the years 2004 and 2013 ispreserving agriculture in all production conditions within the scope justified by theability to produce competitive products and by the need to ensure more effective use,protection, regeneration and permanent reproduction of natural sources, as well as by theneed to preserve balanced environment, cultural, country and rural settlement".Program of Rural Development for programming period 2007 – 2013 focuses on farmmodernization, increasing economic value of forest, farming and maintainingendangered species of animals, continuing favorable condition of the forest inhabitants,diversification into non-agricultural activities, investment into leisure and hospitalityfacilities, encouragement of rural tourism and village revitalization and development ofsocial infrastructure and services.151
In new EU budget perspective for the years 2014 – 2020 Slovakia support preserving ofdirect payment as a base of first pillar of CAP, but insists on withdrawing of historicalprinciple.The economic crisis has a bad impact also on Slovak farm production – it lowered thecontribution of agriculture on GDP and also volatility in cash-flow of the farms. 3Foreign Agrarian Trade between Slovakia and PolandThe figure 1 shows the volume of agrarian export and import of Slovakia and Poland in2010. From this figure we can see negative trade balance of agrarian trade. It means thatthe Slovak Export of agrarian commodities is smaller than Polish import into Slovakia. Itis because the Poland is neighbor country of Slovakia. The second important reason isthat the prices of agrarian commodities are lower than in Slovakia. The reason is alsobecause the same features of consumers.Foreign Agrarian Trade between Slovakia and Poland (year 2010)in thousand Euro350 000,00300 000,00250 000,00200 000,00150 000,00100 000,0050 000,00--50 000,00-100 000,00-150 000,00Export Import BalanceFigure 1 Foreign Agrarian Trade between Slovakia and Poland (year 2010)Source: www.statistics.sk, 2011Table 1 shows agrarian commodities which are most exported from Slovakia to Poland.For the commodities evaluation we used RCA indicator.The revealed comparative advantage is an index used in international economics forcalculating the relative advantage or disadvantage of a certain country in a certain classof goods or services as evidenced by trade flows. It is based on the Ricardiancomparative advantage concept.3Present and future of Common agricultural policy in Visegrad. Online: http://www.visegrad.info/agricultureand-cap-reform/factsheet/present-and-future-of-common-agricultural-policy-in-visegrad.html152
It most commonly refers to an index introduced by Béla Balassa (1965):RCA = (E ij / E it ) / (E nj / E nt )where: E – Exports, i - Country index, n - Set of countries, j - Commodity index,A comparative advantage is “revealed”, if RCA>1. If RCA is less than unity, the countryis said to have a comparative disadvantage in the commodity or industry. 4In table 1 are commodities in order by the volume of export. We can see that Slovakia isexporting mainly malt, corn, wheat, chocolate, sugars, oil rape seeds, live roosters, hens,ducks, turkeys and other commodities, extract of concentrate essence from coffee, tea,malt extracts, Fruits and nuts and other commodities.Table 1:Export, Import, Balance of Agrarian Trade between Slovakiaand Poland and Indicator RCA of chosen commodities, 2009N. CommoditiesExport inthousandEuroImportExport inthousandEuroBalanceinthousandEuroIndicatorRCA1. Malt 40 263,65 45,30 40 218,35 5,63032. Corn 17 352,25 24,04 17 328,22 5,42233. Wheat 14 921,62 58,45 14 863,17 4,38284. Chocolate and products with cocoa 13 673,85 16 946,17 -3 272,32 -1,37415. Other sugars, ,lactose, syrups 9 932,31 2 018,22 7 914,09 0,43406. Seeds of oil rape 9 046,70 1 219,53 7 827,17 0,84447. Live roosters, hens, ducks, turkeys 8 049,81 120,29 7 929,52 3,04408. Extract of concentrate essence from coffee, tea 5 727,03 7 334,02 -1 606,99 -1,40699. Malt extracts 4 260,98 949,37 3 311,61 0,341910. Fruits and nuts (also preserved) 2 296,37 2 896,86 -600,50 -1,391811. Beer from malt 1 982,69 2 344,14 -361,45 -1,327012. Starch, inuline 1 841,35 629,63 1 211,73 -0,086413. Preparatories for soups, bouillon 1 761,05 1 793,21 -32,16 -1,177614. Beef meat, fresh and cold 1 682,15 2 557,24 -875,09 -1,578415. Plant fat oil 1 663,13 48,04 1 615,10 2,385016. Live cattle 1 412,16 23,08 1 389,08 2,954217. Milk and milk cream 1 326,93 2 031,31 -704,37 -1,585318. Sugare cane and Rape sugar 1 252,66 1 815,75 -563,09 -1,5308Source: www.statistics.sk, 20114 Balassa, B. (1965), Trade Liberalisation and Revealed Comparative Advantage, The Manchester School, 33,99-123153
Table 2 shows agrarian commodities which are most imported from Poland to Slovakia.Order of commodities is by the volume of import. We can see that Slovakia is importingmainly cheese and cottage cheese, pork meat, rape oil and mustard oil, eggs, otherpreparatories and cans from meat, variety meat ,blood, coffee, ice cream, otherpreparatories and cans from vegetable, buttermilk, sauer milk, yoghurt, cabbage,cauliflower, brassica, fresh and cold, Margarine, mixture and preparatories plants fatsand oils.Table 2:Export, Import, Balance of Agrarian Trade between Slovakia andPoland and Indicator RCA of chosen commodities, 2009N. CommoditiesExport inthousandEuroImportExport inthousandEuroBalanceinthousandEuroIndicatorRCA1. Cheese and cottage cheese 951,35 30 630,38 -29 679,04 -1,16712. Bakery products 4 329,86 26 993,06 -22 663,21 0,47473. Pork meat, fresh, cold and frozen 1 255,65 16 108,02 -14 852,38 -0,24694. Non alcoholic drinks 2 196,83 12 776,56 -10 579,72 0,54415. Poultry meat, fresh, cold and frozen 2 609,55 11 512,43 -8 902,89 0,82056. Food preparatories 1 932,70 11 067,11 -9 134,40 0,55977. Rape oil or mustard oil 420,71 10 778,70 -10 357,99 -0,93868. Eggs 655,84 9 858,17 -9 202,33 -0,40549.Other preparatories and cans from meat, varietymeat ,blood211,13 7 432,08 -7 220,94 -1,256310. Coffee 71,32 7 047,12 -6 975,80 -2,288511. Ice cream and similar products 0,02 6 024,91 -6 024,89 -10,362212. Fruits juices 950,71 5 306,70 -4 355,99 0,585213. Other preparatories and cans from vegetable 0,04 5 232,39 -5 232,35 -9,428014. Preparatories used for animals nutrition 1 847,88 5 190,50 -3 342,62 1,271915. Buttermilk, sauer milk, yoghurt 2,10 4 841,54 -4 839,44 -5,437816. Other preparatories and cans from fishes 9,32 4 535,83 -4 526,50 -3,882517. Cabbage, cauliflower, brassica, fresh and cold 5,55 4 308,43 -4 302,87 -4,3494Margarine, mixture and preparatories plants fats18.37,48 4 055,09 -4 017,61 -2,3793and oilsSource: www.statistics.sk, 2011All described commodities reached negative volume of RCA indicator. It means that thementioned commodities achieved comparative disadvantage. Other commoditiesmentioned in table 2 achieved positive volume of indicator RCA. It means that theyachieved comparative advantage.154
ConclusionThe situation in Slovak foreign agrarian trade is more complicated. The share of foodproducts (with the higher value added) in the total export of Slovakia has been on theupgrade, but the value of their export does not reach the import value level. In 2009, thetotal negative trade balance of the foreign agri-food trade (–950 mill. Euro) wasregistered. In 2009 in comparison with the previous year, the export of Slovak agri-foodcommodities to decreased to Poland by 17.0%.Last year’s balance of Poland’s foreign trade in agricultural and foods products stood atEuro 1.5 billion. During the first five years of Poland’s EU membership, the exports ofagricultural and food products grew from Euro 4.0 billion to Euro 11.3 billion, andimports from Euro 3.6 billion to Euro 9.8 billion. Both exports and imports increased 2.8times. The positive balance went up from Euro 0.4 billion to Euro 1.5 billion, i.e. 3.3times. These results speak for themselves.Slovakia achieved negative trade balance with agrarian trade with Poland in 2010. Itmeans that the Slovak Export of agrarian commoditties is smaller than Polish import intoSlovakia. It is because the Poland is neighbour country of Slovakia. The secondimportant reason is that the prices of agrarian commodities are lower than in Slovakia.The reason is also because the same features of consumers.References1. Balassa, B. (1965), Trade Liberalisation and Revealed Comparative Advantage,The Manchester School, 33, 99-1232. Récky, R. – Dobák, D. – Rovný, P.: The Evaluation of the Marketing Level ofSugar Beet Production and Consumption in the Production-EconomicalConditions in Slovakia In International Scientific Days 2010 : Global Economy:Challenges and Perspectives, 11th International Conference, May 26-28, 2010,Nitra, proceedings of reviewed articles of international scietific conference. -Nitra : Slovak University of Agriculture, 2010.3. Zeitschrift für ausländische Landwirtschaft, 17. Jahrgang, Heft 2, April - Juni1998, S. 77 — 884. Present and future of Common agricultural policy in Visegrad. Online:http://www.visegrad.info/agriculture-and-cap-reform/factsheet/present-andfuture-of-common-agricultural-policy-in-visegrad.html5. www.statistics.skSummaryThe aim of this paper is look through the agrarian trade between Slovakia andPoland. The Slovak and Polish agriculture is managed by the Common AgriculturalPolicy. It has main impact on both national agrarian policies. The situation in agriculturein both countries is different. It is because of the historical development of agriculture inPoland and in Slovakia. Slovakia achieved negative trade balance with agrarian tradewith Poland in 2010. It means that the Slovak Export of agrarian commodities is smallerthan Polish import into Slovakia. It is because the Poland is neighbor country ofSlovakia. The second important reason is that the prices of agrarian commodities arelower than in Slovakia. The reason is also because the same features of consumers.155
Contact AddressIng. Patrik Rovný, PhD.Slovak University of Agriculture, Faculty of Economics and Management,Department of Marketing, Tr. A. Hlinku 2, 949 76 Nitra, Slovakiae-mail: patrik.rovny@fem.uniag.skIng. Soňa Supeková, PhD.Slovak University of Agriculture, Faculty of Economics and Management,Department of Marketing, Tr. A. Hlinku 2, 949 76 Nitra, Slovakiae-mail: sona.supekova@yahoo.comprof. Ing. Mária Hambálková, PhD.Slovak University of Agriculture, Faculty of Economics and Management,Department of Marketing, Tr. A. Hlinku 2, 949 76 Nitra, Slovakiae-mail: maria.hambalkova@fem.uniag.sk156
5 (54) 2011Peter Serenčéš, Zuzana GallováInfluence of cash flows from the Common AgriculturalPolicy on liquidity of Slovak trading companies inagriculture in the period 2000-2009AbstractSlovak agriculture is constantly dynamically changing. Accession process to the EU ofthis sector is important for Slovak agriculture harmonization of agricultural policyrelated to the Common Agricultural Policy.Integration into the European Union and as well as using the funds of the CommonAgricultural Policy significantly affect financial ratios and others indicators as liquidity,solvency and cash flow, which was evaluated the financial statements of assessedfinancial management.Financial situation of entity is a mirror through which the enterprise is perceived by itssurroundings. The situation of liquidity is a determinant, which influences the opinion ofexternal subjects about entity and its financial health.The paper compared the period before and after accession to the European Union (EU),it means the period from 2000 to 2009 with the aim to find the answer if the financialliquidity of Slovak enterprises in agriculture have had a positive or negativedevelopment trend.IntroductionAgricultural enterprises are characterized by many features, which are differfrom enterprises of other sectors of national economy, such as: seasonality, continuity,long-term periodical and biological character of production, fixed of physical capital, aswell as dependence process and results of production processes to climatic conditionsand riskiness of the final production. These features of agricultural production depend ontime of dependence financial means in individual forms of property within theproduction process as well as the time of payment of their claims 1 .Situation of the Slovak Republic after accession to the EUSlovakia's accession to the EU was accepted by the Slovak farmers and broughtthem many positives. Long time planned accession of the Slovak Republic was1 SERENČÉŠ, P. - MAJERNÍK, M. 2009. Investičná činnosť poľnohospodárskych podnikov a jej financovanienástrojmi kapitálového trhu, 1.vyd. Nitra: SPU, 95 s., ISBN 978-80-552-0271,157
welcomed by agrarian producers with the expectation of improving the businessenvironment, expansion of missing of financial resources through support by means ofthe EU and with the hope of opening the single European market. In 2004, EU accessionbecame a reality, but all expectations were not met. Support resources, although theyhave increased, while lagging behind the level of the EU countries, we will equal to2013 2 .Main instrument for funding has become the European Agricultural Guidanceand Guarantee Fund (EAGGF) and co-financing from the state budget. Financing of theagriculture after entry has been significantly changed and is influenced bymacroeconomic and microeconomic factors. Influence of finance-economic tools isconstantly in motion and reacts to changes of environment in agri-food industry 3 .Common Agricultural Policy (CAP)During the existence of CAP many changes have happened. The CommonAgricultural Policy (CAP) was the most important and the most influential policy for theagricultural sector and the agricultural areas in the EU. In 1980 it was founded that up todate sectoral interest of the Common Agricultural Policy was inadequate to thenecessities of European agriculture and to the changing necessities of society. Thusbegan a series of reforms, which led to the formation of second pillar of the CommonAgricultural Policy 4 .The basis of all these reforms was a transfer from price-distorting policy ofprices support to less distorting direct payments policy. Altogether was to reduce theadministrative prices and farmers' income shortfall were offset by direct payments fromthe EU budget 5 .Cash flows and liquidityIn a market economy underestimation of cash flow problems involve in thefinancial management of an inability of large sections of the enterprises to pay itsobligations to suppliers. It is caused by high fixation of stocks of all kinds and a largepart of uncollectible debts. It causes failures of financial flows in the enterprise,especially the expressive problems in the management of liquidity 6 .2 GRZNÁR, M.. 2008. Efektívnosť slovenského poľnohospodárstva po vstupe do Európskej únie. In:Ekonomika poľnohospodárstva. Bratislava: Výskumný ústav ekonomiky poľnohospodárstva a potravinárstva,2008. roč. 8, č. 1, s. 13-19, ISSN 1335-6186,3 SZOVICS, P. 2006. Úverová politika v poľnohospodárstve po vstupe SR do EÚ, In: Zborník príspevkovz medzinárodnej vedeckej konferencie – Medzinárodné vedecké dni 2006: Konkurencieschopnosť v EÚ, výzvapre krajiny V4. Nitra: SPU, 1169 – 1176 s., ISBN: 80-8069-704-3,4 ENRIGHT, P. 2008. The EU´s Common Agricultural Policy rural development pillar: ana appraisal. In:Medzinárodné vedecké dni 2008: Konkurencieschopnosť a ekonomický rast: Európske a národné perspektívy.Nitra: SPU, 2008, s. 26, ISBN 978-80-552-0061-3,5 POKRIVČÁK, J. – CIAIAN, P. 2004. Agricultural Reforms In Slovakia. Finance a Úver/Czech Journal ofEconomics and Finance, roč. 54, 2004, č. 9 -10, 420-435 s., ISSN 0015-1920,6 BELICA, M. 2002. Podnikové financie. Nitra: SPU, 2002, 42, 58-69 s., ISBN 80-8069-006-5,158
The liquidity of trading partners is the soundness of enterprise during creatingcontacts. Degree of liquidity is related with other areas of management of enterpriseand therefore for the reliable evaluation of the success of business there must be atleast consideration even profitability, as well as other indicators of enterprise’smanagement 7 .Aim of liquidity’s indicators is formulated a potential ability of enterprise topay debts at the moment. Solvency ratios derived enterprise’s liquidity from ratiobetween current assets as the group the most liquid assets and short-term debt asobligations paid in the near future 8 .Payment solvency and Slovak agricultural enterprisesEnterprises have inadequately secured the sale of products, protection againstunwanted price’s movements, production quality and also disposal with costs. This arereasons the primary payment insolvency for enterprise’s subject. A secondary insolvencyconsists in the overdue accounts in specified time and value for customers 9 .The agrosector in present time must respond to declines in sale prices ofvegetable and animal products, sales are decreasing and gets worse liquidity of agrifoodenterprises 10 .At the enterprise’s survival needs there is a need of real money and not only yield onpaper, which is presented in double-entry bookkeeping. Permanent payment ability andliquidity became a short-term enterprise’s aim. The basis for their management is just thecash flow statement 11 .Financial measures from the European funds to support agriculture can beobtained only by producing successful projects oriented on support of productiveagriculture and support of sustainable rural development. Risk is connected with theirdesign 12 .Payments from the CAPSlovakia has the possibility of taking non-refundable financial means from theEU structural funds, from the 1st of January 2004. Time mismatch between demand offinance and actual payout of subsidies from state causes considerable problems tofarmers. Downward payment of subsidies means that money for farmers on this year,7 KOŠČO, T. et al. 2006. Podnikové financie. Nitra: SPU, 2006, 147 s., ISBN 80-8069-725-68 GRÜNWALD, R et al. 1992.Finanční analýzy a plánovaní. Praha: Nad zlato, 1992. 110 s., ISBN 80-900383-8-7,9 SERENČÉŠ, P. 2005. Faktory podnikovej úspešnosti v podmienkach európskeho agrárneho trhu. In: Zborníkz vedeckého seminára, Nitra: SPU, 2005, 44-47 s., ISBN 80-8069-615-2,10 VEREŠPEJOVÁ, A. 2009. Slovenskí farmári, už vás melie hospodárska kríza. In: Farmár, č. 9, 2009, 8-11s., ISSN 1337-740X,11 FICZOVÁ, I. 2000. Vykazovanie Cash flow. In: Finančný manažér, roč. 1, 2000, č. 1, s. 15-19, ISSN 1335-5813,12 KOŠČO, T. – TÓTH, M. 2005. Východiská a pozície poisťovacieho trhu na území Slovenskej a Rakúskejspolkovej republiky. In Zborník z vedeckého seminára s medzinárodnou účasťou (CD) "Faktory podnikovejúspešnosti v podmienkach európskeho agrárneho trhu". Nitra : SPU, 2005, 305-311s., ISBN 80-8069-615-2,159
they receive until December and in the worse case Agricultural Paying Agency isauthorized to transfer money until June next year, when is late for agriculture because ofseasonality. Banks actively support projects financed from the EU structural funds toresolve this issue and cover a yearlong demand of finance in agricultural basic industry.Banks provide to farmers bridge loans on frontload support, which can be obtainedmainly through direct payments from EU funds and state budget 13 .One of the priorities of the CAP for the 21st century is that payments from theCAP distributed fairly and insists that the distribution was fair for farmers in the old andnew Member States, too. The team of authors agreed on the fact that all farmers of theEU should be given a direct payments based on area acreage which is financing of EUand they refuse any additional financing, which would undermine fair economiccompetition in the EU single market 14.Material and methodsThe aim of the paper is to calculate liquidity ratios in order to assess influenceof cash flows from the Common Agricultural Policy on liquidity of Slovak tradingcompanies in agriculture in the period 2000-2009.Liquidity indicators, as part of an analysis overall financial situation of entity,allow to formulate ability of an entity to pay obligations on time. In this paper, therewere used ratio indicators of liquidity formulated in the book by Zalai et al. (1998) 15 :The financial-economic analysis of enterprise.L1 cash ratio (liquidity 1st degree) = short term financial assetscurrent liabilitiesL2 current ratio (liquidity 2nd degree) = short term financial assets + short-term debtcurrent liabilitiesL3 total liquidity (liquidity 3rd degree) = short term financial assets + short-term debt + stockcurrent liabilitiesWe have set aside for purposes of calculating only trade companies, so jointstock companies and limited liability companies (code in database 55) from a databaseof agricultural enterprises of the Slovak Republic. Their quantity was 722 beforeapplying the statistical measurement.The region of SR was not taken into account in the calculation. The data aretaken globally for the whole of Slovakia in the period 2000-2009, so 10 years, with anemphasis on assessing whether the financial flows from the CAP contributed toimproving the liquidity or liquidity deteriorated.13BALOGHOVÁ, B. – RÁBEK, T. 2006. Bankový úver ako dôležitá zložka cudzích zdrojov. In:Medzinárodné vedecké dni 2006 „Konkurencieschopnosť v EÚ – výzva pre krajiny V4“. [Zborník na CDROM]. Nitra: SPU, 2006, 1009-1015 s., ISBN 80-8069-704-3,14 SERENČÉŠ et al. 2010. Financie v poľnohospodárstve, 1.vyd. Nitra: SPU, 167- 168 s., ISBN 978-80-552-0438-3,15 ZALAI, K. et al. 1998.: Finančno-ekonomická analýza podniku. Bratislava: SPRINT, ISBN 80-88848-18-0,160
The inconclusive values (smaller and equal to 0) and extreme values (5% of thelowest and 5% of the highest entities per year) of the statistical measurement wereautomatically retired. Calculated values of indicators were analyzed using statisticalsoftware Statgraphics.To assess the trend of liquidity, there were used Box-plot and descriptivecharacteristics: count, average, median, standard deviation, coefficient of variation,minimum, maximum, range, lower quantile, upper quantile. On this basis, the resultswere presented through a spreadsheet and graphical representations of figures, box-plotanalysis and development figures.The primary source of information was the individual anonymous data comingfrom Information sheets of Slovak Ministry of Agriculture (MP SR). This isa departmental database of agricultural enterprises in the Slovak Republic. The period2000-2008, the Slovak currency, the Slovak crown data are presented in thousands ofSKK. Therefore, it would not be appropriate to recalculate the indicators for the euro,because the rate of exchange was changed during the reporting period and until 2009there was a fixed exchange rate 30.126 SKK / 1 EUR fixed at 1.1. 2009, when Slovakiaadopted the euro currency.Secondary sources of information were scientific publications of domestic andforeign authors, scientific papers, Green Report from 2000 to 2009, Statistical Yearbookfrom 2000 to 2009, Research Reports of the Research Institute of Agriculture and FoodEconomy. There was also used information from the Farm Structure Census from theperiod 2001-2009, whereas the data for the period 2001-2011 will be published in 2012.ResultsThe structural census farms (FSC) within the agricultural statistics is carried outin the European Union at intervals of 10 years. This finding is a part of the Europeanagricultural statistics project, which is managed by the Statistical Office of the EuropeanUnion - EUROSTAT.According to the structural farms census of 2001 there were 6995 registeredfarms which average area was 349 ha. In the country, there are three types of entity.Legal enterprises, cooperative farms, joint stock companies and limited companiesmanaged to 77% of agricultural land. Enterprises of self-employed farmers are muchsmaller and their part of agricultural land area is only 9%. The third category enterprisesare unregistered small and subsistence farms, which use only about 14% of totalagricultural land area (see Table 1) 16 .16 http://portal.statistics.sk/showdoc.do?docid=33787.161
Table 1 Structure of agricultural enterprises in the Slovak Republic in 2001TypeagriculturalenterprisesFarmsAreaagriculturalsoil in thousandhectaresAverage areain haPart ofoverall areaagriculturalsoil in %Cooperative farm 715 1131 1582 46,4Trading company 722 723 1002 29,6- limited companies. 627 550 877 22,5- joint stock companies 94 173 1842 7,1∑trading companies and cooperative farms 1522 1890 1241 77,4SEF 1 5473 215 39,2 8,8Other soil* 335 13,7Total 6995 2439 349 100Source: Structural census farms SR (FSC) 2001* include unregistered small farm, subsistence farms, parcels of home, gardens1 SEF - self-employed farmerDevelopment of individual items of liquidity, which make the basis for thecalculation of liquidity, is described in Table 2. The value of the numerator was in theperiod before accession to the EU less than the denominator and after integration into theEU in 2004 there occurred the opposite trend. Development of liquidity began to have anupward trend, while the best value for ten years have been reached limited companiesand joint stock companies in 2009, when there was a transition to the single currencyeuro and enlarge opportunities to get financial resource not only from EU funds, but alsofrom public resources of the Slovak Republic.Table 2 Development of liquidity items in the period 2000–2009 in EurosItem Stock Current claims Short term financial assets Current liabilitiesRok2000 6497939 3546168 1158313 64707132001 7299867 3903633 1203058 74181412002 7877737 4093133 1174885 77269752003 7961873 5039261 1251525 92679262004 8095333 5358888 1698819 84686472005 8952824 6294388 2389709 96464072006 8228252 6449681 2090975 83078292007 9441033 8226507 2612831 112757662008 10125596 7953004 2160311 105565482009 307500041 292740864 62099535 402388005Source: Information sheets Ministry of Agriculture, own processing (authors)The analysis of three degree of liquidity was performed in accordance with theprocedures described in the methodology. Key of examination of ability to payobligations is cash ratio, followed by current ratio and total liquidity in the next step.162
1 Cash ratio (L1)As it can be seen in Table 3 for descriptive characteristics of the cash ratio inthe period 2000-2009 there was analyzed a total number of 6286 enterprises from a totalof Slovak agricultural subjects. This number does not match the number of tradingcompanies in Table 1, because of companies with inconclusive value of liquidity(negative and zero) were excluded from the analysis. In individual years there wereachieved optimal values, the relative values were most stable in the years 2000 to 2003as it is described by the average and median values in Table 3.Next years were typical expressive increase in liquidity by the year 2007, whena stagnation of growth happened and then in 2008 a expressive decrease in liquidity tookplace. This condition was associated with the economic situation in the country andpaying subsidies by the end of the year. For example in year 2006, the payment periodran from 01.12.2006 to 31.6.2007. The situation has again slightly improved in 2009, butdid not receive values years 2003-2007. The reason was the influence of a higher debtratio of property trading companies because they are more worthless in term of the profitand return loans, and therefore they have better access to loans and the banks give themloans to a greater rate than cooperative farms.Position and development of indicator L1 is also possible to assess upon thevalue of the minimum, maximum and margins range. While in 2000-2003 it ranged from1.36864 to 1.70655, from 2004, this value step by step increased to a value of 5.39385 in2006, when after that period, alternately risen and fallen, and achieved a value of4.09383 in 2009, which means the difference between the maximum and minimum valueof liquidity in the group of trading companies. Last two columns display the fact that50% of enterprises with non-extreme conditions is in the interval from 0.0435304 to0.459014Table 3 Descriptive characteristics of indicator L1 for each yearYear Count Average MedianStandarddeviationCoeff.ofvariationMinimum Maximum RangeLowerquartileUpperquartile2000 539 0,26059 0,112708 0,347362 133,298% 0,00781024 1,71436 1,70655 0,044286 0,2940232001 570 0,220731 0,0903755 0,305934 138,6% 0,00677296 1,50286 1,49608 0,0339945 0,2563992002 583 0,218789 0,0868956 0,316619 144,714% 0,00435199 1,84781 1,84346 0,0306102 0,2430132003 660 0,199622 0,0780103 0,287922 144,234% 0,00295058 1,37159 1,36864 0,0249396 0,2335122004 624 0,44189 0,192601 0,589576 133,421% 0,00666414 2,95842 2,95175 0,0570909 0,5879762005 689 0,555495 0,285809 0,709345 127,696% 0,00923904 3,86957 3,86033 0,0977151 0,6872452006 673 0,612188 0,240336 0,910335 148,702% 0,0078155 5,39385 5,38603 0,062037 0,7301662007 697 0,597166 0,234938 0,881094 147,546% 0,00667736 5,00148 4,99481 0,0643736 0,69042008 619 0,515331 0,157506 0,904527 175,524% 0,00352755 5,32258 5,31905 0,0401646 0,4659092009 632 0,424132 0,120156 0,75832 178,793% 0,00266058 4,09649 4,09383 0,0308902 0,405033Total 6286 0,41351 0,145303 0,68122 164,741% 0,00266058 5,39385 5,39119 0,0435304 0,459014Source: own processing (authors)Following Boxpolot analysis (Figure 1) it can be stated that from 2000 to 2003there was achieved a low level of liquidity L1 and its process was sluggish character. In163
the year 2004 the change in the level of liquidity occurred, when the average value of theindicator rose more than doubled and this trend was maintained until 2007. Except anincrease of average value there was also an increase in range of more than 50%, buta minimum value of liquidity has remained the same. The change occurred in year 2008and not even in year 2009 the level of liquidity did not increase.Fig. 1 Boxplot for cash ratioYEAR20002001200220032004200520062007200820090 0,5 1 1,5 2L1Source: own processing (authors)2 Current ratio (L2)Indicator of cash ratio is closely connected with indicator L2, so current ratio,which is extended about short-term debt in the numerator. This also related with resultsof higher values of descriptive characteristics of the L2.As shown in Table 4 about current ratio, the number of companies analyzed inthe period 2000-2009 has not changed. Average and median describe in the period 2000––2003, that there reached slow upthrow of value current ratio. Since 2004 there has beenexpressive increase in liquidity. Consequently in 2007 there has been stagnation ofgrowth of liquidity and then in 2008 and 2009 slight decrease L2.State and development of the indicator L2 is also possible to assess upon thevalue of the range. While in 2000-2003 there was range from 3.47594 to 4.3202, since2004, this value step by step increased to the value 9.89902 in 2007 and second bestvalue was achieved in 2009. Upper and lower quartile deal that 50% of enterprises withnonextreme conditions is in the range from 0.397258 to 1.43886.164
Table 4 Descriptive characteristics of indicator L2 for each yearYear Count AverageMedianStandarddeviationCoeff. ofvariationMinimum Maximum RangeLowerquartileUpperquartile2000 539 0,883636 0,606813 0,750998 84,9895% 0,125843 3,65578 3,52993 0,339903 1,194592001 570 0,829104 0,605413 0,710774 85,728% 0,120559 3,82699 3,70643 0,33726 1,083652002 583 0,758214 0,545772 0,651324 85,9024% 0,0855742 3,56151 3,47594 0,306136 1,008672003 660 0,759773 0,523409 0,704645 92,7442% 0,085584 4,01647 3,93089 0,290113 0,9736162004 624 1,06335 0,756021 0,912109 85,7769% 0,110286 4,43049 4,3202 0,41015 1,46722005 689 1,24176 0,882829 1,06906 86,0917% 0,129648 5,568 5,43835 0,502048 1,712322006 673 1,44669 0,98434 1,26868 87,6951% 0,162909 6,06829 5,90538 0,525895 2,016862007 697 1,57557 0,990129 1,63256 103,617% 0,146431 10,0455 9,89902 0,538484 1,994542008 619 1,4222 0,855305 1,52206 107,022% 0,133699 7,34096 7,20726 0,459437 1,776572009 632 1,35339 0,819854 1,55786 115,108% 0,0998277 8,01538 7,91556 0,389424 1,59971Total 6286 1,14842 0,741159 1,1916 103,761% 0,0855742 10,0455 9,95988 0,397258 1,43886Source: own processing (authors)On the base of Boxpolot analysis (Figure 2) it can be concluded that the processof current ratio was similar to the process of L1 in the individual years 2000-2008. Thedifference between the years 2000 to 2003 and 2008 and 2009 was not as expressive asin L1.Fig. 2 Box-and Whisker Plot of the current ratioYEAR2000200120022003200420052006200720082009Source: authors0 0,5 1 1,5 2 2,5 3 3,5 4 4,5 5165
3 Total liquidity (L3)Analysis of liquidity is completed with the total liquidity, where the numeratorincludes stocks that have compared to other items of numerator lower liquidity.Table 5 presents total liquidity on the basic of descriptive characteristics.Number of analyzed enterprises in the period 2000-2009 remained unchanged. As theaverage describes for the period 2000-2003 there was step by step decrease in the valueof the degree of liquidity. Since 2004, the value of average gradually increased until2007, but value of median in the column slightly falled, the reason is the increasingnumber of analyzed enterprises in different years of measurement.The value of liquidity by the upper and lower quartile presents that 50% ofenterprises with nonextreme conditions is the range from 1.00944 to 3.06851.Table 5 Descriptive characteristics of indicator L3 for each yearStandard Coeff. ofLower UpperYEAR Count Average MedianMinimum Maximum Rangedeviation variationquartile quartile2000 539 2,18716 1,61038 1,65292 75,5736% 0,378704 8,25978 7,88107 0,997774 2,984142001 570 2,08786 1,52278 1,63685 78,3985% 0,418619 9,27229 8,85367 0,949442 2,685742002 583 2,01173 1,46165 1,56614 77,8505% 0,374687 8,25305 7,87836 0,904405 2,626242003 660 1,85499 1,38929 1,47657 79,5997% 0,33385 8,56222 8,22837 0,829572 2,421532004 624 2,27455 1,64135 1,75521 77,1672% 0,42311 8,64164 8,21853 1,01528 2,940322005 689 2,3618 1,74495 1,86204 78,8399% 0,398353 9,85087 9,45251 1,03846 3,232562006 673 2,75638 1,90515 2,18639 79,321% 0,459298 10,3333 9,87404 1,16446 3,797742007 697 2,79627 1,86564 2,50834 89,703% 0,408594 14,5341 14,1255 1,10484 3,759942008 619 2,67049 1,77098 2,2388 83,8348% 0,490468 10,6469 10,1564 1,13176 3,553582009 632 2,48974 1,54117 2,55941 102,798% 0,361553 13,7576 13,396 0,957414 2,90115Total 6286 2,36133 1,64224 2,01808 85,4637% 0,33385 14,5341 14,2002 1,00944 3,06851Source: own processing (authors)Fig. 3 Box-and Whisker Plot of the total liquidityYEAR2000200120022003200420052006200720082009Source: authors0 3 6 9 12L3166
Figure 3 Box-plot analysis of the total liquidity shows that L3 compared withL1 had the smallest difference in values of 2000–2009.SummaryThe agriculture in the Member States of EU had an important role now and inwill stay the same in the future. Therefore, a big part of the budget is currently directedto this sector. After joining the EU, transfers from the CAP in agriculture has increased.Slovakia opened to all countries in the group. Slovakia's accession to the EU took placeduring the approval of a comprehensive reform of the CAP, which was a response tocontinuing problems with overproduction of the European agriculture.Disadvantage of the Slovak Republic was that it was discriminated in directpayments over the primal States of EU and direct payments were calculated the basis ofactual yields of cereals in the reference period 2000-2002. This period representeda period when agriculture in the EU was the top of development and the Slovakagriculture was at its lowest level because of multiple restrictions 17 .The next stage of reforming the costly agricultural system was the Agenda2000, which was the EU budget for 2000 to 2006, too. Its aim was to increase thecompetitiveness of European agriculture, which carries out mainly through a reduction inguaranteed prices for individual commodities. It created a pressure on farmers to reducecosts.It passed from direct payments to one hectare to the single farm payment since 2009.The sum of existing direct payments to cultivated soil and the individual commoditiesare paid the aggregate amount for agrosubject as a whole.Funds from the banking sector in the form of special loan products had alsomain influence on the liquidity of the entity. Bankers ´attention to provide loans foragricultural sector is directed to the discipline of mutual payments between farmers andtheir suppliers. Supplier payments extend to farmers in the current trade year and worsentheir balance and the balance of the suppliers, too. Banks must consider more liquidity ofsuppliers and customers. It is assessed on the basis of financial statements in particular,cash - flow enterprises. Banks approach to more rigorous monitoring of stockcommodities, the declaration of sales commodities by customer as well as reducingprices in consequence of mainly to sales crisis 18 .In the programming period 2007-2013, agricultural applicants may apply toa greater degree of funding its activities from the EU funds, as well as from publicsources of the Slovak Republic 19 .Situation in the future of Slovak agriculture in terms of union largelypredetermines its present performance and position in the national economy incomparison with the EU Member States and other candidate countries. It is necessary to17 http://www.peterbaco.sk/agrarna-politika-slovenskej-republiky-v-ramci-spolocnej-polnohospodarskejpolitiky-europskej-unie/18GALLOVÁ, Z. 2010. Finančný manažment a dostupnosť agrárnych bankových úverov preagropotravinárske podniky v roku 2009. In: Aktuálne problémy finančného manažmentu v konkurenčnoma krízovom podnikateľskom prostredí agropotravinárskych podnikov. Nitra: SPU, 2009, s.163 – 167, ISBN978-80-552-0312-6,19 http://www.pulib.sk/elpub2/FM/Kotulic13/pdf_doc/07.pdf167
make effort for its development and maintain competitiveness, so the ability to payobligations. Sustainability of business on soil is a prerequisite for rural stability, ruralenterprise and employment of the rural population.Based on the findings facts it can be concluded that the cash ratio of theagricultural industry had a positive trend over years. This development is attributed tothe accession to the EU. It can be agreed that this development is caused by a system ofpayment of subsidies to 31.12, thereby distorting the results. It is expected thatindicators of liquidity would achieve lower value 20 .With first degree of liquidity is related second degree of liquidity andconsequently the third degree. Better values of this liquidity can be achieved either byincreasing the value of the numerator or reducing the value of the denominator and ifthere is achieved optimal state of cash ratio, so it is assumed that the current ratio and thetotal liquidity will be optimal.References1. BALOGHOVÁ, B. – RÁBEK, T. 2006. Bankový úver ako dôležitá zložka cudzíchzdrojov. In: Medzinárodné vedecké dni 2006 „Konkurencieschopnosť v EÚ – výzvapre krajiny V4“. [Zborník na CD ROM]. Nitra: SPU, 2006, 1009-1015 s., ISBN 80-8069-704-3,2. BELICA, M. 2002. Podnikové financie. Nitra: SPU, 2002, 42, 58-69 s., ISBN 80-8069-006-5,3. ENRIGHT, P.2008. The EU´s Common Agricultural Policy rural developmentpillar: ana appraisal. In: Medzinárodné vedecké dni 2008: Konkurencieschopnosťa ekonomický rast: Európske a národné perspektívy. Nitra: SPU, 2008, s. 26, ISBN978-80-552-0061-3,4. FICZOVÁ, I. 2000. Vykazovanie Cash flow. In: Finančný manažér, roč. 1, 2000, č.1, s. 15-19, ISSN 1335-5813,5. GALLOVÁ, Z. 2010. Finančný manažment a dostupnosť agrárnych bankovýchúverov pre agropotravinárske podniky v roku 2009. In: Aktuálne problémyfinančného manažmentu v konkurenčnom a krízovom podnikateľskom prostredíagropotravinárskych podnikov. Nitra: SPU, 2009, s.163 – 167, ISBN 978-80-552-0312-6,6. GALLOVÁ, Z. - KRUTÁKOVÁ P. 2010. Vplyv Spoločnej poľnohospodárskejpolitiky na vývoj likvidity za odvetvie slovenského poľnohospodárstva v rokoch2000-2008, In Zborník príspevkov z evropskej vědeckej konferencie posluchačůdoktorského studia: PEFnet 2010. Brno: Mendelova univerzita, s. 34, ISBN 978-80-7375-450-1,7. GRÜNWALD, R. et al. 1992. Finanční analýzy a plánovaní. Praha: Nad zlato,1992. 110 s., ISBN 80-900383-8-7,20 GALLOVÁ, Z. - KRUTÁKOVÁ P. 2010. Vplyv Spoločnej poľnohospodárskej politiky na vývoj likvidity zaodvetvie slovenského poľnohospodárstva v rokoch 2000-2008, In Zborník príspevkov z evropskej vědeckejkonferencie posluchačů doktorského studia: PEFnet 2010. Brno: Mendelova univerzita, s. 34, ISBN 978-80-7375-450-1,168
8. GRZNÁR, M.. 2008. Efektívnosť slovenského poľnohospodárstva po vstupe doEurópskej únie. In: Ekonomika poľnohospodárstva. Bratislava: Výskumný ústavekonomiky poľnohospodárstva a potravinárstva, 2008. roč. 8, č. 1, s. 13-19, ISSN1335-6186,9. KOŠČO, T. a et al. 2006. Podnikové financie. Nitra: SPU, 2006, 147 s., ISBN 80-8069-725-6,10. KOŠČO, T. - TÓTH, M. 2005. Východiská a pozície poisťovacieho trhu na územíSlovenskej a Rakúskej spolkovej republiky. In Zborník z vedeckého semináras medzinárodnou účasťou (CD) "Faktory podnikovej úspešnosti v podmienkacheurópskeho agrárneho trhu". Nitra : SPU, 2005, 305-311s., ISBN 80-8069-615-2,11. POKRIVČÁK, J. – CIAIAN, P. 2004. Agricultural Reforms In Slovakia. Financea Úver/Czech Journal of Economics and Finance, roč. 54, 2004, č. 9 -10, 420- 435 s.,ISSN 0015-1920,12. SERENČÉŠ, P. 2005. Faktory podnikovej úspešnosti v podmienkach európskehoagrárneho trhu. In: Zborník z vedeckého seminára, Nitra: SPU, 2005, 44-47 s.,ISBN 80-8069-615-2,13. SERENČÉŠ, P. - MAJERNÍK, M. 2009. Investičná činnosť poľnohospodárskychpodnikov a jej financovanie nástrojmi kapitálového trhu, 1.vyd. Nitra: SPU, 95 s.,ISBN 978-80-552-0271,14. SERENČÉŠ, P. et al. 2010. Financie v poľnohospodárstve, 1.vyd. Nitra: SPU, 167--168 s., ISBN 978-80-552-0438-3,15. SZOVICS, P. 2006. Úverová politika v poľnohospodárstve po vstupe SR do EÚ,In: Zborník príspevkov z medzinárodnej vedeckej konferencie – Medzinárodnévedecké dni 2006: Konkurencieschopnosť v EÚ, výzva pre krajiny V4. Nitra: SPU,1169 – 1176 s., ISBN: 80-8069-704-3,16. VEREŠPEJOVÁ, A. 2009. Slovenskí farmári, už vás melie hospodárska kríza. In:Farmár, č. 9, 2009, 8-11 s., ISSN 1337-740X,17. ZALAI, K. et al. 1998.: Finančno-ekonomická analýza podniku. Bratislava:SPRINT, ISBN 80-88848-18-0,18. http://portal.statistics.sk/showdoc.do?docid=33787,19. http://www.peterbaco.sk/agrarna-politika-slovenskej-republiky-v-ramci-spolocnejpolnohospodarskej-politiky-europskej-unie/(Peter Baco),20. http://www.pulib.sk/elpub2/FM/Kotulic13/pdf_doc/07.pdf (Dana Kiseľáková).Contact Addressdoc. Ing. Peter Serenčéš, PhD.Slovak University of Agriculture, Faculty of Economics and Management, Departmentof finance, Tr.A.Hlinku 2, 94976 Nitra, Slovakia, e-mail:peter.serences@fem.uniag.skIng. Zuzana GallováSlovak University of Agriculture, Faculty of Economics and Management, Departmentof finance, Tr.A.Hlinku 2, 94976 Nitra, Slovakia, e-mail: zuzana.gallova@fem.uniag.sk169
5 (54) 2011Dušan ŠimoForeign trade of the Slovak Republicwith selected agrarian commodities of animal originPaper points at research of import and export of beef, pork, poultry, cow's milk,cheese curds and chicken eggs. Agriculture on the market of the Slovak Republic overcomesimbalanced due to extra labor deployment of enterprise-level management and other staff.Agrarian market was significantly affected by the world financial crisis, which wasreflected in our conditions by the growth of gross domestic product, increasedunemployment, reduced consumer purchasing power and declined demand for the keyagri-food commoditiess. Similar imbalances are also in the agrarian markets of theother EU accession countries and third countries. Beside these factors in a significantproportion of the agrarian market volatility can be attributed to the impact of weatherconditions in Europe and the world, mainly due to floods, fires, but also fluctuations inoil and other energy sources. Those and other negative factors affect the results of theagri-business management subjects. Increasing costs of production critical industriesplant and animal production enterprises are the result of low competitiveness ofdomestic producers in comparison with the developed EU agrarian countries.IntroductionLow competitiveness of the agricultural production is partly caused by the lowsupport from the EU funds in the business of primary production in the particular EUaccession countries. Unequal economic environment, land management is the result ofbackwardness in material and technical security, particularly of machinery technology,applications of agrochemicals in plant cultivation, executive genetic potential of plant andanimal species. Lag is also in the use of livestock technologies, post-harvest processing ofprimary products and other factors intensifying primary and manufacturing industries.This paper is to highlight the major current problems of the agricultural foreigntrade of the Slovak Republic in conditions of economic instability for selected agrariancommodities of animal origin.Under review are important commodities of foreign agrarian trade of SlovakRepublic, which have been recorded as a traditional import or export items. Files toqualify for commodities coded Customs Tariff and name are as follows:0201 Beef meat - fresh, chilled or frozen,0203 Pork - fresh, chilled or frozen,0207 Poultry,0401 Milk and cream - unconcentrated,0402 Milk and cream- concentrated,0406 Cheese and quarks0407 Birds' eggs in shell - fresh, preserved and cooked.170
Time series were monitoring the years 2006, 2007, 2008 and 2009 in Slovakia.In obtaining the underlying data were used the secondary sources of domestic andforeign authors and institutions as the Ministry of Agriculture and Rural Development ofthe Slovak Republic, Statistical Office, Research Institute of Agricultural and FoodEconomics in Bratislava, and the database published on the internet and other sources aswell as our own knowledge gained from studying and research.Business environment for farmers in Slovakia is mainly made up of macroeconomicfactors from which will be mentioned the political, economic, technological,natural and others creating a legislative framework for business, but also the possibilityfor implementing the advanced machine systems in the manufacturing process, soil andclimatic conditions for the use on the market place. The current marketing environmentis marked by adding to the global financial crisis and instability in the strategicdevelopment of agriculture in Slovakia. For the systematic development of the keysectors, agriculture provides currently stable plant and animal production, particularly inrelation to the particularities of the green sector. Moreover, EU Common AgriculturalPolicy is for non-standard SR, particularly in relation to the supportive policy of theEuropean funds compared with the original EU countries, which significantly affects theeconomic stability of business in the land. 1Problems of modeling the optimization effective production of pork were discussedby many authors. The situation in the pig breeding in Slovakia is not favorable 2 - thefactors causing this are following: declining numbers of pig, reducing numbers of farmersand increasing import of pigs and pork from the EU countries. The result in pig productionin Slovakia is unprofitable. Optimization model is to quantify the impact of changes incosts, prices farmers, production and reproductive parameters in the pig breeding.Agrarian foreign trade of the SR according to Horska is marked by economicbackwardness of agricultural production in balance with the EU developed agrariancountry. 3 Slovakia's foreign trade in beef breeding according Šimo is under thewidening deficit. Stockfarmers lag in the cost of slaughter, which has an impact on thehigher prices for livestock. Reasonably similar situation exists for pork, poultry meat andegg production 4 .The situation with the slaughter meat according to Vicen and Rovny 5 is notfavorable, after joining the EU, Slovakia has deteriorated in comparison with the inputperiod. Production capacity of the poultry industry increased slightly, but on the otherhand, poultry production has decreased. Under equal to the incidence reduction ofnumber of disease but also other animals for slaughter Slovak farmers is also reflected in1 Šimo, D.- Rovný, P.2010: Agrárny marketing. Nitra:SPU, s.114-1202 Bielik, P. – Horská, E. – Vicen, M. – Dobák, D. 2008: Using optimalization modeling in Marketingmanagement of efficient production of Pork. In: Acta oeconomica et informatica, No 2, vol 11, s. 29-343 Horská, E. 2007: Medzinárodný marketing. Nitra:SPU. 221 s. ISBN 978-80-8069-938-34 Šimo, D. a i. 2010: Agrárny marketing. SPU:Nitra, s.240, s.251, s.268 a s.2725 VICEN, Michal - ROVNÝ, Patrik. 2010. The influence of the EU common market on slaughter poultrymarket in Slovakia. In 11th international conference. International scienticic days 2010. "Global economy:Challenges and perspectives" Nitra may 26.-28.2010. in Nitra : Slovak University of Agriculture, 2010, s.2816-2823. ISBN: 978-80-552-0386-7171
the sales network of food chains and dramatic fall in the sale of meat of domestic origin 6Average supply of pork and poultry was ensured by import from the EU countries. 7Slovakia's foreign trade with agricultural commodities is systematicallymonitored by Gálik 8 . Since 2006 the agricultural share of foreign trade stood at 4.78 %and in 2009 reached slight increase on 5.72% of total foreign trade. The crucial tradingpartners of the Slovak Republic are the coutries of EU.Import of selected commodities by animal origin in the Slovak Republic by yearsis shown in Table 1.Table 1 Import of selected commodities of animal origin in the SR by yearsItem0201 Beef,fresh chilled0203 Porkfresh, chilledInThousands€2006 2007 2008 2009€.kg -1InThousands€€.kg -1InThousands€€.kg -1InThousands€€.kg -1Index change09/06 in %InThousands€15 409 2,75 14 677 3.34 15 939 3.77 14 969 4.67 -2.8 6.98119 060 2,08 116 783 2.12 164 016 2.50 182 929 2.44 53.6 17.30207 Poultry 60 899 1,84 64 788 2.00 74 772 1.95 73 630 1.96 20.9 6.50401 Milk andcreamunconcentrated0402 Milk andcreamconcentrated0406 Cheeseand curd€.kg -139 335 0,51 43 013 0.58 48 398 0.53 32 412 0.44 -17.6 -13.718 448 2,54 39 635 3.82 21 748 2.30 17 187 1.92 -11.6 -24.456 176 3,13 57 245 3.20 69 336 3.01 73 681 2.96 31.2 -5.40407 Eggs 12 008 0,64 10 142 0.60 14 996 0.88 14 598 0.75 21.6 17.2Source: Gálik, J., 2010: Yearbook of the agri-food foreign trade and custom processingAs indicated in Table 1, examined were the following commodities: beef, pork andpoultry meat, cow's milk, cream, cheese curds and chicken eggs. Of follow-upcommodities for the period of increased imports of pork with an index of 53.6, cheesecurds and 31.2 index points, poultry meat 20.9 index points. Lower imports ofcommodities have been reported in cow's milk concentrated and concentrated. From theexamined commodities in the given the period the highest increase in import of porkwith the index of 53.6, cheese and curds with 31.2 index points and poultry meat with20.9 index points. Lower imports of commodities have been reported in the cow's milkunconcentrated and concentrated. In the foreign trade , the significant increase wasnoticed in prices (per kilogram) of beef, pork and eggs, decreased were the prices ofmilk, cheese and curd.6 Rovný, Patrik a i. 2010. Food Chain Management European Experiences and Local Solutions. Graz : MAILBOXES ETC., 2010. 170 s. ISBN: 3-902103-24-87 Šimo, Dušan, Rovný, Patrik. 2010. Agrárny marketing. Nitra:SPU, 2010. 279 s. ISBN 978-80-552-0472-78 Gálik, Jozef. 2009. Ročenka agropotravinárskeho zahraničného obchodu SR za rok 2009. VÚEPP Bratislava.2009. 150 s. ISBN 978-80-8058-552-5172
Export of selected commodities of animal origin in the Slovak Republic byyears is shown in Table 2.Export of selected commodities of animal origin for the examined period was on thedeclining level, as demonstrated by the index change from 2009 in comparison with2006, when the commodity cow's milk and hen eggs. Kilogram prices increased forpork, hens' eggs and beef. For other commodities, prices fell.Table 2 Exports of selected commodities of animal origin in the SR by yearsItem0201 Beef,fresh chilled0203 Porkfresh, chilledInThousands€2006 2007 2008 2009€.kg -1InThousands€€.kg -1InThousands€€.kg -1InThousands€€.kg -1Index change09/06 in %InThousands€15 776 3.35 11 014 3.82 8 688 3.96 7 898 3.76 -49.9 12.625 095 3.34 26 297 3.77 28 138 4.26 18 055 4.77 -24.1 42.80207 Poultry 34 207 0.85 40 890 0.52 43 425 2.44 33 254 0.86 -2.8 1.20401 Milk andcreamunconcentrated0402 Milk andcreamconcentrated0406 Cheeseand curd€.kg -164 346 0.50 73 326 0.56 105 944 0.58 68 101 0.39 5.8 -22.032 369 3.88 57 726 3.93 39 951 2.46 16 078 1.86 -50.3 -52.199 000 4.00 82 222 3.56 95 830 4.15 71 208 3.53 -28.0 -11.70407 Eggs 15 287 1.70 19 901 0.79 22 137 0.50 21 132 2.43 38.2 42.9Source: Gálik, J., 2010: Yearbook of the agri-food foreign trade and custom processingThe agricultural balance of the foreign trade of the selected agrarian commoditiesin the SR is shown in Table 3.Table 3 Balance of the foreign trade of the selected agrarian commodities in the SR(in thousands €)Item 2006 2007 2008 2009Index change09/06 in %0201 Beef, fresh chilled 358 -3 663 -7 341 -7 016 - 1959.00203 Pork fresh, chilled -93 965 -90 486 -135 787 -163 874 -74.40207 Poultry -26 691 -23 898 -31 346 -40 376 -51.30401 Milk and cream unconcentrated 25 012 30 313 57 546 35 689 38.20402 Milk and cream concentrated 13 920 18 092 18 203 -1 109 -7.90406 Cheese and curd 42 823 24 977 26 494 -2 473 -94.20407 Eggs 3 279 9 759 7 140 6 534 99.3Source: Gálik, J., 2010: Yearbook of the agri-food foreign trade and custom processing173
Table 3 shows the significantly increase in the balance of the foreign trade of thefollowing commodities: beef, pork, poultry meat, cheese and cottage cheese. Thepositive balance was achieved in trade with hen eggs and cow's milk.As indicated in Table 4, import of selected commodities, per capita, calculated onthe value and natural indicators showed an upward trend in pig and poultry meat but alsodairy commodities. Rated indicators are influenced by the price of each kilogram ofyears.Table 4 Import of selected commodities of animal origin in the SR by years per capitaItem0201 Beef, freshchilled0203 Pork fresh,chilledImports per capita in €Export per capita in kg2006 2007 2008 2009 ⎯x 2006 2007 2008 2009 ⎯x2.85 2.72 2.95 2.76 2.82 1.04 0.81 0.78 0.59 0.8022.08 21.63 30.34 30.76 16.20 10.62 10.20 12.13 13.84 11.690207 Poultry 11.30 12.00 13.83 13.59 12.68 6.14 6.00 7.09 6.93 6.540401 Milk and creamunconcentrated0402 Milk and creamconcentrated7.29 7.96 8.95 5.98 7.54 14.30 13.73 16.88 13.59 14.623.42 7.34 4.02 3.17 4.48 1.34 1.92 1.75 1.65 1.660406 Cheese and curd 10.42 10.60 12.82 13.60 11.86 3.33 3.31 4.26 4.59 3.870407 Eggs 2.22 1.88 2.77 2.69 2.39 3.48 3.13 3.15 3.59 3.37Source: Gálik, J., 2010: Yearbook of the agri-food foreign trade and custom processingReferences:1. Bielik, Peter- Horská, Elena- Vicen, Michal- Dobák, Dušan. 2008. Usingoptimalization modeling in Marketing management of efficient production of Pork.In: Acta oeconomica et informatica, No 2, ročník 11, ISSN 1335-25712. Gálik, Jozef. 2009. Ročenka agropotravinárskeho zahraničného obchodu SR za rok2009. VÚEPP Bratislava. 2009. 150 s. ISBN 978-80-8058-552-53. Hambálková, Mária. 2008. Zahraničný agrárny obchod, súčasný stav a jehopeprspektívy. In: Internacionalizácia agropotravinárskych podnikov SR. Nitra:SPU,2008. s.105-137. ISBN 978-80-552-0130-84. Horská, Elena. 2007. Medzinárodný marketing. Nitra:SPU. 221 s. ISBN 978-80-8069-938-35. Nagyová, Ľudmila - Drndzíková, Zuzana. 2008. Výrobné a marketingové prístupyk vertikále hydiny a hydinových výrobkov. Nitra : Slovenská poľnohospodárskauniverzita, 2008, . 144 s. ISBN: 978-80-552-0156-66. Rovný, Patrik a i. 2010. Food Chain Management European Experiences and LocalSolutions. Graz : MAIL BOXES ETC., 2010. 170 s. ISBN: 3-902103-24-87. Šimo, Dušan, Rovný, Patrik. 2010. Agrárny marketing. Nitra:SPU, 2010. 279 s.ISBN 978-80-552-0472-78. Vicen, Michal- Rovný, Patrik. 2010. The influence of the EU common market onslaughter poultry market in Slovakia. In 11th international conference. International174
scienticic days 2010. "Global economy: Challenges and perspectives" Nitra may26.-28.2010. in Nitra : Slovak University of Agriculture, 2010, s. 2816-2823. ISBN:978-80-552-0386-7SummaryResearch focused on import and export of beef, pork, poultry meat, cow's milk,cheese curds and chicken eggs. In the years 2006-2009, the negative balance of foreigntrade has increased in the monitored commodities of cow's milk and hen eggs. Thismarket development is also recorded in a total amount reached in the agrarian business,which was 950 million € in 2009. The share of foreign agrarian trade in total foreigntrade was 5.72% in 2009. The results of the agricultural foreign trade during thereporting period are influenced by a range of subjective and objective factors of macroand micro-agricultural market.Contact Address:prof. Ing. Dušan Šimo, CSc.,Slovak University of Agriculture in Nitra,Faculty of Economics and Management,Department of marketing,Tr. A.Hlinku 2,949 76 Nitra, Slovakiae-mail: Dusan.Simo@uniag.sk175
5 (54) 2011Dariusz StrzębickiSelling of agricultural products via the InternetSprzedaż produktów rolnych przez InternetW opracowaniu zaprezentowano przykłady wykorzystania Internetu w sprzedażyproduktów rolnych. Na podstawie analizy polskich i zagranicznych przypadków autor omówiłróżne formy elektronicznej sprzedaży produktów rolnych zarówno typu B2C, jak i B2B.W opracowaniu omówiono sposoby funkcjonowania oraz korzyści z wykorzystania różnych rynkówelektronicznych i sklepów internetowych produktów rolnych dla rolników oraz nabywców.IntroductionDevelopment of the Internet caused that more and more enterprises use it in theirbusiness activities. Besides communication and promotional uses, the Internet is growingin popularity as a channel for selling products. Agricultural producers are also trying todevelop this marketing channel in spite of many barriers of selling agricultural productsvia the Internet. Farmers may use the Internet to sell agricultural products for consumersand also for organizations.The main objective of this paper is to identify different forms of sellingagricultural products on the Internet. The author also describes operation of electronicagricultural marketplaces and benefits of the Internet selling. The methods used to writethis paper were observations of websites and case studies of the chosen electronic storesand marketplaces. In the paper the Polish and foreign cases are included.The paper consists of two main parts that are devoted to the two basic types ofelectronic commerce that are B2C and B2B transactions. Because of the different natureof the two types of transactions, the B2C and B2B cases of selling agricultural productsare described separately in the paper.Internet as a medium and a marketplaceIntroduction of the new Internet service World Wide Web caused a dynamicdevelopment of the medium. WWW documents have been easy to create and enabledmany features that were recognized by scientists as distinguishing the new media fromthe old, traditional media such as television, radio and newspapers. The most importantfeature of the new media is interactivity. It is the most exeptional feature of the Internetbecause it allows the dialog between Internet users and the dialog between users and themedium. The other features that are offered by the WWW, html based documents are:176
• multimedia – the feature that allows to combine different media forms such astext, static picture, film;• capacity – the feature that allows to publish on the Web unlimited information onproducts and firms,• hypertext – that allows easy and logic movement among the Web sites;• global reach – that allows firms to present their offers in spite of the distance ofmarkets.All the features mentioned above determine specificity of the medium and we canalso think about the medium as a market 1 . The Internet allows to operate many forms ofmarkets in the virtual space. Internet storefront, electronic malls, electronic exchangesare example forms of virtual marketspaces. Internet allows migration of traditionalmarkets to the virtual marketspace and support transactions between buyers and sellerselectronically.B2C electronic commerce refers to the transactions between an enterprise anda consumer. B2B electronic commerce refers to the transactions between enterprises.Using Internet by farmers in B2C transactionsFarmers can use Internet on many possible ways to sell their products. They canpromote their products creating and promoting Website, place a form on their Websitefor collecting orders from buyers, post their offers on the electronic catalogues, take partin electronic exchanges, using the electronic system of their customers.Using Internet as a way of selling agricultural products is changing marketingchannels in the agribusiness industry. Internet can serve farmers as an alternativemarketing channel. Farmers who establish a website by which they sell agriculturalproducts, thus use quite a different marketing channel. It helps many farmers to findnew customers, to cross geographic market limitations and to find new markets. Figure 1presents a Website of a farmer that sells honey by its Website.Honey producer using his Website as a marketing channel is able to avoiddistributors such as wholesalers and retailers and to sell directly to the customers. Thiskind of website can serve as B2C and at the same time B2B electronic commerceenabler. The farm honey producer can sell the offered products directly for theconsumers through B2C transactions, but also to the retailers, wholesalers and otherorganizations that represent B2B electronic commerce. The B2C model of sellingagricultural products run into some difficulties connected with the specificity ofagricultural product and agricultural production, that comes from such features as:• most of agricultural products are perishable, not durable, and difficult to store;1 Hoffman D., Novak T.: Marketing in Hypermedia Computer-Mediated Environment. ConceptualFoundations. Journal of Marketing. (1996), Vol. 60, pp. 52177
• monetary value of agricultural products is relatively low comparing their cubicvolume, and this causes problems with transport and storage;• seasonal production causes that some fresh agricultural products like fruits areavailable only seasonally on the market;• consumers usually buy food products in small quantities;• consumers most often buy different food product (processed and not processedagricultural products) in a single transaction.Figure 1. Website of the honey producerSource: http://www.miody.netThe next very important issue in the context of selling agricultural products byfarmers online is the fact that food products don’t belong to the group of popular Internetbuying products. Convenience goods are less frequently purchased by the Internet thanshopping goods. The Polish food market is estimated to be worth about 200 billion zloty,and only about 5% of the value is generated by the Internet selling 2 . It is relatively low2 Internetowa sprzedaż artykułów spożywczych przekroczy w tym roku w Polsce wartość 300 mln zł, 2010,http://www.portalspozywczy.pl/handel/wiadomosci/internetowa-sprzedaz-artykulow-spozywczychprzekroczy-w-tym-roku-w-polsce-wartosc-300-mln-zl,27481.html178
comparing with the country like Great Britan where Internet selling of food products isworth 9,5 billion GBP 3 .Internet grocery customers repeat their purchases week after week with tightrelationship with the grocer. Therefore user interaction on the websites that sell food ismuch more substantial comparing with others B2C sites. Shopping for food on theInternet is much more sophisticated than most shopping transactions. Average e-grocerypurchase order is several different items comparing to one or two items in the other B2Corders 4 .In the food Internet shopping also very important is that the ordered items aredelivered very quickly to the customers 5 .In spite of the barriers and difficulties, online direct B2C sale of agriculturalproducts is growing. The above mentioned example of honey producer refers to theagricultural products that are quite easy to store because honey is relatively lessperishable product comparing with fruit and vegetable. From the producers perspective itis more difficult to sell online such seasonal and perishable products like fruit in B2Conline transactions. But even fruit producers try to avoid distributors and sell theirproducts online.A very interesting is the case of the online citrus products shop called FreshCitrus Direct (www.freshcitrusdirect.com.au) established in Australia by Pyap farmerMichael Arnold. Figure 2 presents the website of the citrus electronic store.As the farmer says, the traditional marketing channel consists of many different stepsalong the way from packers to supermarkets, and all the channel participants get theirshare. Using traditional marketing channels, after the fruit is picked from the field, it isgraded, freighted, distributed, and all the processes last at least a week. Using the onlineroute consumers get much fresher products two or three days after picking from trees.Selling citrus fruit by traditional distribution channels makes 50c a kilogram, but sellingonline rises to about $3,5 a kilo 6 .Customers can order fruit in different ways such as: secure online purchasingwith card payment, direct deposit, phone, or by fax and mail.3 Rośnie sprzedaż produktów spożywczych przez Internet, 2011,http://www.portalspozywczy.pl/handel/wiadomosci/rosnie-sprzedaz-produktow-spozywczych-przezinternet,44720.html4 Keh H. Shieh E.: Online Grocery Retailing: Success Factors and Potential Pitfalls. Business Horizons Vol.44, No.4, July 2001,pp. 735 Warkentin M., Bajaj A.: The On-Demand Delivery Services Model for E-Commerce, in Gangopadhyay,Managing Business with Electronic Commerce: Issues and Trends. Hershey, PA: Idea Group Publishing, 2002Idea Group Publishing, 2002, pp. 131-150.6 AdelaideNow, 2010, Riverland farmers are fighting back against supermarkets cutting into their profits byselling fruit directly to customers online, http://www.adelaidenow.com.au/news/south-australia179
Figure 2. The website of the citrus producer from AustraliaSource: http://www.freshcitrusdirect.com.auCitrus are delivered by Australia Post. Fruit is picked straight from the tree andplaced into styrofoam boxes. The boxes are ready for many other uses and can berecycled.The online shop operates seasonally. For example Internet users that visited thewebsite on 23.03.2011 could read on the website following message “Season 2010 isnow finished, we will start up again around late May/June in 2011 when early varietiesbecome ripe”. The farm sells online only the fruit from its field and because ofseasonality, breaks in sale are unavoidable. In spite of it the farm is realizing theirInternet marketing, especially promotion activities all year long.The online selling activities are strongly supported by Internet promotion. On theselling website the farmer and his family presented their belief that citrus fruit is anexceptional food source because it is not only great testing but also highly nutritiousfood product. The farmer also explains on his website the factors that influence citrusfruit taste and points that a very important factor is to pick fruit when it is perfectly ripe.Moreover, a very important factor is freshness that has also its impact on great fruittesting. The freshness can be achieved by minimizing the time taken between pickingand eating fruit. The main goal of the electronic storefront is to bring consumers greattesting fruit by picking it when the citrus is naturally ripe, then packing it and deliveringdirectly to consumers in the shortest possible time. Selling online fruit from his field thefarmer cuts out the middleman and ensures that consumers get a very high quality of his180
products that is probably not possible to achieve using traditional, long marketingchannels. On the shop’s website there is also information connected with the productionof fruit on the farm. Consumers get known, that on the farm highly efficient irrigationmethods are used to water trees. Soil water levels are monitored electronically. The farmuses an Integrated Pest Management (IPM) program that allows better pest control andminimizes pesticide use. The farm also complies with industry food safety benchmarksby using the HACCP quality assurance system.The electronic fruit store is also supported by the social media marketing. Figure3 presents Facebook group of the citrus producer.Figure 3. The Facebook group created by the citrus fruit producerSource: http://www.facebook.comSocial media allow people to communicate and to share information aboutthemselves. The popularity of social media caused that social media marketing isgrowing in importance. The most famous social media portal is Facebook. The portalcan be used by every firm, from every industry. Personal profiles, business fan pages andgroups are created by large firms as well as small and medium enterprises. By creatingits fan page on a Facebook even a small firm can build its brand, create communities,find new customers and maintain long lasting relations with them. Using social mediafirms can promote events, conduct promotional contests. By social media firms canpersonalize brands, can talk directly to their customers and listen to them. Firms can usesocial media in quite different marketing purposes: to increase sale, to improve customer181
service, to reduce promotional costs, to build interest of journalists, bloggers andanalysts 7 .Very often, it is too expensive for farmers and very time consuming to maintainthe website and perform all the marketing activities connected with good electronicstorefront operation. That is why they decide to use electronic intermediaries that enablethem to focus only on their production efforts and not to bother about all the Internetmarketing activities. In this situation farmers only are to pay commissions (usuallypercentage of their sale value).This is the case of Home Grown Cow (www.homegrowncow.com), agriculturalshopping mall where consumers can buy various kind of meat. Figure 4 presents thewebsite of the Home Grown Cow.Figure 4. The website of Home Grown CowSource: http://www.homegrowncow.comThe electronic market provides farmers a full service electronic commerce saleschannel. The electronic mall was founded in September of 2010 but the mall isdeveloping very fast. This electronic market gives farmers who are interested in directmarketing of their products, an opportunity to sell online. Before emerging of theelectronic mall many farmers were not able to sell their products directly to consumers7 Treadaway Ch., Smith M.: Godzina Dziennie z Facebook Marketingiem. Helion Press 2010, pp. 86182
ecause their farms are very distant from metropolitan areas, where demand for localfoods is much greater comparing with rural areas. The electronic market enables farmersto post their offers with description of their operation and their products. Farmers settheir own price that is price for direct purchase of consumers. The other services offeredby the mall to farmers are credit card processing, order conveyance and shippingfacilitation. Both consumers and farmers are protected by payment safety net that keepsconsumer billing information safe and also protects farmers by ensuring customercommitment. Farmers pay for Home Grown Cow commission when they make a saleand the commission is fifteen percent of sale value. The electronic market’s task is tofind customers, taking and processing orders, collecting payments, arranging forshopping and delivery.The goal of Farm Grown Cow is to create national network of farm-direct meatand poultry producers. The electronic market accepts any kind of meat. It can be beef,chicken, pork, lamb, bison, turkey, emu. The electronic platform also accepts any kind offarming practice. Therefore it can be organic production, free-range method, grass-fedand also conventional production method.The process of the electronic market usage by farmers consists of such steps as:signing up and creation of farm profile, loading inventories to the profile withavailability dates (this could be bulk meat as well as cuts), the electronic mall conductsmarketing activities in the purpose to attract traffic to the mall and to find consumers forthe offered products, consumers place orders and give their credit card information, incase the order is accepted by the farmer, Home Grown Cow charges the credit card ofa consumer and notifies the consumer about his order that it is already placed. Theconsumer receives the ordered product. Once the customer has received his order theelectronic mall pays the farmer. The electronic meat market is of great benefit to thecustomers because they know where the ordered meat is coming from, they have thepossibility to specify their order according to many criteria (location, farm practices,farm size, meat type, form of cuts or bulk, delivery method), they are also assured thattheir billing information is safe and is not shared outside of the electronic mall.For the electronic market to be successful it is very important that farmerspublishing their offers take a great care when identifying and describing their productionmethods and other farming practices. It is very important that they do it accurately forthe good image and success of the electronic marketplace.The electronic system offers farmers easy product descriptions by using graphicsymbols of production practices. The practices are as follows:• USDA Certified Organic – means that the food was not grown using syntheticfertilizers, chemicals, sewage sludge, is not genetically modified, not irradiated.Moreover organic meat is fed using only organically grown feed and the feed iswithout any animal byproducts. The meat is not treated with antibiotics,hormones. The animals have access to the outdoors.183
• USDA Never Ever Three – means that animals are not exposed to animalbyproducts, growth hormones and antibiotics.• Pasture Raised – means that animals are not confined to any facility and haveconstant access to pasture.• Grass (Forage) Fed – means that grass and forage is the feed consumed byanimals. The exception is milk that is consumed prior to weaning. The foragethat is used in the production process consists of annual and perennial grass,forbs, browse, or cereal in the pre-grain state. Animals have continuous accessto pasture in the season period and are not fed with grain and grain byproducts.As a feed sources also can be included crop residue (without grain), silage,baleage and hay.• Free Range – means that poultry have access to the outside. This applies topoultry only.• Non-Hormone Treated – means that no hormones were used in the animalproduction.• No Antibiotics Added – means that antibiotics were not used to the animal duringits lifetime. Animals that are ill are taken out of the herd and are treated but arenot sold using this label).• No Animal ByProducts – means that no mammalian and avian byproducts wereused in the production process to feed animals. Only fish byproducts, mineraland vitamin supplementation can be used.• Humane Animal Treatment – means that the farm was certified by Humane FarmAnimal Care Organization and by Animal Welfare Approved program that isa guarantee of human production practices in the animal production.• Halal – means that products have been handled under Islamic authority and withaccordance with the Islamic law.• Kosher – means that food is prepared according to rules and regulations of theJewish Dietary Laws.• Third Party Verified – means that farm practices were verified by USDA.The products bought by customers at Home Grown Cow can be delivered right totheir doors or customers can collects their purchases directly visiting the farms. Farmerscan also choose graphical symbols representing size of farm (small, medium, big), anddelivery option (local delivery, local pickup, shipment by carrier service).Prices that are listed at the electronic mall are chosen by farmers and are retailprices because the offer of the market is targeted towards consumers. The prices offeredat the electronic market in many cases are self explanatory but sometimes they can varydepending on the quantity bought. Customers buying larger bulk should consider someimportant issues such as live weight of the product, hanging weight, dressed weight.When customers decide to purchase bulk meat they are not certain the exact pricebecause the animal from which the meat come may still be living and growing.Therefore farmers to price this product will base the price on such factors like cost ofanimal production, margins that they achieve, processing fee (because small farmersmost often uses processing firms to prepare meat to sell it online) and farmers will184
estimate of what will be the weight of each quarter or side of meat. But these customeruncertainties are not significant so for customers that are accustomed to buying in bulk itis not a barrier to buy the products.All products sold at Home Grown Cow are processed in the meat processingestablishments that are licensed by government either at the state or federal level. In thetable 1, there are listed benefits from using the electronic B2C meat market both forfarmers and consumers.Table 1. Benefits of using Home Grown Cow electronic market for farmers and for customersBenefits for customersBenefits for farmers• Knowing the origin of the bought food• Better access to new customers• Possibility to select preferred farming • Increased revenue by new customer base andmethodmarketing activities realized by the• Ability to buy from the vast, nationwidenetwork of US meat producers• Ability to buy bulk quantities• Ability to buy specialty meat• Many possible ways of acquiring purchase• Confident system of electronic paying forthe bought productselectronic market (with a continuousonline exposure to many millions ofpotential customers nationwide)• Possibility to choose prices for the offeredproducts• Marketing support and help in posting andpricing products• Farmers do not have to pay for the electronicmarket services if they do not sell theirproducts• Better inventory planning• Support for sustaining of small farms in theeconomy that is dominated by large farmsSource: Based on information provided by Home Grown Cow on its website: www.homegrowncow.comWhat is also very interesting is that the electronic mall provides its services evenfor farmers who do not have access to the Internet 8 .A very good example how local farmers join their forces to sell their productonline is an online farmers’ market created by farmers in Northeast Georgia in UnitedStates 9 . The market is called Locally Grown (www.northeasgeoria.locallygrown.net).Figure 5 presents the website of the farmer’s market.The electronic B2C market of food products Locally Grown is the Internet basedmarket that creates very unique way to provide fresh food and make it more accessible tothe local citizens. The main goal of the initiative is to encourage producers to makeliving from farming and food production. Consumers can buy on this electronic mall,such products as: dairy, meats, eggs, milled products, vegetables, herbs, flowers.Products that are sold on this market are produced using sustainable productionpractices. Growers that provide products on this market are committed to chemical freefarming. They also follow strict standards to ensure that the offered products are of high8 Aikman K., 2011, Home Grown Cow provides farmers with E-Commerce opportunities,http://www.mikeroweworks.com/2011/029 Stone J.: Local farmers sell products online, 2010, http://www.theclaytontribune.com/articles185
quality. The products offered on the Locally Grown e-marketplace are produced right onthe local areas in Rabun, Habersham and adjacent counties. The online marketplace isnot a cooperative, though farmers taking part in the e-market use cooperative efforts toincrease the availability of local food products to the local consumers. Promoting theonline marketplace farmers inform local citizens that the electronic farmers’ marketprovides many benefits to the local community. It builds local economy because smallfarms increase economy with relatively low capital costs. Anybody who grow plants andproduce food without the use of chemicals could become a vendor of products to theelectronic market. Buying food products on this Internet market also contributes toreduction of the environmental impact of producing food products. It is also connectedwith reduction of chemical, fuel and packaging materials usage. Moreover, betterunderstanding of origins of the offered food may influence many positive behaviors ofconsumers.Figure 5. The website of electronic agricultural farmer’s market Locally GrownSource: www.northeasgeoria.locallygrown.netThe online marketplace allows farmers to describe their products and to postphotos of their products and they can also include receipes connected with preparingunusual items.Customers buying on this e-market don’t give credit card information because theelectronic marketplace only accept cash at the time when customers pick-up boughtproducts from the appointed pick-up points. Pick up hours are very convenient to186
customers unlike the traditional farmers’ market, where customers have to be present onthe marketplace at very early hours.The process of ordering products by customers is very simple and customerschoose the product item, amounts of product, and producer. They can determine fromwhat farm should be the chosen products. The ordering system is similar to the usualshopping cart that can be found on many selling websites.For the electronic marketplace to operate, some financial sources are needed. Thebasic source of the electronic market financing are commissions paid by farmers that areseven percent of farmer profit. This commissions goes to the electronic market to financewebsite operation, petrol to make the deliveries and the other needed supplies.There are many cases in the world when farmers go online to sell their products.In China the development of Internet infrastructure allows many small farms to sell theirproducts online without the need to go for the local farmers’ market 10 .In Vietnam turnover from online sale has surprised many farmers. The farmerspreviously could only take their good to the local markets. On many websitesVietnamese farmers are offering agricultural products. Internet farmers’ markets proveto be very bustling these days. Vietnamese farmers offer on these websites suchproducts as chicken, rice, carp, etc 11 .B2B electronic sale of agricultural commoditiesElectronic commerce B2B transactions can be conducted over the Internet,intranet, extranets or private networks 12 .Such transaction take place between businessesand any other organizations.The basic B2B transaction types are:• sell-side transactions that occur when one seller sale products to many buyers;• buy-side transactions that occur when one single buyer buys products from manysellers;• exchanges is the model occurring between many sellers and many buyers;• collaborative commerce represented by all activities other than buying and sellingamong organizations such as collaborating, sharing of information,communicating etc.10 Chinese farmers go online to sell products, AFP, March, 2011, http://au.news.yahoo.com11 Vietnamese farmers now sell online (2010), http://english.vietnamnet.vn12 Mahadaven B.:, Making Sense of the Emerging Market Structure in B2B E-Commerce, CaliforniaManagement Review, 2003, pp. 3, http://www.iimb.ernet.in/~mahadev/cmrb2b.pdf187
Many of these electronic commerce B2B transactions are conducted without thehelp of any traditional intermediaries. But the electronic B2B transactions are veryoften enabled by the new type of intermediary that is electronic intermediary. Theelectronic intermediary is very often a third party that is creating an public electronicmarketplace. In the chapter the author focuses on the electronic public marketplaces(electronic exchanges) usage in agriculture. The electronic marketplace can be horizontaland vertical. The agricultural commodity electronic marketplaces are of the vertical typebecause they are operating particularly in the agribusiness sector. The electronicmarketplaces can by used by market participants in the purpose of long-term buying orshort, spot buying. Electronic exchanges are electronic meeting places for many buyersand many sellers, but besides the basic many-to-many model of electronic B2Btransactions they also offer many-to-one and one-to-many models of transaction and canbe very often used as enablers of supply chain processes. The electronic exchanges veryoften offer to the market participants, the mechanism of dynamic pricing that refers tothe rapid movement of price over time. Price in the settling process model are changingby the seconds. In the process of dynamic pricing a company posts a bid to buy products.Then electronic forward or reverse auction is activated. Buyers and sellers can observethe bids in the real time and can interact with the bids. At the end of the process a deal isstruck when the exact mach on price is achieved between buyer and seller.Electronic marketplaces can generate their income in many ways. Very oftenelectronic market participants pay transaction fees that is usually the percentage of thetransaction value. Fees can be also charged from market participants for using specialservices of the electronic market. Some of electronic exchanges also generate income bymembership fees and advertisements placed on the electronic marketplace website.The agriculture and agribusiness specificity can impact the development ofelectronic marketplaces in many ways. For example the Polish market of agriculturalcommodities is characterized by many agricultural producers. The agriculturalproducers meet on the market very strong bargaining power of their customers that areconsolidated food industry processors, distributors and other organizations that buyagricultural commodities in large quantities. Very often growers do not have anyalternative channels to sell their products and they sell only to the local buyers. That iswhy the situation is very similar to the monopsony conditions 13 . Electronic marketplacesseem to possess many features and electronic tools that promise to change this notfavorable situation for farmers. Using electronic commerce B2B platforms they can findbuyers in an easy and fast way and can get much higher price comparing to the priceachieved by the negotiation with the local buyers. The Polish agricultural commoditiesmarket is very dispersed, especially at the sell side of the market. Such dispersed andfragmented agricultural markets seem to be very well fitted to the development of publicelectronic marketplaces created by the third side electronic intermediaries 14 .13 Karasiewicz G.: Systemy dystrybucji artykułów rolno-spożywczych na rynku polskim, Wydawnictwa<strong>Nauk</strong>owe Wydziału Zarządzania UW, Warszawa, 200114 Nicolaisen R.: How will agricultural e-markets evolve. Proceedings of the USDA Outlook Forum,Washington, DC, 2001, pp.20188
Electronic marketplaces can be also of great benefit for buyers of agriculturalcommodities because it broadens their market base and market reach (among many otherbenefits).Electronic marketplaces can differ in the scope of market functions realizationbecause of different market agricultural market structures in every country. Thehypothetical services that may be offered by electronic exchanges are for example:searching and browsing buy and sell offers, automatic matching buyers offers with thoseof sellers, providing and analyzing important market information for the electronicmarket users, sometimes financial and logistic transaction support is provided. Theelectronic marketplaces also provide efficient ways of communication among electronicmarket participants, vertical integration of information systems between organizations,support for efficient cooperating in the supply chain etc.In Poland the most developed and complex electronic exchange of agriculturalcommodities is IGT electronic platform (www.ewgt.pl). Figure 6 presents the IGTwebsite.Figure 6. The website of IGT electronic platformSource: http://www.ewgt.com.plThe electronic market B2B market started its operation in 2001 year. IGT enablesfarmers and enterprises to sell and buy commodities that are standardized. On theelectronic market predominate transactions of meat and cereal. Besides agricultural189
commodities the market also offers fuels, steel and other raw materials and resources.The electronic system of the market generates in the real time price information ofproducts sold on this market. The generated price data are published on the electronicexchange website.There are two ways of price determination on the electronic exchange. The firstmethod of establishing price is auction and the second is catalogue price in the table ofoffers. Farmers or food industry enterprises can take part in the electronic exchangeprovided that they registered at the electronic market’s website.The electronic marketplace consists of two main parts that is table of offers andauction system. To use fully table of offers one must register at the website. For notregistered users, only searching for offers option is available. Table of offers is anInternet platform enabling market participants to publish their sell and buy offers. Theoffer published in the electronic system is treated as an offer with interpretation of thecivil code. The electronic table system provides a very safe mechanism of performingtransactions. The mechanism consists in down payment that has to be paid in by buyersat the electronic market’s bank account. Only when the transfer has taken placeelectronic market informs the seller about the event and the seller can give the boughtcommodities to the buyer. After the delivery the money are transferred from e-WGTbank account to the seller’s bank account. Searching for offers is possible using manycriteria. Offers can be searched by: recently added offers, type of commodity, region,price, name of supplier. Preparing the offers market participants (sellers or buyers)should decide if they want to use safe transaction mechanism by marking a proper optionin the electronic system. In a form, market participants should announce informationconcerning commodity, type of offer, terms of delivery. After filling the form also thenext form referring to the particular commodity should be filled out.Table of offers enables users to negotiate prices. The negotiation process can berealized using text communicator that is a part of the electronic system. The electronicmarket participants can also communicate with each other using e-mail. To realizetransaction the publisher of the offer has to accept offered price and other transactionterms proposed by the opposite side. The completion of a transaction is interpreted asentering into an agreement.The second part of the electronic market is an auction system. The auction systemcan be used by certified brokers exclusively. To take part in the electronic auction,brokers should possess deposit registered by the electronic marketplace. Brokers cansearch offers using many possible criteria. Brokers can also manage their own offers byadding new offers, acceptance of offers proposed by their clients, withdrawing offers,attaching extended descriptions to the offers, copping offers. They have possibility tobrowse and watch current trading sessions as well as results of past trading sessions. Thesystem allows them to create offers and making bids in the auction.190The main benefits of the electronic marketplace for the Polish farmers are:• better prices for the offered products,
• dynamic and competitive mechanisms of price discovery,• new, alternative distribution channels,• possibility to avoid intermediaries.A similar electronic marketplace is created in India. The National Spot Exchange(NSEL) is an electronic commodity spot market. The website of the NSEL electronicmarketplace is presented as figure 7.Figure 7. The website of the electronic public marketplace NSEL in IndiaSource: http://www.nationalspotexchange.com/It provides a very transparent and centralized electronic platform for tradingcommodities. Market participants can access the market remotely. It facilitates risk freetransactions of commodities that are specified of quantity and quality. The group ofelectronic market users include farmers, trades, processors, exporters, importers and theretail market participants. Besides electronic market transactions the electronicmarketplace also offers many other services such as warehousing, quality certification,financing of warehouse receipt, etc. The National Spot Exchange has obtained tradelicenses from state government to facilitate online exchanges and delivery of variousagricultural commodities. The electronic exchange operates since 2008 year andprovides electronic trading platform helping the sellers to sell agricultural productsdirectly to end buyers. The NSEL electronic marketplace has more than 500 registeredmembers that have access to over 3000 trader work station. The electronic exchange hasa market share of over 98% of the country electronic commodity spot market. Theelectronic market has changed the Indian trading of agricultural commodities in manyways:191
• thanks to the electronic marketplace farmers in India for the first time havestarted to take part in electronic exchanges;• they have begun to sell seed without help of any traditional intermediary;• the warehouse receipt allowed agricultural producers to get credits at lowerinterest rates and significantly enhanced their holding power;• the electronic market also introduced auction method of transaction to the Indiantrade of agricultural commodities;• the electronic exchange introduced the procurement services to improve bulkbuyers and to increase efficiency of supply chains of agricultural products inIndia;• NSEL made it easier for agricultural producers to get credits by providing creditfacilities at the electronic marketplace.The main goal of NSEL electronic marketplace is to bring a large number ofmarket participants on at the one, single electronic point for efficient spot pricediscovery and make sure that the commodities traded at the electronic exchange aredelivered on time without any risk of the buyers and sellers.All commodities at the market are traded in contracts using the electronic tradingplatform. Contracts are of single day duration and only the settlement cycle is differentdepending on the type of commodity and realized market practices. One singlecommodity can have multiple contracts with different market location, size of the singlecontract, and settlement cycle.The electronic system of the National Exchange supports two basic types ofmarkets that are spot market and auction market.The prevailing type of spot market trading are single day trading contracts. Thecontracts are opened every day as a result of the traded contracts there is a compulsorydelivery of the traded commodities. The model of spot market transactions is many-tomany.Each of the traded contracts have assigned particular delivery locations where thetraded at the electronic commerce platform commodities can be delivered. The veryimportant feature of this market is that the electronic marketplace is taking part in theproduct certification. Every seller that wants to sell their agricultural commodities at theelectronic market is required to bring the commodity to the warehouse belonging to theelectronic exchange. In the warehouse the commodity is weighted and qualitycertification is realized. The process of certification is done by quality certifying agents.Only the commodity that is the same to the contract specification of the electronicexchange can be allowed for trading on the market.Auction electronic market is performed for selling specific brand of commodity.Auction market is performed for few hours during the day. The model of the electronicauction is one-to-many. The trading mechanism can be divided into two basic forms ofauction that are forward auction and reverse auction. In the model of forward auctiona single seller is selling his products to many buyers. In the reverse auction, a singlebuyer is buying products from many suppliers. The mechanism of forward auction192
allows registered sellers to post their requirements on the electronic platform forbids.The sellers submit sale quantity and the floor price in the electronic platform. Thebuyers taking part in an auction submit their buy bids along with the quantity. Buyersand sellers during the auction can reduce or increase proposed prices and quantities butnot during last five minutes of the electronic auction. At the end of the session, theelectronic platform system automatically match sale orders with buy orders at the highestprice of the submitted buy orders, provided that the buy order price is higher than theprice submitted by a seller. The process is quite different in the case of the reverseauction system. In the mechanism, the registered buyers post their requirements on theelectronic platform for bids. The electronic system allows a large number of buyers tosubmit their bids. The stronger the competition between the bidding sellers, the lower thevalue of the proposed bids. The seller whose bid meets the buyer’s best valuerequirements would sale his products. The electronic reverse auction is allowing marketparticipants to take part in the dynamic way of settling price. The real time competitionof sellers is resulting in significant cost reduction and improves process efficiency ofagricultural raw material procurement in enterprises.The electronic exchange NSEL also offers to its participants a customizedprocurement services. The procurement services are created in the way that meet thesophisticated, individual purchase requirements of processors, manufacturers,government agencies, private companies, exporters. private brokers and other institutionsand organizations that want to improve their procurement processes. For electronicprocurement processes support, the electronic marketplace charges 2% fees from thebuyers. The very important feature of the procurement electronic system is that it enablesbuyers to source the products directly from the farmers using the electronic system ofNSEL. Therefore the systems enables buyers to integrate vertically their processes withfarmers. The significant benefits from the electronic procurement system offered by theelectronic marketplace are:• allowing producers, exporters, government agencies, backward integration withfarmers, without any need for additional investments in electronic commerceinformation systems;• organizations in India have the ability to reduce costs of sourcing raw materials;• the electronic exchange offers customized electronic procurement collateralsolutions,• efficient desktop monitoring of entire procurement process;• guarantee for quantity, quality and payment in the procurement of raw materials.The electronic exchange enables market participants to conduct safe and securetransactions of selling commodity to buyers based anywhere in India. The Exchange alsoprovides an electronic mechanism for realization of timely payment. The electronicmarket also undertakes promotional activities to build awareness of buyers. ThereforeNSEL enables sellers to expand their market reach and to increase their sales.What improves operation of the electronic marketplace is the net of warehousefacilities that are placed at important market locations in India and are accredited193
delivery points. The warehouses are hired and managed by NSEL and are approved byfinancial institution for warehouse receipt funding. All the warehouses and facilities arelocated in convenient places connected with high level of roads, transportation and withaccess to labor. Storing in the warehouses gives farmers the ability of qualitycertification, grading, transportation facilities and insurance of stocks.The National Spot Exchange has many features that may be of great advantageboth for sellers and buyers:• The electronic marketplace offers very efficient price discovery at the nationallevel• It allows better price realization for market participants• The electronic market is increasing bargaining power of farmers• Better price information and market analysis reports for the whole country market• Warehouse receipt allows farmers for bank loans and credits• Integration of the fragmented agricultural market in India using electronicsolutions• Reduction of the number of intermediaries on the agricultural market in India• Electronic marketplace provides quality certification, standardization and gradingof commodities• Safe trade and payment system provided for the market participants by electronicmeans.ConclusionsThe described above cases of the Internet selling of agricultural products showthat there are significant differences in the selling of agricultural products on theInternet. Every presented case is quite different in many features. The first and thesecond case refer to the situation when farmers sell their products via their own websites.In the first case the farmer sales relatively not perishable product that is honey. Thesecond case is referring to the selling of citrus fruit. However citrus is relatively lessperishable comparing to such fruit like strawberry or raspberry. The two internet sellingcases show that farmers are able conduct direct marketing for their products using theirown websites. Despite relatively high cost of postal dispatch, customers buy the productson the Internet because, from the customers viewpoint, the value offered by farmers ishigher than value of products bought at the traditional retail groceries. Farmers are ableto generate profits despite costs connected with maintaining and promoting the storewebsite. It is possible because they avoid intermediaries that usually have high marginsthat decrease farmers, profits. Moreover, a great advantage is that the farmers learn thenew channel of selling products and get experience. This can bear fruit in the futurewhen buying food online becomes more popular. The farmers treat the internet asanother, alternative channel for selling their products.194
The next two cases (Home Grown Cow, Locally Grown) are examples ofelectronic shopping centers (electronic malls) of agricultural products. The electronicmalls enable farmers to post information about their products. Using the electronic malls,farmers do not need to maintain and promote their own electronic stores, because all themarketing efforts, receiving of orders and enabling payments, are conducted by theelectronic mall. However farmers have to pay commissions that are percentage of salesrealized through the electronic mall.All the four presented examples of the B2C selling type show that farmers makeefforts to offer customers the value that is difficult to offer by traditional retail shops.The value can have many sources such as: easy to identify origin of products, the factthat the products are grown locally, customer choice of preferred production method,exceptional product quality (connected with taste, organic production). Most of thepresented B2C cases show that farmers using the Internet sell products for niche marketssuch as local society, customers of good knowledge on food quality, customers that lookfor unique product features.The last two cases are devoted to B2B sale of agricultural commodities. Twoelectronic marketplaces of agricultural commodities were presented (IGT electronicplatform operating in Poland, and NSEL electronic platform operating in India). Bothelectronic exchanges provide many market possibilities and functions for farmers. Theyenable farmers to find new customers and to broaden market reach. The electronic B2Bpublic marketplaces also enable to avoid intermediaries on the agricultural commoditiesmarket and contribute to the more efficient price discovery at country level. Theelectronic marketplaces are also introducing services connected with supporting supplychain activities.References1. Aikman K.: Home Grown Cow provides farmers with E-Commerce opportunities, 2011,http://www.mikeroweworks.com/2011/022. AdelaideNow, Riverland farmers are fighting back against supermarkets cutting into theirprofits by selling fruit directly to customers online, 2010,http://www.adelaidenow.com.au/news/south-australia3. Chinese farmers go online to sell products, AFP, March, 2011, http://au.news.yahoo.com4. Hoffman D., Novak T.: Marketing in Hypermedia Computer-Mediated Environment.Conceptual Foundations. Journal of Marketing. (1996), Vol. 605. Karasiewicz G. Systemy dystrybucji artykułów rolno-spożywczych na rynku polskim,Wydawnictwa <strong>Nauk</strong>owe Wydziału Zarządzania UW, Warszawa, 20016. Keh H. Shieh E.: Online Grocery Retailing: Success Factors and Potential Pitfalls.Business Horizons Vol. 44, No.4, July 20017. Mahadaven B.:, Making Sense of the Emerging Market Structure in B2B E-Commerce,California Management Review, 2003, http://www.iimb.ernet.in/~mahadev/cmrb2b.pdf8. Nicolaisen R.:How will agricultural e-markets evolve. Proceedings of the USDA OutlookForum, Washington, DC, 20019. Readaway Ch., Smith M.: Godzina Dziennie z Facebook Marketingiem. Helion Press2010,195
10. Stone J.: Local farmers sell products online, 2010,http://www.theclaytontribune.com/articles11. Vietnamese farmers now sell online (2010), http://english.vietnamnet.vn12. Warkentin M., Bajaj A.: The On-Demand Delivery Services Model for E-Commerce, inGangopadhyay, Managing Business with Electronic Commerce: Issues and Trends.Hershey, PA: Idea Group Publishing, 2002 Idea Group Publishing, 2002SummaryThe paper discusses examples of the Internet usage as a marketing channel for sale of agriculturalproducts. The paper includes Polish and foreign case studies with description of various forms ofelectronic sale, both of the B2C and B2B types. The paper discusses operation of variouselectronic marketplaces and electronic stores of agricultural products. The author also listedadvantages and benefits of using electronic agricultural marketplaces for farmers and customers.Informacje o autorze:dr Dariusz StrzębickiFaculty of Economic Sciences WULS – <strong>SGGW</strong>ul. Nowoursynowska 16602-787 Warsaw Polande-mail: dariusz_strzebicki@sggw.pl196
5 (54) 2011Mária SzabóováPossibilities of using of the venture capital as an innovativeinstrument in conditions of the Slovak republic in thecompetence of the National Agency for Development Smalland Medium EnterprisesThe contribution describes the venture capital as an innovative instrument usedin the Slovak republic. Basic characteristic of venture capital presents its advantagesand disadvantages, as well as describes the existing venture capital funds in the Slovakrepublic and the venture capital programmes are given in the first part. Hereby, thecontribution describes monitoring of development of venture capital investments in theSlovak republic in the competence of the National Agency for Development Small andMedium Enterprises. Finally, the paper presents possibilities as we can improveavailability of the venture capital in our conditions.IntroductionThe venture capital is a fund which invests own capital into unlisted companies byinvestor, as well as partnership of enterpriser and investor. It is a fund used to finance thestart of the company. The venture capital is used for development of a company. Investorof the venture capital provides some amount of financial capital. Hereby, investoracquires an agreed proportion of own capital of a company. In the present time, venturecapital is one of the new alternative forms of a company financing, but still not veryoften using form of financing in practice. The importance of using of the venture capitalis increasing. Although it is always considered as very risky financial instrument and itsusing is minimal in conditions of the Slovak republic. The venture capital has bigimportance mainly within the development of small and medium enterprises.Basic characteristics of the venture capital, its advantages anddisadvantagesThe venture capital is provided by professional companies investing intoenterprise handling potential of significant growth for purposes to start operations,development or transformation ownership.The venture capital is:- Investors put money into the own capital of companies whose shares are not registeredand traded on the stock exchange,197
- Means to finance the start of companies operations, its development or expansion,when venture capital investor enters into an agreed share of the own capital ofa company for its provide a certain amount of financial capital,- The newly emerging companies - setting up a joined company with a cash contributionto basic capital of the venture capital company 1 .The venture capital is a type of private equity finance involving investments in unquotedcompanies with growth potential. It is generally medium to long term in nature made inexchange for a stake in a company. The term a venture capital is likely to be accepted asthe generic term for business angels, mezzanine equity, institutional or any similarinvestments in early stages of business 2 .Primary investors of the venture capital are following:Business angels,Dependent, semidependent and independent investors,Government supported organizations.Possibilities of the venture capital financing:1. Seed capital - the completion of a research, development and verification of initialconcept and business plan before start-up position is achieved by enterprise,2. Start-up capital - financing provided companies to develop and finalize production ofa product or service and initial marketing. Enterprises may be in the establishment phase(this is a new business) or enterprises that have already been established, but do not selltheir products or do not provide their services regularly on a commercial basis,3. Other early stage – enterprise has completed a development phase of the product orservice and requires further financing to start commercial production for the purposes toachieve early sales, a company has not had to make a profit yet,4. Development, expansion - financing provided for the purpose of growth anddevelopment already production enterprise, irrespective of whether they have reachedthe breaking point or not, the investment goes to the expansion of production,development of market potential, further development of a product or service, possiblyin extending working capital 1 .Using of the venture capital as an innovative finance instrument has some advantagesand disadvantages.Advantages of the venture capital:One of the possibility strengthening of capital which is owned by an enterprise,Means of ensuring growth of an enterprise,1 THE NATIONAL AGENCY FOR THE DEVELOPMENT OF SMALL AND MEDIUMENTERPRISES: http://www.nadsme.sk/content/rizikovy-kapital [cited 2011-02-16]2 DAGOGO. D. W., OLLOR. W. G. The effect of venture capital financing on theeconomic value added profile of Nigerian SMEs. African Journal of Accounting,Economics, Finance and Banking Research Vol. 5. No. 5. 2009. p. 41. Available online< http://www.globip.com/pdf_pages/african-vol5-article2.pdf>198
Enterprise does not pay interest or payments,Expansion of a business cooperation,Disadvantages of the venture capital:Increase of number of owners,High risk for investors, as well as owners of enterprise,Main sources of venture capital are considered individuals, banks, governments,universities and pension funds 3 .Programmes of the venture capitalThe concept of the venture capital was designed in year 2005 (the venturecapital focused on development of small and medium enterprises). The National Agencyfor Development of Small and Medium Enterprises approved Conditions of realizationand focus of the Venture capital Programmes on 28 February 2006 4 .The National Agency for Development of Small and Medium Enterprisesestablished following venture capital funds till year 2006 5 :a) Start-up Capital FundStart-up capital fund was established on the basis of the Seed capitalprogramme in 1995. It was financed by the PHARE and than by the state budget. Fundwas managed by the Seed Capital Company established by National Agency forDevelopment of Small and Medium Enterprises. Fund is dedicated to support small andmedium enterprises within the overcome deficiency of seed and development capital byproviding the venture capital. Seed Capital Company was renamed as Fund of Funds in2006. Minimum amount of investment in EUR is 6 639, maximum amount of investmentin EUR is 663 878 and preferred amount of investment in EUR is in the range 199 166 -265 551. Scope of financing is preferably in the range 10 – 40 %.b) Regional Start-up Capital FundsIt was created in 2003. Fund is intended for the development of small andmedium enterprises in Banska Bystrica, Zilina, Kosice and Presov regions. This funddiffers from Start-up capital fund by the geographical acceptability of projects and sizeof investment. Minimum amount of investment in EUR is 6 639, maximum amount ofinvestment in EUR is 165 970 and preferred amount of investment in EUR is in therange 66 388 – 99 582. Scope of financing is preferably in the range 10 – 40 %.c) INTEG FundIt was established for the purpose to support innovative projects in 2005. It is the venturecapital for enterprise involved in the technological incubators in Bratislava and InovaTech in Sladkovicovo. Minimum amount of investment is undefined, maximum amount3 BALÁŽ, V.: Trendy vo financovaní inovácií v Európskej únii, In: Ekonomickýčasopis, 2000, č. 5, s. 559 – 582. Bratislava: SAV, ISSN 0013-30354 FOND FONDOV: FONDY RIZIKOVÉHO KAPITÁLU: http://www.fondfondov.sk/[cited 2011-03-07]5 3ON PRIVATE EQUITY: http://www.3on.sk/fondy.html [cited 2011-02-16]199
of investment in EUR is 132 776 and preferred amount of investment in EUR is in therange 16 597 – 33 194. Scope of financing is preferably in the range 10 – 40 %.d) SISME FundIt is newly established fund opened at the end of 2005 together with the INTEG fund. Itsresources are to be used for innovative projects from the area of industry production,production and trade services and new technologies from all over Slovakia. Minimumamount of investment is undefined, maximum amount of investment in EUR is 165 970and preferred amount of investment in EUR is in the range 66 388 – 99 582. Scope offinancing is preferably in the range 10 – 40 %.e) Development Fund for Small and Medium EnterprisesNational Agency for Development of Small and Medium Enterprisesestablished following Funds of the venture capital through Fund of Funds within theimplementation of the venture capital programme:Seed Capital Fund,Slovak Start-up Fund,Slovak Development Fund.Minimum amount of investment within the Seed Capital Fund in EUR is 6 639,maximum amount of investment is unlimited and preferred amount of investment inEUR is in the range 99 582 – 165 970. Scope of financing is preferably in the range 10 –40 %. Minimum amount of investment within the Start-up Fund is undefined, maximumamount of investment in EUR is 1 659 696 and preferred amount of investment isundefined. Scope of financing is preferably above 25 %. Minimum amount ofinvestment within the Slovak Development Fund is undefined, maximum amount ofinvestment in EUR is 3 319 392 and preferred amount of investment is undefined.Table no. 1 Overview of the venture capital programmesVenturefundscapitalMinimumamount in €Maximumamount in €Preferred amountin €Scope of financingStart-up Capital Fund 6 639 663 878 199 166 - 265 551 10 – 40 %Regional Start-upCapital funds 6 639 165 970 66 388 - 99 582 10 – 40 %INTEG Fund undefined 132 776 16 597 - 33 194 10 – 40 %SISME Fund undefined 165 970 66 388 - 99 582 10 – 40 %Seed Capital Fund 6 639 unlimited* 99 582 - 165 970 10 – 40 %Slovak Start-up Fund undefined 1 659 696 undefined preferably above 25 %Slovak DevelopmentFund undefined 3 319 392 undefinedminority stakes (atmin.25%), majority stakes* maximum amount of investment was dissolve in year 2009 in keeping with averageamount of investment 663 878 €Source: “Fond fondov, s.r.o.”, own elaboration200
Table no. 1 contains overview of the basic information within the venture capitalprogrammes relating to the minimum, maximum and preferred amount of investments inEUR, as well as scope of financing.Table no. 2 Overview of the acceptable and unacceptable financing area withinthe venture capital fundsVenture capitalfundsAcceptable financing areaUnacceptable financing areaStart-upFundCapitalRegional Start-upCapital fundsINTEG FundSISME FundSeedFundSlovakFundCapitalStart-upSlovakDevelopmentFundIndustry, production services,innovative enterprises, activetourismIndustry, production services,innovative enterprises, activetourismInnovative projects within theindustry, production and businessservices area and newtechnologiesInnovative projects within theindustry, production and businessservices area and newtechnologiesUnlimitedSmall and medium enterprisesSmall and medium enterprisesAgriculture primary production, farming, productionof weapons, alcoholic beverages, operations ofgaming-houses, passive tourism, wholesale and retailsaleAgriculture primary production, farming, productionof weapons, alcoholic beverages, operations ofgaming-houses, passive tourism, retail saleAgriculture primary production, farming, productionof weapons, alcoholic beverages, operations ofgaming-housesAgriculture primary production, farming, productionof weapons, alcoholic beverages, operations ofgaming-housesAgriculture primary production, farming, productionof weapons, alcoholic beverages, operations ofgaming-houses, passive tourismAgriculture primary production, farming, productionof weapons, alcoholic beverages, operations ofgaming-houses, passive tourism, wholesale and retailsaleSpeculative investments in selected assetclasses,investment in operating gamblingSource: “Fond fondov, s.r.o.” own elaborationTable no. 2 is focused on acceptable and unacceptable financing area within the existingventure capital funds. The most acceptable financing areas are industry, production andbusiness services, new technologies, innovative enterprises, active tourism and in thecase of Slovak Start-up Fund and Slovak Development Fund it is small and mediumenterprise. Seed Capital Fund is unlimited. Excluded are investments within theagriculture primary production, farming, production of weapons, alcoholic beverages,operations of gaming-houses, passive tourism, wholesale and retail sale, speculativeinvestments in selected asset classes and investment in operating gambling, but it dependon type of venture capital fund.201
Table no. 3 Overview of suitable financing stages, investment period andgeographicaleligibility within the Venture Capital FundsVenture capital fundsStart-upCapitalFundRegionalStart-upCapitalfundsINTEGFundSISMEFundSeedCapitalFundSlovakStart-upFundSlovakDevelopmentFundSuitablefinancingstagesInvestmentperiod inyearsGeographicaleligibilityseed, start seed, startup, up,development developmentflexibile1- 5SlovakRepublicflexibile1- 5SR – BanskaBystrica,Zilina,Presov andKosiceregionsseed, startupflexibile1- 5SR –BratislavaandTrnavaregionsSource: “Fond fondov, s.r.o.” own elaborationseed, startupmaximum1 - 5SlovakRepublicseed1 - 5SlovakRepublicstart up,developmentflexibile1- 4SlovakRepublicstart up,developmentMid-termhorizont2 - 5The seat andcore businessof thecompanymust be inSRTable no. 3 contains overview of suitable stages, investment period andgeographical eligibility within the individual venture capital funds existing in the Slovakrepublic. The most suitable financing area is start up financing area and investmentperiod is in the range 1 – 5 years. Geographical eligibility within the venture capitalfunds is all area of the Slovak republic with the exception of Regional Start-up Capitalfunds, INTEG Fund and Slovak Development Fund with geographical eligibility inselected regions of the Slovak Republic.The venture capital can be formal, i.e. venture capital funds come from institutionalinvestors or informal, i.e. venture capital funds come from companies and privatepersons 6 . Venture capital funds in the competence of the National Agency forDevelopment of Small and Medium Enterprises are not the only venture capital funds inthe Slovak republic. In addition to these funds, private funds as Slovak-AmericanEnterprise Fund – SAEF, VenCorp Slovakia and Genesis Capital there exist. Thesefunds also provide the venture capital investments for small and medium enterprises.Slovak-American Enterprise Fund (SAEF) is successor of the Czech and SlovakAmerican Enterprise Fund. These funds strengthen development of enterprises generallyin three main areas:6 SPIŠÁKOVÁ, E.: Rizikový kapitál - inovatívny finančný nástroj, Financial markets,journal for theory and practice of financial markets, 2010, Available online, [cited 2011-03-08]202
Investments in start-up enterprises bring to market new technologies and processes (seedcapital, early stage),Investments in existing small enterprises, which this type of capital assisted in theirorganic growth, growth through acquisitions or within the restructure of the balancesheet (development, expansion),Buy-in, buy-out, spin-off 7 .VenCorp Slovakia started its activities in a Slovak market in order to carry out businessactivities of a private equity group of investors from the region of western and centralEurope. The group is a member of SLOVCA (Slovak Venture Capital and Private EquityInvestment). The goal of its activities is to valorize funds of its shareholders throughinvestments into qualitative and perspective projects in different phases of development.Since the beginning, the group has been developing in two directions; i.e. in the propertydevelopment field, currently prevailing, and venture capital. When investing, VenCorpgroup uses various equity instruments (share redemption, capital increase, convertibledebt, management buy-in). Time spent in the project until it exits is from 3 to 7 years 8 .Genesis Capital provides sources for financing acquisitions, management buy-out,management buy-in and leveraged buy-out. Company provides capital for developmentsmall and medium enterprise in the Slovak republic and the Czech republic andfinancing of buyouts of Slovak and Czech companies 9 .Overview of the venture capital investments in the Slovak republic in competent ofthe NADSMEVenture capitals funds are complex system of development of the innovationsand small and medium enterprises as a new innovative financial instrument.The venture capital is not enlarged in forms of financing in the Slovak republiccurrently. Its use is in a great measure limited to the underdeveloped capital market. Thereason for the insufficient use of the venture capital is the fact that in Slovakia there is alack of fast growing innovative companies using this form of financing, as well as lessdevelopedcapital market.The main purpose of using the venture capital is to support projects that are associatedwith high risk of failure. Currently, countries dependent on success in global markets,especially from innovative activities, but the innovative capacity of the Slovak republicis insufficient. In terms of those in the Central and Eastern European Statistics, EVCA,7 THE NATIONAL AGENCY FOR THE DEVELOPMENT OF SMALL AND MEDIUMENTERPRISES: http://www.nadsme.sk/content/rizikovy-kapital [cited 2011-02-16]8 VERCORP, MEMBER OF THE SLOVAK VENTURE CAPITAL AND PRIVATEEQUITY ASSOCIATION: http://www.vencorp.sk/o-spolocnosti/o-spolocnosti-vencorp/[cited 2011-03-08]9 GENESIS CAPITAL: http://www.genesis.cz/ [cited 2011-03-08]203
Slovakia lags behind not only the countries of the Central and Eastern Europe, as well asthe actual European average. The venture capital is very important area of enterprise indeveloped countries of the European Union.Table no. 4 Total amount of approved investments in venture capital funds in theSlovak republic in competent of the NADSMEVenture capital funds in EURRoky2006 2007 2008 2009 2010Start-up capital fund 956 0 1 845 582 3 396 100 5 350 330Regional start-up capital funds 116 0 165 970 460 960 498 450INTEG Fund 0 0 0 0 0SISME Fund 332 0 0 329 940 828 450Seed Capital Fund 249 664 6 881 099 3 542 476 0Slovak start-up fund 3 983 6 838 3 452 168 5 620 646 0Slovak development Fund 0 0 0 5 078 000 22 062 300Total 5 636 7 502 12 344 818 18 428 122 28 739 530Source: NADSME, „Position of small and medium enterprises from 2006 till 2010“In the present time using all of venture capital funds have increased. In the time ofeconomic crisis, the venture capital supports perspective firms, which are not able torealize their activities by reason of hard access to finance.Although awareness of enterprises within the opportunities of the use of innovativefinancial instruments has increased gradually, the fact that a stranger should enter anenterprise discourages considerably. Despite the fact that entrepreneurs have anopportunity to drawdown, which would represent potential start-up and development ofthe company, their distrust of the possibility of funding is still in a significant negativefactor.The venture capital is not used in the same extent as in other European countries.Insufficient using of the venture capital is caused by defects of the venture capitalsupply, as well as on the side of venture capital demand. Deficiencies on the supply sideare arising from the facts that demand for risk capital is low.However, not every enterprise is suitable for the location of the venture capital mainlyin terms of investment criteria, such as potential growth of branch and target company,quality of a management, realistic business plan, return on investment,creation/maintenance of position in work, impact on the environment is not negative andinnovation of a project. The enterprise must have a suitable property and ownershipstructure and a promising prospect. Starting small and medium enterprises with a uniqueidea, which do not have enough financing sources, are interesting for the venture capitalfinancing, as well as innovative enterprises which have significant potential for futuregrowth.204
ConclusionThe venture capital can be described as the capital provided by professional companiesto start, development or transformation of the private firms that are able to demonstratetheir growth potential and are not listed. High potential return on investmentcompensates investor’s relatively high risks. Investment of the venture capital isa number of year’s process of cohabitation subject of enterprises surrounded by venturecapital investors.Use of the venture capital has also some disadvantages. Investors require a high rate ofreturn to cover the risk involved and there is an increase in the number of owners whohave an impact on strategic decision-making of enterprise. Many entrepreneurs have anaversion to the entry of a new partner or shareholder in the firm, or against the future tosell their stake in a new company stronger investor.Since the provision of venture capital in the SR has been still underdeveloped and doesnot cover companies' needs, availability of venture capital should be improved. It isnecessary to propose a new regulatory framework to enhance the attractiveness of theuse of the venture capital for small and medium enterprises. Bad financial structure ofenterprises is a negative factor for the entry of the venture capital, but also a barrier touse foreign resources in the form of bank loans. A large part of Slovak companies areconsistently undercapitalized. However, investors´ interest has increased in recent years.Investors considered the Slovak market for an interesting site in terms of its use.Increasing of awareness of the venture capital using is responsible the Slovak VentureCapital Association. This association cooperates with various Slovak and foreigninstitutions and organizations in solving problems of its members and the general issuesrelating to a private enterprise. Now, it offers the opportunity to represent the commoninterests of investors of the venture capital. The main purpose of this association is toinform not only businesses, but also the investment and banking institutions. It isnecessary to increase the awareness of other economic, political and administrativeinstitutions in the Slovak republic. Hereby, it is very important to inform the generalpublic, too.The main aim of paper focused on the possibility of using the venture capital as aninnovative financial instrument in conditin of the Slovak republic within the scope of theNational Agency for Development of Small and Medium Enterprises was to highlightthe fact that the venture capital represents currently for enterprises available externalsource of enterprises financing. The paper contains many information within the venturecapital programmes, overview of acceptable and unacceptable financing area, suitablefinancing stages, investment period and geographical eligibility, as well as overviewtotal amount of approved investments in venture capital funds in the Slovak republic incompetent of the NADSME. The aim of the paper is to show of possibility of financingby the venture capital and to rise awareness on venture capital funds, therefore it is oneof the effective methods of financing. Despite of the advantages, financing by theventure capital is not very often used method of financing in the present time. Given thefact that a small and medium enterprise is an essential part of the national economy,promotion of its financing is very important. There is potential, which could be theventure capital applied, but there is no functional system, especially as regards financingthe early stages of innovative businesses.205
The main sources of information in terms of this area were datas relating to theventure capital obtained from the National Agency for Development of Small andMedium Enterprises in the Slovak republic. Data base is represented by the documents“Information on the state revolving programmes implemented to support small andmedium enterprises through the National Agency for Development of Small andMedium Enterprises”.Material for elaboration of this paper were research reports and statistical data,technical and scientific contributions published within the seminars, book publications ofdomestic and foreign authors, which represent a secondary source of informationrequired for Report elaboration and European Private Equity & Venture CapitalAssociation and Reports relating to the position of small and medium enterprises from2006 till 2009 obtained from the National Agency for Development of Small andMedium Enterprises in the Slovak republic. In this area, some structured interviews withparticipant of the National Agency for Development of Small and Medium Enterprisesfor the purpose of ascertain of actual situation in the Slovak republic have been carriedout. Basic methods used in the paper include the selection methods, methods of analysis,method of synthesis, evaluation of results, statistical testing methods and testing ofhypotesis relating to the venture capital using by the free statistical software.References[1] BALÁŽ, V.: Trendy vo financovaní inovácií v Európskej únii, In: Ekonomickýčasopis, 2000, č. 5, s. 559 – 582. Bratislava: SAV, ISSN 0013-3035[2] DAGOGO. D. W., OLLOR. W. G. The effect of venture capital financing on theeconomic value added profile of Nigerian SMEs. African Journal of Accounting,Economics, Finance and Banking Research Vol. 5. No. 5. 2009. p. 41. Available online< http://www.globip.com/pdf_pages/african-vol5-article2.pdf>[3] 3ON PRIVATE EQUITY: http://www.3on.sk/fondy.html [cited 2011-02-16][4] FOND FONDOV: FONDY RIZIKOVÉHO KAPITÁLU: http://www.fondfondov.sk/[cited 2011-03-07][5] GENESIS CAPITAL: http://www.genesis.cz/ [cited 2011-03-08][6] NATIONAL AGENCY FOR DEVELOPMENT OF SMALL AND MEDIUMENTERPRISES: http://www.nadsme.sk/content/rizikovy-kapital [cited 2011-02-16][7] SLOVAK AMERICAN ENTERPRISE FUND: http://www.saef.sk/?id=8 [cited2011-03-07][8] SPIŠÁKOVÁ, E.: Rizikový kapitál - inovatívny finančný nástroj, Financial markets,journal for theory and practice of financial markets, 2010, Available online , [cited 2011-03-08][9] VERCORP, MEMBER OF THE SLOVAK VENTURE CAPITAL AND PRIVATEEQUITY ASSOCIATION: http://www.vencorp.sk/o-spolocnosti/o-spolocnosti-vencorp/[cited 2011-03-08]206
SummaryVenture capital is an important assumption for the existence of small growthenterprises that have ideas, too bold for traditional banking products. The acquisition offunds by banks is a lengthy process for enterprises. This process is very complicated andapproval of bank loans is strict. Financing by the venture capital is appropriate,especially for entrepreneurs who did not have enough funds to start business or unable toproperly spend the funds effectively. Increasing the use of the venture capital is relatedto reviving the economy, improving the business environment, infrastructure, reviewingownership, improving conditions for the business environment, capital marketdevelopment and increases a rate of economic freedom. It is necessary to highlight thebenefits that the use of the venture capital brings with it.Contact addressIng. Maria SzabóováSlovak University of Agriculture, Faculty of Economics and Management,Department of Finance,Tr. A. Hlinku 2,949 76 Nitra, Slovak Republice-mail: szaboova.m@gmail.com207
5 (54) 2011Marián TóthImpact of CAP subsidies on profit in agriculturalenterprises in SlovakiaIn this article we focus on the evaluation of subsidies and profit. To evaluate theimportance of subsidies in relation to income, we selected two indicators. The first isa proportional indicator of profit per hectare of agricultural land and the second is the(profit minus subsidy) per hectare of agricultural land. These indicators enable to assessthe status of farms in case that they would not receive subsidies. Chosen timehorizon from 1993 to 2008 also allows assessment of the progress of the importance ofsubsidies in terms of ability to make a profit.IntroductionBaláž, P. (1996) - characterizes subsidies as cash with the nature of transfer payments,i.e. payments by individuals or institutions provided to another individual or institutionwithout some backflow to be expected.In their study Mayrand, K., Dion, S., Paquin, M., Lebel, IP (2003) address the need todefine subsidies. They argue that the term includes extensive subsidies for theagricultural segment of public policy that needs to be defined and classified for the betteranalysis and understanding. Agriculture is in their opinion, one of the economic sectorsin which subsidies are most used. Subsidies have profound effects on production andtrade in the agricultural sector.Slosar, R., Šlosárová, A., Majtán (1996) define grants and subsidies as provided nonrepayablefunds (usually cash) from the state budget, budgets of cities andmunicipalities, from state funds. Subsidies are provided either on business developmentor to cover costs. Their purpose is to cover the imbalance of financial flows. The subsidyshall be construed as a financial assistance, which serves to maintain low prices forgoods and services to the population.Tomanovičová, J. (2008) describes in her article the objectives of the CommonAgricultural Policy (CAP), which are in the Treaty of Rome Article no. 39 as follows:increase agricultural productivity by promoting technical progress and ensuring therational development of agricultural production and optimum utilization of productionfactors, especially labour,ensure a fair standard of living of farmers, particularly by increasing individual earningsof persons engaged in agriculture,to stabilize markets;availability of supplies,ensure that supplies reach consumers at reasonable prices.Balkhausen, O., Bans, M., Grethe, H. and Nolte, S. (2005) identified main elements ofthe CAP reforms as follows:208
decoupling, the decoupling of direct payments from production,cross - compliance (cross compliance) - higher standards of environmental protection,food safety and animal welfare,modulation - 5% of direct payments after reaching the full amount will be transferred toII. Pillar of the CAP, which is rural development (not for the new Member States until2013),introduction of new rural development measures to support farmers,new guidance system for businesses.Blaas, G. (2006) says that European farmers would not survive without support. Theglobalization causes a need for the support of European agriculture. The main reason isthat agriculture in some parts of the world has great advantages compared with theEuropean one, which allow the production at lower costs. These are the countries whichhave almost unlimited production resources, especially land. Today, agriculturalsubsidies are seen not as support of production but as a reward to the farmers forproducing public goods.Material and methodsSince the establishment of the Slovak Republic in 1993 to the present day, agriculturehas been supported by public funds. Subsidies during this period reached a differentlevel and were focused on different areas of production respectively process. The mainobjective of this article is to assess the relationship between the amount of subsidies andprofit.In the article we use the following sources of information and material:professional domestic and foreign literature,Green reports of the Ministry of Agriculture for the years 2001 to 2009 and other datafrom the Ministry of Agriculture, in particular Rural Development Program for 2007-2013,individual data for the years 1993 to 2008 for all existing agricultural enterprises (legalentities) from information sheets of the Ministry's internal.To achieve the main goal we used the following methods:analysis of individual balance sheets and profit and loss statements for selectedindicators, these data and selected ratios were analyzed using statistical softwareStatgraphics. For removal of extreme values, we used the exclusion rule (the lowest 5%and the highest 5% were excluded)graphic data processing - we used various forms of graphical data processing:box plot – which shows the median, the cross shows the average value, upper and lowerquartile The length of the box represents interquartile range (IQR), i.e. central 50% ofvalues file. Right comma is 75 percentile and left comma 25 percentile.graph of average values with 95% confidence levels.quantile chart - shows the empirical and normal cumulative distribution.ratios:profit per ha = (profit after tax) / (agricultural land).profit without subsidies per ha= (profit after tax - subsidies) / (agricultural land).209
ResultsTaking into account the comparison of quantile charts for profit per hectare and profitwithout subsidies per hectare (chart 1), it can be stated that even with subsidies up to35% of businesses over the years 1993 to 2008 did not achieve positive earnings – profitand without subsidies up to 95% of enterprises. It is possible to conclude that thesubsidies are for long-term viability of farms an important source of funding. Is itpossible to discuss what would change if the farms did not receive subsidies, how wouldbe the development of agricultural commodity prices. Such a question is relevant only inthe case that subsidies would be cancelled in all countries, within the EU and alsoworldwide. The current situation shows that for long-term survival of enterprises inagriculture there is a need of government funds.Chart 1Quantile chart –Profit/hectare of agricultural land (Profit-subsidies)/hectare of agriculturallandSource: own calculationThe quantile chart shows the variable profit per hectare significantly breaks in the value0. The quantile chart also shows that 25% of enterprises had the value of this variablefrom 0 to 400 SKK (0-13,28EUR) per hectare throughout the reporting preiod. From theabove it can be concluded that there is strong motivation to achieve a low profit andprobably by using accounting operations, the enterprises try to optimize the income tax.Reason for this conclusion is the comparison of cumulative probability of profit/hectareand (profit-subsidies)/hectare. By excluding the subsidies the chart is harmonic whichmeans that subsidies cause the disharmonic chart on the left. And that is irrational.Therefore the disharmony is caused by the tax dimension of economic result – profit orloss.Previous quantile chart 1 does not evaluate the development of indicators over time. Thisview can be found in tables 1 and 2 and also in subsequent charts. The first tablecontains the descriptive characteristics of the variable profit per hectare of agriculturalland.210
Average value of the variable profit per hectare of agricultural land ranged from -1369SKK (-45,5 EUR) in 1993 to 1327 SKK (40,1 EUR) in 2007. It is possible to evaluatethat in the studied enterprises the situation regarding profit has improved after joiningthe EU in 2004, since the average value of this variable is always positive.The comparison of the average of the whole period, with a median for the whole periodshows that the median value is higher which means that after the removal of "extreme"values the situation in the enterprises regarding profit per hectare is better.Table 1Profit/hectare of agricultural land in 1993-2008 in thousand SKKYearNumberofenterprisesAverageMedianStandarddeviationCoefficient ofvariationLower quartileUpperquartile1993 876 -1,36916 -0,95711 2,13742 -156,11% -2,63961 0,1134481994 926 -0,85106 -0,30771 2,22308 -261,21% -2,14176 0,4075121995 967 -0,53347 0,016929 2,02088 -378,82% -1,64426 0,5871161996 1043 -0,19691 0,070661 2,1772 -1105,70% -1,3252 0,7760221997 1110 0,147952 0,184646 2,29722 1552,68% -1,01394 1,284421998 1116 -0,28249 0,07339 2,18269 -772,67% -1,58575 0,8070361999 1088 -0,37452 0,054228 2,24318 -598,95% -1,63384 0,8423242000 1080 -0,49021 0,02074 1,67976 -342,66% -1,39941 0,3913942001 1094 0,543616 0,233906 1,65396 304,25% 0 1,002652002 1099 0,393741 0,218617 1,68378 427,64% 0,01056 0,7916672003 1173 -0,98165 0,010922 2,7166 -276,74% -2,37653 0,3418762004 1132 1,14246 0,685072 2,15638 188,75% 0,141794 1,853992005 1226 0,322753 0,283255 2,60512 807,16% 0,016628 1,244342006 1216 0,711543 0,468867 2,48736 349,57% 0,073099 1,502882007 1179 1,32697 0,825353 2,28857 172,47% 0,189973 2,254442008 1097 0,780658 0,488346 2,69527 345,26% 0,033435 1,78015Spolu 17422 0,060521 0,171171 2,35705 3894,56% -0,91338 1,00483Source: own calculationEvaluation of variability by the standard deviation and coefficient of variation isrelatively complicated. Both descriptive statistics are high and we can conclude that thevariability of profit per hectare in enterprises is high. The positive trend can be observedon the development of the coefficient of variation, positive in each period.The development of the upper and lower quartiles can be summarized as that since 2004more than 75% of businesses have achieved a positive ratio of profit per hectare. In theperiod 1993-2003 the similar situation was observed only in two periods.Another table (number 2) contains the descriptive characteristics of the development ofthe ratio profit minus the subsidy per hectare of farmland. Compared with the firstindicator the average during the whole period did not reach value higher than 0. Fromthis fact, it is possible to conclude that the management of farms without subsidies is not211
possible and the importance of subsidies is even increasing. The most negative value wasreached in 2008, when profit without subsidies per hectare of farmland reached SKK -7150 (237,3 EUR). Negative value was confirmed also by the median. During the entirereported period the median had negative value.Table 2(Profit-subsidies)/hectare of agricultural land in 1993-2008 in thousand SKKYearNumberofenterprisesAverageMedianStandarddeviationCoefficient ofvariationLower quartileUpperquartile1993 877 -3,58019 -3,61995 2,43233 -67,94% -5,21607 -1,530031994 926 -3,04961 -3,01239 2,59228 -85,00% -4,84878 -1,031941995 968 -3,19412 -3,1764 2,44459 -76,53% -4,90165 -1,311991996 1050 -2,83722 -2,93153 2,69161 -94,87% -4,73173 -0,866091997 1114 -2,88975 -2,96509 2,71259 -93,87% -4,54826 -1,084261998 1116 -3,33487 -3,3009 2,266 -67,95% -4,85091 -1,677891999 1021 -3,85858 -3,7639 2,84319 -73,69% -5,43916 -1,964862000 1080 -4,75215 -4,62683 1,93772 -40,78% -5,83982 -3,568762001 1099 -3,06126 -3,26141 2,19241 -71,62% -4,4527 -1,826252002 1128 -7,60962 -7,55629 3,53955 -46,51% -10,2558 -5,458122003 1191 -4,24534 -3,9593 3,0612 -72,11% -6,00317 -2,546522004 1150 -4,24222 -4,73278 3,01458 -71,06% -5,95725 -3,053352005 1240 -5,60554 -5,4736 3,44416 -61,44% -7,58685 -3,849842006 1214 -6,45195 -6,35115 3,3857 -52,48% -8,73769 -4,397232007 1196 -6,10352 -6,22459 4,12193 -67,53% -9,06557 -4,008812008 1082 -7,1496 -7,5202 4,2752 -59,80% -10,2663 -4,66773Spolu 17422 -4,56965 -4,39255 3,40933 -74,61% -6,52823 -2,42331Source: own calculationNegative development of the indicator supports the value of the upper and lowerquartile. It can be stated that in any of the years more than 75% of companies did notachieve positive profit without subsidies per hectare. The quartile chart even shows thatonly less than 10% of companies achieved the positive value of the indicator.Average values for both variables for each year are presented in the following Figure 2.212
Figure2Average value:Profit/hectare of agricultural land (Profit-subsidies)/hectare of agricultural landSource: own calculationFrom Figure 2 it is clear that the variable profit per hectare of agricultural land has threetrends. Increase in the variable but predominantly negative average value is the firsttrend. Stagnation in 1998-2000 with a slight negative trend and a negative averageincome is the second trend. The third is connected with period 2001-2008, when theaverage of the variable profit per hectare of agricultural land is positive (with theexception of 2003, which was affected by bad harvests due to drought) with relativelyhigh volatility.The second indicator - profit without subsidies per hectare of agricultural land - canreveal a significant decrease in mean values after 2004. Entering EU in 2004 brought theincrease in subsidies per hectare, but also a significant reduction in profit withoutsubsidy per hectare of agricultural land. Ability to make profit without subsidies afterjoining the EU is decreasing. One of the reasons is decoupling the CAP subsidies fromthe production.Boxed plot 3 compares four descriptive characteristics through a graphical display forboth variables:• profit per hectare of agricultural land.• profit without subsidy per hectare of agricultural land.Box plot213
Figure 3Profit/hectare of agricultural land (Profit-subsidies)/hectare of agricultural landSource: own calculationBox plots are visualizing the conclusions of previous assessments of descriptivecharacteristics. While in the first indicator there is a clear improvement over the period,the second indicator records decrease from the 2004.ConclusionThe analysis can be summarized into the following conclusions:• there is strong motivation to achieve a low positive result and probably using theaccounting operations enterprises try to influence the profit with the goal of taxoptimization.• since 2004, more than 75% of businesses achieve a positive ratio of profit or loss perhectare.• profit without subsidies is decreasing, which results in increasing importance ofgovernment funds flowing through the CAP.• in each year more than 75% of companies did not achieve positive profit withoutsubsidies per hectare.• entering the EU brought an increase in subsidies per hectare, but also a significantreduction in profit or loss without subsidy per hectare.ReferencesBALÁŽ, P.: Veľká ekonomická encyklopédia. 1.edition. Bratislava: SPRINTvfra, 1996.p.614, ISBN 80-88848-02-4MAYRAND,K.,DIONNE,S.,PAQUIN,M.,LEBEL,I.P.: The Economic and EnviromentalImpact of Agricultural Subsidies, UNISFERA International Centre, 2003, p. 20-26ŠLOSÁR, R.-ŠLOSÁROVÁ,A.-MAJTÁN.Š.: Výkladový slovník ekonomickýchpojmov. 2.edition Bratislava: Slovenské pedagogické nakladateľstvo, 1996, 255p. ISBN80-08-00869-5TOMANOVIČOVÁ, J.: Efektívnosť vynaloženej štátnej pomoci v poľnohospodárstvekrajín EÚ.In: Ekonomické rozhľady. Roč.37,2008,č.3, p. 374-381, ISSN 0323-262x214
BALKHAUSEN,O., BANSE,M.,GRETHE,H. A NOLTE,S.: Modellierung derAuswirkungen einer Entkopplung der Direktzahkungen in der EU auf dieFlächenallokation und Wiederkäuerproduktion.In: Agrarwirtschaft, Jahrgang54,2005.p.351-365,ISSN 0002-1121BLAAS,G.a kol.: Poľnohospodárske politiky v krajinách OECD. Monitoringa hodnotenie 2006, Správa za SR, VÚEPP, Bratislava, 2006,p.17, Dostupné na:http://www.land.gov.download.php?fID265SummaryThe article evaluates the changes in Slovak agriculture after entering EU. Wefocus on the ability to make profit by using two ratios. From the analysis we cansummarize, that agricultural enterprises generate higher profit after 2004. But they aremore and more dependent on the help in form of CAP subsidies. Decoupling thesubsidies from production brought in Slovakia a new form of agriculture – agriculturewith fewer earnings, less production. Without subsidies a majority of enterprises is notable to survive in the long run.Contact AddressIng. Marián Tóth, PhD.Slovak University of Agriculture, Faculty of Economics and Management,Department of finance,Tr.A.Hlinku 2, 94976 Nitra, Slovakia,e-mail: marian.toth@fem.uniag.sk215