- Page 1 and 2: 5/54Zeszyty NaukoweSzko³y G³ówne
- Page 3 and 4: RADA PROGRAMOWABogdan Klepacki (SGG
- Page 5 and 6: Rizovová Beáta, Gašparíkov Vero
- Page 7 and 8: Według średniego wariantu szacunk
- Page 9 and 10: Kluczowa dla zrozumienia możliwoś
- Page 11 and 12: Deklaracji w zakresie praw politycz
- Page 13 and 14: ezpieczeństwa żywnościowego powi
- Page 15 and 16: zbóż drastyczne wzrosły z dużym
- Page 17 and 18: 11. Międzynarodowy Pakt Praw Gospo
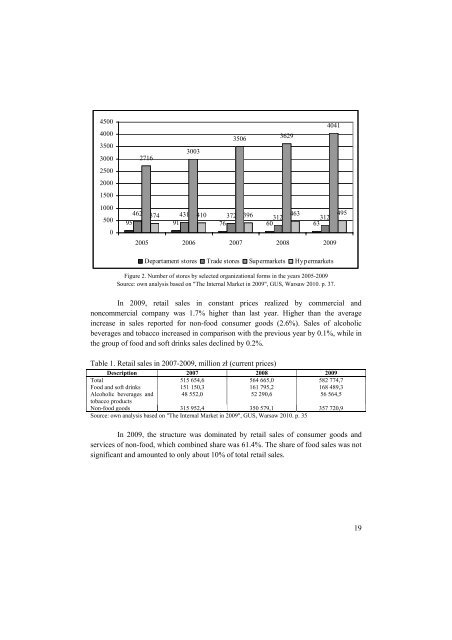
- Page 19: Figure 1. Structure of sales area s
- Page 23 and 24: etail sector is also particularly i
- Page 25 and 26: • modernity - the introduction of
- Page 27 and 28: time, place and form. Trade respons
- Page 29 and 30: The retailer must sometimes very qu
- Page 31 and 32: equipped with a pretty clear sign t
- Page 33 and 34: them. Also, very often the wrong wa
- Page 35 and 36: liquidated. Currently, fruit and ve
- Page 37 and 38: 5 (54) 2011Jarosław GołębiewskiZ
- Page 39 and 40: nowe formy zawierania transakcji, o
- Page 41 and 42: koszty połączeń internetowych or
- Page 43 and 44: on ewoluować z poziomu taktycznego
- Page 45 and 46: Rysunek 1. Model 3iUczciwość mark
- Page 47 and 48: produkcji, system informacyjny, sys
- Page 49 and 50: hiperkonkurencja, problemy środowi
- Page 51 and 52: 5 (54) 2011Ing. Katarína Kleinová
- Page 53 and 54: Why is it important to have a good
- Page 55 and 56: oles in international relations, tr
- Page 57 and 58: Scheme 2 Do you think that the inha
- Page 59 and 60: REFERENCES[1] GfK USA. 2011. The An
- Page 61 and 62: potrzeba przetrwanie skutków globa
- Page 63 and 64: Rysunek 2. Liczba zakładów ubezpi
- Page 65 and 66: Wzrastający udział w rynku stanow
- Page 67 and 68: W 2002 r. poprzez placówki bankowe
- Page 69 and 70: Portugalii, czy Włoch, gdzie udzia
- Page 71 and 72:
companies from the Polish Financial
- Page 73 and 74:
The increase in advertising expendi
- Page 75 and 76:
memo ability ads an advertisement b
- Page 77 and 78:
the sales can be find out from the
- Page 79 and 80:
5 (54) 2011Ľubica Kubicová, Zdenk
- Page 81 and 82:
Graph 1: Consumption of Milk and Da
- Page 83 and 84:
Graph 3: Consumption of Yoghurt per
- Page 85 and 86:
On the basis of the income elastici
- Page 87 and 88:
Producers of Activia Sweet Strawber
- Page 89 and 90:
ConclusionWhen the new product come
- Page 91 and 92:
them in the best possible way with
- Page 93 and 94:
"The integration of business practi
- Page 95 and 96:
DJSI indexes belong to the world's
- Page 97 and 98:
space for staff training in this ar
- Page 99 and 100:
Policy to the community:11. Does yo
- Page 101 and 102:
SummarySocial responsibility and et
- Page 103 and 104:
prowadzi do zwiększenia bieżącej
- Page 105 and 106:
ozwijające się wskazują na wyst
- Page 107 and 108:
wykorzystanych w dalszej części o
- Page 109 and 110:
Tabl. 1. Wyniki oszacowania paramet
- Page 111 and 112:
8 16,4 83,6 24,1 75,910 22,1 77,9 2
- Page 113 and 114:
Z kolei, uwzględniając współczy
- Page 115 and 116:
Literatura1. Diamond P.: National d
- Page 117 and 118:
- przemysł spożywczy,- handel i d
- Page 119 and 120:
żywnościowego nie należy bowiem
- Page 121 and 122:
wpływ na swoje towary. Rolnik musi
- Page 123 and 124:
produktów i usług do konsumentów
- Page 125 and 126:
Specyfika marketingu w agrobiznesie
- Page 127 and 128:
maksymalizację zysku, na pragnieni
- Page 129 and 130:
dóbr i usług wybranym klientom w
- Page 131 and 132:
14. Pilarczyk B., Nestorowicz R., M
- Page 133 and 134:
Fibres from sunflower stems are use
- Page 135 and 136:
the incoming world economic crisis,
- Page 137 and 138:
Tab 4 Break-event points of sunflow
- Page 139 and 140:
5 (54) 2011Beáta Rizovová, Veroni
- Page 141 and 142:
CostsImportance ofmedia withincommu
- Page 143 and 144:
4 TABLE 3. TOP 10 ADVERTISERS AND T
- Page 145 and 146:
Own surveyFor processing the proble
- Page 147 and 148:
Following chart 3 give a review of
- Page 149 and 150:
Information about authorsIng. Veron
- Page 151 and 152:
27 also agreed to further cut direc
- Page 153 and 154:
In new EU budget perspective for th
- Page 155 and 156:
Table 2 shows agrarian commodities
- Page 157 and 158:
Contact AddressIng. Patrik Rovný,
- Page 159 and 160:
welcomed by agrarian producers with
- Page 161 and 162:
they receive until December and in
- Page 163 and 164:
Table 1 Structure of agricultural e
- Page 165 and 166:
the year 2004 the change in the lev
- Page 167 and 168:
3 Total liquidity (L3)Analysis of l
- Page 169 and 170:
make effort for its development and
- Page 171 and 172:
5 (54) 2011Dušan ŠimoForeign trad
- Page 173 and 174:
the sales network of food chains an
- Page 175 and 176:
Table 3 shows the significantly inc
- Page 177 and 178:
5 (54) 2011Dariusz StrzębickiSelli
- Page 179 and 180:
• monetary value of agricultural
- Page 181 and 182:
Figure 2. The website of the citrus
- Page 183 and 184:
service, to reduce promotional cost
- Page 185 and 186:
• USDA Never Ever Three - means t
- Page 187 and 188:
quality. The products offered on th
- Page 189 and 190:
Many of these electronic commerce B
- Page 191 and 192:
commodities the market also offers
- Page 193 and 194:
• thanks to the electronic market
- Page 195 and 196:
delivery points. The warehouses are
- Page 197 and 198:
10. Stone J.: Local farmers sell pr
- Page 199 and 200:
- Means to finance the start of com
- Page 201 and 202:
of investment in EUR is 132 776 and
- Page 203 and 204:
Table no. 3 Overview of suitable fi
- Page 205 and 206:
Slovakia lags behind not only the c
- Page 207 and 208:
The main sources of information in
- Page 209 and 210:
5 (54) 2011Marián TóthImpact of C
- Page 211 and 212:
ResultsTaking into account the comp
- Page 213 and 214:
possible and the importance of subs
- Page 215 and 216:
Figure 3Profit/hectare of agricultu