pobierz - WydziaÅ Nauk Ekonomicznych SGGW w Warszawie
pobierz - WydziaÅ Nauk Ekonomicznych SGGW w Warszawie
pobierz - WydziaÅ Nauk Ekonomicznych SGGW w Warszawie

Create successful ePaper yourself
Turn your PDF publications into a flip-book with our unique Google optimized e-Paper software.
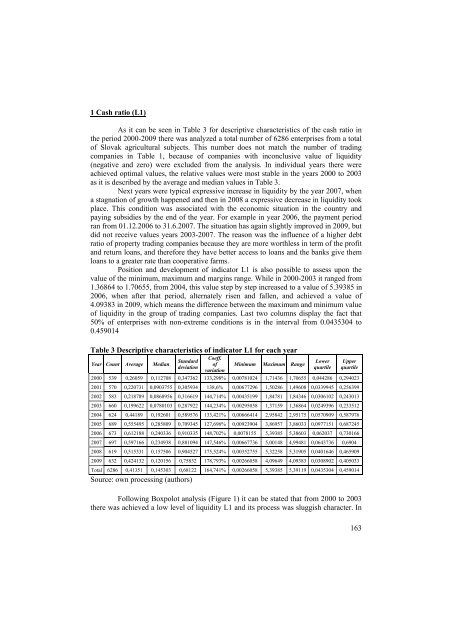
1 Cash ratio (L1)As it can be seen in Table 3 for descriptive characteristics of the cash ratio inthe period 2000-2009 there was analyzed a total number of 6286 enterprises from a totalof Slovak agricultural subjects. This number does not match the number of tradingcompanies in Table 1, because of companies with inconclusive value of liquidity(negative and zero) were excluded from the analysis. In individual years there wereachieved optimal values, the relative values were most stable in the years 2000 to 2003as it is described by the average and median values in Table 3.Next years were typical expressive increase in liquidity by the year 2007, whena stagnation of growth happened and then in 2008 a expressive decrease in liquidity tookplace. This condition was associated with the economic situation in the country andpaying subsidies by the end of the year. For example in year 2006, the payment periodran from 01.12.2006 to 31.6.2007. The situation has again slightly improved in 2009, butdid not receive values years 2003-2007. The reason was the influence of a higher debtratio of property trading companies because they are more worthless in term of the profitand return loans, and therefore they have better access to loans and the banks give themloans to a greater rate than cooperative farms.Position and development of indicator L1 is also possible to assess upon thevalue of the minimum, maximum and margins range. While in 2000-2003 it ranged from1.36864 to 1.70655, from 2004, this value step by step increased to a value of 5.39385 in2006, when after that period, alternately risen and fallen, and achieved a value of4.09383 in 2009, which means the difference between the maximum and minimum valueof liquidity in the group of trading companies. Last two columns display the fact that50% of enterprises with non-extreme conditions is in the interval from 0.0435304 to0.459014Table 3 Descriptive characteristics of indicator L1 for each yearYear Count Average MedianStandarddeviationCoeff.ofvariationMinimum Maximum RangeLowerquartileUpperquartile2000 539 0,26059 0,112708 0,347362 133,298% 0,00781024 1,71436 1,70655 0,044286 0,2940232001 570 0,220731 0,0903755 0,305934 138,6% 0,00677296 1,50286 1,49608 0,0339945 0,2563992002 583 0,218789 0,0868956 0,316619 144,714% 0,00435199 1,84781 1,84346 0,0306102 0,2430132003 660 0,199622 0,0780103 0,287922 144,234% 0,00295058 1,37159 1,36864 0,0249396 0,2335122004 624 0,44189 0,192601 0,589576 133,421% 0,00666414 2,95842 2,95175 0,0570909 0,5879762005 689 0,555495 0,285809 0,709345 127,696% 0,00923904 3,86957 3,86033 0,0977151 0,6872452006 673 0,612188 0,240336 0,910335 148,702% 0,0078155 5,39385 5,38603 0,062037 0,7301662007 697 0,597166 0,234938 0,881094 147,546% 0,00667736 5,00148 4,99481 0,0643736 0,69042008 619 0,515331 0,157506 0,904527 175,524% 0,00352755 5,32258 5,31905 0,0401646 0,4659092009 632 0,424132 0,120156 0,75832 178,793% 0,00266058 4,09649 4,09383 0,0308902 0,405033Total 6286 0,41351 0,145303 0,68122 164,741% 0,00266058 5,39385 5,39119 0,0435304 0,459014Source: own processing (authors)Following Boxpolot analysis (Figure 1) it can be stated that from 2000 to 2003there was achieved a low level of liquidity L1 and its process was sluggish character. In163