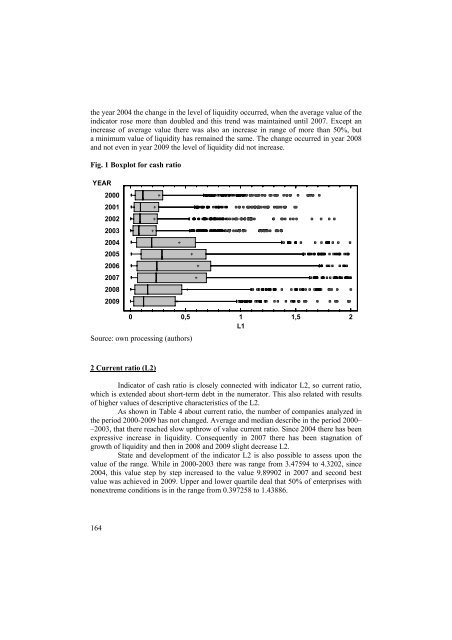
1 Cash ratio (L1)As it can be seen in Table 3 for descriptive characteristics of the cash ratio inthe period 2000-2009 there was analyzed a total number of 6286 enterprises from a totalof Slovak agricultural subjects. This number does not match the number of tradingcompanies in Table 1, because of companies with inconclusive value of liquidity(negative and zero) were excluded from the analysis. In individual years there wereachieved optimal values, the relative values were most stable in the years 2000 to 2003as it is described by the average and median values in Table 3.Next years were typical expressive increase in liquidity by the year 2007, whena stagnation of growth happened and then in 2008 a expressive decrease in liquidity tookplace. This condition was associated with the economic situation in the country andpaying subsidies by the end of the year. For example in year 2006, the payment periodran from 01.12.2006 to 31.6.2007. The situation has again slightly improved in 2009, butdid not receive values years 2003-2007. The reason was the influence of a higher debtratio of property trading companies because they are more worthless in term of the profitand return loans, and therefore they have better access to loans and the banks give themloans to a greater rate than cooperative farms.Position and development of indicator L1 is also possible to assess upon thevalue of the minimum, maximum and margins range. While in 2000-2003 it ranged from1.36864 to 1.70655, from 2004, this value step by step increased to a value of 5.39385 in2006, when after that period, alternately risen and fallen, and achieved a value of4.09383 in 2009, which means the difference between the maximum and minimum valueof liquidity in the group of trading companies. Last two columns display the fact that50% of enterprises with non-extreme conditions is in the interval from 0.0435304 to0.459014Table 3 Descriptive characteristics of indicator L1 for each yearYear Count Average MedianStandarddeviationCoeff.ofvariationMinimum Maximum RangeLowerquartileUpperquartile2000 539 0,26059 0,112708 0,347362 133,298% 0,00781024 1,71436 1,70655 0,044286 0,2940232001 570 0,220731 0,0903755 0,305934 138,6% 0,00677296 1,50286 1,49608 0,0339945 0,2563992002 583 0,218789 0,0868956 0,316619 144,714% 0,00435199 1,84781 1,84346 0,0306102 0,2430132003 660 0,199622 0,0780103 0,287922 144,234% 0,00295058 1,37159 1,36864 0,0249396 0,2335122004 624 0,44189 0,192601 0,589576 133,421% 0,00666414 2,95842 2,95175 0,0570909 0,5879762005 689 0,555495 0,285809 0,709345 127,696% 0,00923904 3,86957 3,86033 0,0977151 0,6872452006 673 0,612188 0,240336 0,910335 148,702% 0,0078155 5,39385 5,38603 0,062037 0,7301662007 697 0,597166 0,234938 0,881094 147,546% 0,00667736 5,00148 4,99481 0,0643736 0,69042008 619 0,515331 0,157506 0,904527 175,524% 0,00352755 5,32258 5,31905 0,0401646 0,4659092009 632 0,424132 0,120156 0,75832 178,793% 0,00266058 4,09649 4,09383 0,0308902 0,405033Total 6286 0,41351 0,145303 0,68122 164,741% 0,00266058 5,39385 5,39119 0,0435304 0,459014Source: own processing (authors)Following Boxpolot analysis (Figure 1) it can be stated that from 2000 to 2003there was achieved a low level of liquidity L1 and its process was sluggish character. In163
the year 2004 the change in the level of liquidity occurred, when the average value of theindicator rose more than doubled and this trend was maintained until 2007. Except anincrease of average value there was also an increase in range of more than 50%, buta minimum value of liquidity has remained the same. The change occurred in year 2008and not even in year 2009 the level of liquidity did not increase.Fig. 1 Boxplot for cash ratioYEAR20002001200220032004200520062007200820090 0,5 1 1,5 2L1Source: own processing (authors)2 Current ratio (L2)Indicator of cash ratio is closely connected with indicator L2, so current ratio,which is extended about short-term debt in the numerator. This also related with resultsof higher values of descriptive characteristics of the L2.As shown in Table 4 about current ratio, the number of companies analyzed inthe period 2000-2009 has not changed. Average and median describe in the period 2000––2003, that there reached slow upthrow of value current ratio. Since 2004 there has beenexpressive increase in liquidity. Consequently in 2007 there has been stagnation ofgrowth of liquidity and then in 2008 and 2009 slight decrease L2.State and development of the indicator L2 is also possible to assess upon thevalue of the range. While in 2000-2003 there was range from 3.47594 to 4.3202, since2004, this value step by step increased to the value 9.89902 in 2007 and second bestvalue was achieved in 2009. Upper and lower quartile deal that 50% of enterprises withnonextreme conditions is in the range from 0.397258 to 1.43886.164
- Page 1 and 2:
5/54Zeszyty NaukoweSzko³y G³ówne
- Page 3 and 4:
RADA PROGRAMOWABogdan Klepacki (SGG
- Page 5 and 6:
Rizovová Beáta, Gašparíkov Vero
- Page 7 and 8:
Według średniego wariantu szacunk
- Page 9 and 10:
Kluczowa dla zrozumienia możliwoś
- Page 11 and 12:
Deklaracji w zakresie praw politycz
- Page 13 and 14:
ezpieczeństwa żywnościowego powi
- Page 15 and 16:
zbóż drastyczne wzrosły z dużym
- Page 17 and 18:
11. Międzynarodowy Pakt Praw Gospo
- Page 19 and 20:
Figure 1. Structure of sales area s
- Page 21 and 22:
Figure 3. Structure of retail sales
- Page 23 and 24:
etail sector is also particularly i
- Page 25 and 26:
• modernity - the introduction of
- Page 27 and 28:
time, place and form. Trade respons
- Page 29 and 30:
The retailer must sometimes very qu
- Page 31 and 32:
equipped with a pretty clear sign t
- Page 33 and 34:
them. Also, very often the wrong wa
- Page 35 and 36:
liquidated. Currently, fruit and ve
- Page 37 and 38:
5 (54) 2011Jarosław GołębiewskiZ
- Page 39 and 40:
nowe formy zawierania transakcji, o
- Page 41 and 42:
koszty połączeń internetowych or
- Page 43 and 44:
on ewoluować z poziomu taktycznego
- Page 45 and 46:
Rysunek 1. Model 3iUczciwość mark
- Page 47 and 48:
produkcji, system informacyjny, sys
- Page 49 and 50:
hiperkonkurencja, problemy środowi
- Page 51 and 52:
5 (54) 2011Ing. Katarína Kleinová
- Page 53 and 54:
Why is it important to have a good
- Page 55 and 56:
oles in international relations, tr
- Page 57 and 58:
Scheme 2 Do you think that the inha
- Page 59 and 60:
REFERENCES[1] GfK USA. 2011. The An
- Page 61 and 62:
potrzeba przetrwanie skutków globa
- Page 63 and 64:
Rysunek 2. Liczba zakładów ubezpi
- Page 65 and 66:
Wzrastający udział w rynku stanow
- Page 67 and 68:
W 2002 r. poprzez placówki bankowe
- Page 69 and 70:
Portugalii, czy Włoch, gdzie udzia
- Page 71 and 72:
companies from the Polish Financial
- Page 73 and 74:
The increase in advertising expendi
- Page 75 and 76:
memo ability ads an advertisement b
- Page 77 and 78:
the sales can be find out from the
- Page 79 and 80:
5 (54) 2011Ľubica Kubicová, Zdenk
- Page 81 and 82:
Graph 1: Consumption of Milk and Da
- Page 83 and 84:
Graph 3: Consumption of Yoghurt per
- Page 85 and 86:
On the basis of the income elastici
- Page 87 and 88:
Producers of Activia Sweet Strawber
- Page 89 and 90:
ConclusionWhen the new product come
- Page 91 and 92:
them in the best possible way with
- Page 93 and 94:
"The integration of business practi
- Page 95 and 96:
DJSI indexes belong to the world's
- Page 97 and 98:
space for staff training in this ar
- Page 99 and 100:
Policy to the community:11. Does yo
- Page 101 and 102:
SummarySocial responsibility and et
- Page 103 and 104:
prowadzi do zwiększenia bieżącej
- Page 105 and 106:
ozwijające się wskazują na wyst
- Page 107 and 108:
wykorzystanych w dalszej części o
- Page 109 and 110:
Tabl. 1. Wyniki oszacowania paramet
- Page 111 and 112:
8 16,4 83,6 24,1 75,910 22,1 77,9 2
- Page 113 and 114: Z kolei, uwzględniając współczy
- Page 115 and 116: Literatura1. Diamond P.: National d
- Page 117 and 118: - przemysł spożywczy,- handel i d
- Page 119 and 120: żywnościowego nie należy bowiem
- Page 121 and 122: wpływ na swoje towary. Rolnik musi
- Page 123 and 124: produktów i usług do konsumentów
- Page 125 and 126: Specyfika marketingu w agrobiznesie
- Page 127 and 128: maksymalizację zysku, na pragnieni
- Page 129 and 130: dóbr i usług wybranym klientom w
- Page 131 and 132: 14. Pilarczyk B., Nestorowicz R., M
- Page 133 and 134: Fibres from sunflower stems are use
- Page 135 and 136: the incoming world economic crisis,
- Page 137 and 138: Tab 4 Break-event points of sunflow
- Page 139 and 140: 5 (54) 2011Beáta Rizovová, Veroni
- Page 141 and 142: CostsImportance ofmedia withincommu
- Page 143 and 144: 4 TABLE 3. TOP 10 ADVERTISERS AND T
- Page 145 and 146: Own surveyFor processing the proble
- Page 147 and 148: Following chart 3 give a review of
- Page 149 and 150: Information about authorsIng. Veron
- Page 151 and 152: 27 also agreed to further cut direc
- Page 153 and 154: In new EU budget perspective for th
- Page 155 and 156: Table 2 shows agrarian commodities
- Page 157 and 158: Contact AddressIng. Patrik Rovný,
- Page 159 and 160: welcomed by agrarian producers with
- Page 161 and 162: they receive until December and in
- Page 163: Table 1 Structure of agricultural e
- Page 167 and 168: 3 Total liquidity (L3)Analysis of l
- Page 169 and 170: make effort for its development and
- Page 171 and 172: 5 (54) 2011Dušan ŠimoForeign trad
- Page 173 and 174: the sales network of food chains an
- Page 175 and 176: Table 3 shows the significantly inc
- Page 177 and 178: 5 (54) 2011Dariusz StrzębickiSelli
- Page 179 and 180: • monetary value of agricultural
- Page 181 and 182: Figure 2. The website of the citrus
- Page 183 and 184: service, to reduce promotional cost
- Page 185 and 186: • USDA Never Ever Three - means t
- Page 187 and 188: quality. The products offered on th
- Page 189 and 190: Many of these electronic commerce B
- Page 191 and 192: commodities the market also offers
- Page 193 and 194: • thanks to the electronic market
- Page 195 and 196: delivery points. The warehouses are
- Page 197 and 198: 10. Stone J.: Local farmers sell pr
- Page 199 and 200: - Means to finance the start of com
- Page 201 and 202: of investment in EUR is 132 776 and
- Page 203 and 204: Table no. 3 Overview of suitable fi
- Page 205 and 206: Slovakia lags behind not only the c
- Page 207 and 208: The main sources of information in
- Page 209 and 210: 5 (54) 2011Marián TóthImpact of C
- Page 211 and 212: ResultsTaking into account the comp
- Page 213 and 214: possible and the importance of subs
- Page 215 and 216:
Figure 3Profit/hectare of agricultu