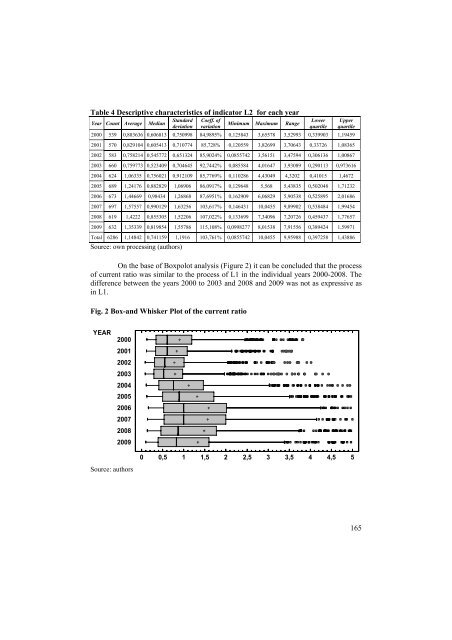
Table 4 Descriptive characteristics of indicator L2 for each yearYear Count AverageMedianStandarddeviationCoeff. ofvariationMinimum Maximum RangeLowerquartileUpperquartile2000 539 0,883636 0,606813 0,750998 84,9895% 0,125843 3,65578 3,52993 0,339903 1,194592001 570 0,829104 0,605413 0,710774 85,728% 0,120559 3,82699 3,70643 0,33726 1,083652002 583 0,758214 0,545772 0,651324 85,9024% 0,0855742 3,56151 3,47594 0,306136 1,008672003 660 0,759773 0,523409 0,704645 92,7442% 0,085584 4,01647 3,93089 0,290113 0,9736162004 624 1,06335 0,756021 0,912109 85,7769% 0,110286 4,43049 4,3202 0,41015 1,46722005 689 1,24176 0,882829 1,06906 86,0917% 0,129648 5,568 5,43835 0,502048 1,712322006 673 1,44669 0,98434 1,26868 87,6951% 0,162909 6,06829 5,90538 0,525895 2,016862007 697 1,57557 0,990129 1,63256 103,617% 0,146431 10,0455 9,89902 0,538484 1,994542008 619 1,4222 0,855305 1,52206 107,022% 0,133699 7,34096 7,20726 0,459437 1,776572009 632 1,35339 0,819854 1,55786 115,108% 0,0998277 8,01538 7,91556 0,389424 1,59971Total 6286 1,14842 0,741159 1,1916 103,761% 0,0855742 10,0455 9,95988 0,397258 1,43886Source: own processing (authors)On the base of Boxpolot analysis (Figure 2) it can be concluded that the processof current ratio was similar to the process of L1 in the individual years 2000-2008. Thedifference between the years 2000 to 2003 and 2008 and 2009 was not as expressive asin L1.Fig. 2 Box-and Whisker Plot of the current ratioYEAR2000200120022003200420052006200720082009Source: authors0 0,5 1 1,5 2 2,5 3 3,5 4 4,5 5165
3 Total liquidity (L3)Analysis of liquidity is completed with the total liquidity, where the numeratorincludes stocks that have compared to other items of numerator lower liquidity.Table 5 presents total liquidity on the basic of descriptive characteristics.Number of analyzed enterprises in the period 2000-2009 remained unchanged. As theaverage describes for the period 2000-2003 there was step by step decrease in the valueof the degree of liquidity. Since 2004, the value of average gradually increased until2007, but value of median in the column slightly falled, the reason is the increasingnumber of analyzed enterprises in different years of measurement.The value of liquidity by the upper and lower quartile presents that 50% ofenterprises with nonextreme conditions is the range from 1.00944 to 3.06851.Table 5 Descriptive characteristics of indicator L3 for each yearStandard Coeff. ofLower UpperYEAR Count Average MedianMinimum Maximum Rangedeviation variationquartile quartile2000 539 2,18716 1,61038 1,65292 75,5736% 0,378704 8,25978 7,88107 0,997774 2,984142001 570 2,08786 1,52278 1,63685 78,3985% 0,418619 9,27229 8,85367 0,949442 2,685742002 583 2,01173 1,46165 1,56614 77,8505% 0,374687 8,25305 7,87836 0,904405 2,626242003 660 1,85499 1,38929 1,47657 79,5997% 0,33385 8,56222 8,22837 0,829572 2,421532004 624 2,27455 1,64135 1,75521 77,1672% 0,42311 8,64164 8,21853 1,01528 2,940322005 689 2,3618 1,74495 1,86204 78,8399% 0,398353 9,85087 9,45251 1,03846 3,232562006 673 2,75638 1,90515 2,18639 79,321% 0,459298 10,3333 9,87404 1,16446 3,797742007 697 2,79627 1,86564 2,50834 89,703% 0,408594 14,5341 14,1255 1,10484 3,759942008 619 2,67049 1,77098 2,2388 83,8348% 0,490468 10,6469 10,1564 1,13176 3,553582009 632 2,48974 1,54117 2,55941 102,798% 0,361553 13,7576 13,396 0,957414 2,90115Total 6286 2,36133 1,64224 2,01808 85,4637% 0,33385 14,5341 14,2002 1,00944 3,06851Source: own processing (authors)Fig. 3 Box-and Whisker Plot of the total liquidityYEAR2000200120022003200420052006200720082009Source: authors0 3 6 9 12L3166
- Page 1 and 2:
5/54Zeszyty NaukoweSzko³y G³ówne
- Page 3 and 4:
RADA PROGRAMOWABogdan Klepacki (SGG
- Page 5 and 6:
Rizovová Beáta, Gašparíkov Vero
- Page 7 and 8:
Według średniego wariantu szacunk
- Page 9 and 10:
Kluczowa dla zrozumienia możliwoś
- Page 11 and 12:
Deklaracji w zakresie praw politycz
- Page 13 and 14:
ezpieczeństwa żywnościowego powi
- Page 15 and 16:
zbóż drastyczne wzrosły z dużym
- Page 17 and 18:
11. Międzynarodowy Pakt Praw Gospo
- Page 19 and 20:
Figure 1. Structure of sales area s
- Page 21 and 22:
Figure 3. Structure of retail sales
- Page 23 and 24:
etail sector is also particularly i
- Page 25 and 26:
• modernity - the introduction of
- Page 27 and 28:
time, place and form. Trade respons
- Page 29 and 30:
The retailer must sometimes very qu
- Page 31 and 32:
equipped with a pretty clear sign t
- Page 33 and 34:
them. Also, very often the wrong wa
- Page 35 and 36:
liquidated. Currently, fruit and ve
- Page 37 and 38:
5 (54) 2011Jarosław GołębiewskiZ
- Page 39 and 40:
nowe formy zawierania transakcji, o
- Page 41 and 42:
koszty połączeń internetowych or
- Page 43 and 44:
on ewoluować z poziomu taktycznego
- Page 45 and 46:
Rysunek 1. Model 3iUczciwość mark
- Page 47 and 48:
produkcji, system informacyjny, sys
- Page 49 and 50:
hiperkonkurencja, problemy środowi
- Page 51 and 52:
5 (54) 2011Ing. Katarína Kleinová
- Page 53 and 54:
Why is it important to have a good
- Page 55 and 56:
oles in international relations, tr
- Page 57 and 58:
Scheme 2 Do you think that the inha
- Page 59 and 60:
REFERENCES[1] GfK USA. 2011. The An
- Page 61 and 62:
potrzeba przetrwanie skutków globa
- Page 63 and 64:
Rysunek 2. Liczba zakładów ubezpi
- Page 65 and 66:
Wzrastający udział w rynku stanow
- Page 67 and 68:
W 2002 r. poprzez placówki bankowe
- Page 69 and 70:
Portugalii, czy Włoch, gdzie udzia
- Page 71 and 72:
companies from the Polish Financial
- Page 73 and 74:
The increase in advertising expendi
- Page 75 and 76:
memo ability ads an advertisement b
- Page 77 and 78:
the sales can be find out from the
- Page 79 and 80:
5 (54) 2011Ľubica Kubicová, Zdenk
- Page 81 and 82:
Graph 1: Consumption of Milk and Da
- Page 83 and 84:
Graph 3: Consumption of Yoghurt per
- Page 85 and 86:
On the basis of the income elastici
- Page 87 and 88:
Producers of Activia Sweet Strawber
- Page 89 and 90:
ConclusionWhen the new product come
- Page 91 and 92:
them in the best possible way with
- Page 93 and 94:
"The integration of business practi
- Page 95 and 96:
DJSI indexes belong to the world's
- Page 97 and 98:
space for staff training in this ar
- Page 99 and 100:
Policy to the community:11. Does yo
- Page 101 and 102:
SummarySocial responsibility and et
- Page 103 and 104:
prowadzi do zwiększenia bieżącej
- Page 105 and 106:
ozwijające się wskazują na wyst
- Page 107 and 108:
wykorzystanych w dalszej części o
- Page 109 and 110:
Tabl. 1. Wyniki oszacowania paramet
- Page 111 and 112:
8 16,4 83,6 24,1 75,910 22,1 77,9 2
- Page 113 and 114:
Z kolei, uwzględniając współczy
- Page 115 and 116: Literatura1. Diamond P.: National d
- Page 117 and 118: - przemysł spożywczy,- handel i d
- Page 119 and 120: żywnościowego nie należy bowiem
- Page 121 and 122: wpływ na swoje towary. Rolnik musi
- Page 123 and 124: produktów i usług do konsumentów
- Page 125 and 126: Specyfika marketingu w agrobiznesie
- Page 127 and 128: maksymalizację zysku, na pragnieni
- Page 129 and 130: dóbr i usług wybranym klientom w
- Page 131 and 132: 14. Pilarczyk B., Nestorowicz R., M
- Page 133 and 134: Fibres from sunflower stems are use
- Page 135 and 136: the incoming world economic crisis,
- Page 137 and 138: Tab 4 Break-event points of sunflow
- Page 139 and 140: 5 (54) 2011Beáta Rizovová, Veroni
- Page 141 and 142: CostsImportance ofmedia withincommu
- Page 143 and 144: 4 TABLE 3. TOP 10 ADVERTISERS AND T
- Page 145 and 146: Own surveyFor processing the proble
- Page 147 and 148: Following chart 3 give a review of
- Page 149 and 150: Information about authorsIng. Veron
- Page 151 and 152: 27 also agreed to further cut direc
- Page 153 and 154: In new EU budget perspective for th
- Page 155 and 156: Table 2 shows agrarian commodities
- Page 157 and 158: Contact AddressIng. Patrik Rovný,
- Page 159 and 160: welcomed by agrarian producers with
- Page 161 and 162: they receive until December and in
- Page 163 and 164: Table 1 Structure of agricultural e
- Page 165: the year 2004 the change in the lev
- Page 169 and 170: make effort for its development and
- Page 171 and 172: 5 (54) 2011Dušan ŠimoForeign trad
- Page 173 and 174: the sales network of food chains an
- Page 175 and 176: Table 3 shows the significantly inc
- Page 177 and 178: 5 (54) 2011Dariusz StrzębickiSelli
- Page 179 and 180: • monetary value of agricultural
- Page 181 and 182: Figure 2. The website of the citrus
- Page 183 and 184: service, to reduce promotional cost
- Page 185 and 186: • USDA Never Ever Three - means t
- Page 187 and 188: quality. The products offered on th
- Page 189 and 190: Many of these electronic commerce B
- Page 191 and 192: commodities the market also offers
- Page 193 and 194: • thanks to the electronic market
- Page 195 and 196: delivery points. The warehouses are
- Page 197 and 198: 10. Stone J.: Local farmers sell pr
- Page 199 and 200: - Means to finance the start of com
- Page 201 and 202: of investment in EUR is 132 776 and
- Page 203 and 204: Table no. 3 Overview of suitable fi
- Page 205 and 206: Slovakia lags behind not only the c
- Page 207 and 208: The main sources of information in
- Page 209 and 210: 5 (54) 2011Marián TóthImpact of C
- Page 211 and 212: ResultsTaking into account the comp
- Page 213 and 214: possible and the importance of subs
- Page 215 and 216: Figure 3Profit/hectare of agricultu