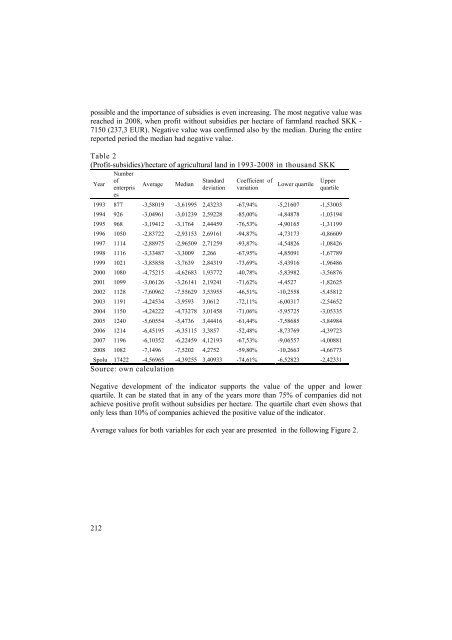
Average value of the variable profit per hectare of agricultural land ranged from -1369SKK (-45,5 EUR) in 1993 to 1327 SKK (40,1 EUR) in 2007. It is possible to evaluatethat in the studied enterprises the situation regarding profit has improved after joiningthe EU in 2004, since the average value of this variable is always positive.The comparison of the average of the whole period, with a median for the whole periodshows that the median value is higher which means that after the removal of "extreme"values the situation in the enterprises regarding profit per hectare is better.Table 1Profit/hectare of agricultural land in 1993-2008 in thousand SKKYearNumberofenterprisesAverageMedianStandarddeviationCoefficient ofvariationLower quartileUpperquartile1993 876 -1,36916 -0,95711 2,13742 -156,11% -2,63961 0,1134481994 926 -0,85106 -0,30771 2,22308 -261,21% -2,14176 0,4075121995 967 -0,53347 0,016929 2,02088 -378,82% -1,64426 0,5871161996 1043 -0,19691 0,070661 2,1772 -1105,70% -1,3252 0,7760221997 1110 0,147952 0,184646 2,29722 1552,68% -1,01394 1,284421998 1116 -0,28249 0,07339 2,18269 -772,67% -1,58575 0,8070361999 1088 -0,37452 0,054228 2,24318 -598,95% -1,63384 0,8423242000 1080 -0,49021 0,02074 1,67976 -342,66% -1,39941 0,3913942001 1094 0,543616 0,233906 1,65396 304,25% 0 1,002652002 1099 0,393741 0,218617 1,68378 427,64% 0,01056 0,7916672003 1173 -0,98165 0,010922 2,7166 -276,74% -2,37653 0,3418762004 1132 1,14246 0,685072 2,15638 188,75% 0,141794 1,853992005 1226 0,322753 0,283255 2,60512 807,16% 0,016628 1,244342006 1216 0,711543 0,468867 2,48736 349,57% 0,073099 1,502882007 1179 1,32697 0,825353 2,28857 172,47% 0,189973 2,254442008 1097 0,780658 0,488346 2,69527 345,26% 0,033435 1,78015Spolu 17422 0,060521 0,171171 2,35705 3894,56% -0,91338 1,00483Source: own calculationEvaluation of variability by the standard deviation and coefficient of variation isrelatively complicated. Both descriptive statistics are high and we can conclude that thevariability of profit per hectare in enterprises is high. The positive trend can be observedon the development of the coefficient of variation, positive in each period.The development of the upper and lower quartiles can be summarized as that since 2004more than 75% of businesses have achieved a positive ratio of profit per hectare. In theperiod 1993-2003 the similar situation was observed only in two periods.Another table (number 2) contains the descriptive characteristics of the development ofthe ratio profit minus the subsidy per hectare of farmland. Compared with the firstindicator the average during the whole period did not reach value higher than 0. Fromthis fact, it is possible to conclude that the management of farms without subsidies is not211
possible and the importance of subsidies is even increasing. The most negative value wasreached in 2008, when profit without subsidies per hectare of farmland reached SKK -7150 (237,3 EUR). Negative value was confirmed also by the median. During the entirereported period the median had negative value.Table 2(Profit-subsidies)/hectare of agricultural land in 1993-2008 in thousand SKKYearNumberofenterprisesAverageMedianStandarddeviationCoefficient ofvariationLower quartileUpperquartile1993 877 -3,58019 -3,61995 2,43233 -67,94% -5,21607 -1,530031994 926 -3,04961 -3,01239 2,59228 -85,00% -4,84878 -1,031941995 968 -3,19412 -3,1764 2,44459 -76,53% -4,90165 -1,311991996 1050 -2,83722 -2,93153 2,69161 -94,87% -4,73173 -0,866091997 1114 -2,88975 -2,96509 2,71259 -93,87% -4,54826 -1,084261998 1116 -3,33487 -3,3009 2,266 -67,95% -4,85091 -1,677891999 1021 -3,85858 -3,7639 2,84319 -73,69% -5,43916 -1,964862000 1080 -4,75215 -4,62683 1,93772 -40,78% -5,83982 -3,568762001 1099 -3,06126 -3,26141 2,19241 -71,62% -4,4527 -1,826252002 1128 -7,60962 -7,55629 3,53955 -46,51% -10,2558 -5,458122003 1191 -4,24534 -3,9593 3,0612 -72,11% -6,00317 -2,546522004 1150 -4,24222 -4,73278 3,01458 -71,06% -5,95725 -3,053352005 1240 -5,60554 -5,4736 3,44416 -61,44% -7,58685 -3,849842006 1214 -6,45195 -6,35115 3,3857 -52,48% -8,73769 -4,397232007 1196 -6,10352 -6,22459 4,12193 -67,53% -9,06557 -4,008812008 1082 -7,1496 -7,5202 4,2752 -59,80% -10,2663 -4,66773Spolu 17422 -4,56965 -4,39255 3,40933 -74,61% -6,52823 -2,42331Source: own calculationNegative development of the indicator supports the value of the upper and lowerquartile. It can be stated that in any of the years more than 75% of companies did notachieve positive profit without subsidies per hectare. The quartile chart even shows thatonly less than 10% of companies achieved the positive value of the indicator.Average values for both variables for each year are presented in the following Figure 2.212
- Page 1 and 2:
5/54Zeszyty NaukoweSzko³y G³ówne
- Page 3 and 4:
RADA PROGRAMOWABogdan Klepacki (SGG
- Page 5 and 6:
Rizovová Beáta, Gašparíkov Vero
- Page 7 and 8:
Według średniego wariantu szacunk
- Page 9 and 10:
Kluczowa dla zrozumienia możliwoś
- Page 11 and 12:
Deklaracji w zakresie praw politycz
- Page 13 and 14:
ezpieczeństwa żywnościowego powi
- Page 15 and 16:
zbóż drastyczne wzrosły z dużym
- Page 17 and 18:
11. Międzynarodowy Pakt Praw Gospo
- Page 19 and 20:
Figure 1. Structure of sales area s
- Page 21 and 22:
Figure 3. Structure of retail sales
- Page 23 and 24:
etail sector is also particularly i
- Page 25 and 26:
• modernity - the introduction of
- Page 27 and 28:
time, place and form. Trade respons
- Page 29 and 30:
The retailer must sometimes very qu
- Page 31 and 32:
equipped with a pretty clear sign t
- Page 33 and 34:
them. Also, very often the wrong wa
- Page 35 and 36:
liquidated. Currently, fruit and ve
- Page 37 and 38:
5 (54) 2011Jarosław GołębiewskiZ
- Page 39 and 40:
nowe formy zawierania transakcji, o
- Page 41 and 42:
koszty połączeń internetowych or
- Page 43 and 44:
on ewoluować z poziomu taktycznego
- Page 45 and 46:
Rysunek 1. Model 3iUczciwość mark
- Page 47 and 48:
produkcji, system informacyjny, sys
- Page 49 and 50:
hiperkonkurencja, problemy środowi
- Page 51 and 52:
5 (54) 2011Ing. Katarína Kleinová
- Page 53 and 54:
Why is it important to have a good
- Page 55 and 56:
oles in international relations, tr
- Page 57 and 58:
Scheme 2 Do you think that the inha
- Page 59 and 60:
REFERENCES[1] GfK USA. 2011. The An
- Page 61 and 62:
potrzeba przetrwanie skutków globa
- Page 63 and 64:
Rysunek 2. Liczba zakładów ubezpi
- Page 65 and 66:
Wzrastający udział w rynku stanow
- Page 67 and 68:
W 2002 r. poprzez placówki bankowe
- Page 69 and 70:
Portugalii, czy Włoch, gdzie udzia
- Page 71 and 72:
companies from the Polish Financial
- Page 73 and 74:
The increase in advertising expendi
- Page 75 and 76:
memo ability ads an advertisement b
- Page 77 and 78:
the sales can be find out from the
- Page 79 and 80:
5 (54) 2011Ľubica Kubicová, Zdenk
- Page 81 and 82:
Graph 1: Consumption of Milk and Da
- Page 83 and 84:
Graph 3: Consumption of Yoghurt per
- Page 85 and 86:
On the basis of the income elastici
- Page 87 and 88:
Producers of Activia Sweet Strawber
- Page 89 and 90:
ConclusionWhen the new product come
- Page 91 and 92:
them in the best possible way with
- Page 93 and 94:
"The integration of business practi
- Page 95 and 96:
DJSI indexes belong to the world's
- Page 97 and 98:
space for staff training in this ar
- Page 99 and 100:
Policy to the community:11. Does yo
- Page 101 and 102:
SummarySocial responsibility and et
- Page 103 and 104:
prowadzi do zwiększenia bieżącej
- Page 105 and 106:
ozwijające się wskazują na wyst
- Page 107 and 108:
wykorzystanych w dalszej części o
- Page 109 and 110:
Tabl. 1. Wyniki oszacowania paramet
- Page 111 and 112:
8 16,4 83,6 24,1 75,910 22,1 77,9 2
- Page 113 and 114:
Z kolei, uwzględniając współczy
- Page 115 and 116:
Literatura1. Diamond P.: National d
- Page 117 and 118:
- przemysł spożywczy,- handel i d
- Page 119 and 120:
żywnościowego nie należy bowiem
- Page 121 and 122:
wpływ na swoje towary. Rolnik musi
- Page 123 and 124:
produktów i usług do konsumentów
- Page 125 and 126:
Specyfika marketingu w agrobiznesie
- Page 127 and 128:
maksymalizację zysku, na pragnieni
- Page 129 and 130:
dóbr i usług wybranym klientom w
- Page 131 and 132:
14. Pilarczyk B., Nestorowicz R., M
- Page 133 and 134:
Fibres from sunflower stems are use
- Page 135 and 136:
the incoming world economic crisis,
- Page 137 and 138:
Tab 4 Break-event points of sunflow
- Page 139 and 140:
5 (54) 2011Beáta Rizovová, Veroni
- Page 141 and 142:
CostsImportance ofmedia withincommu
- Page 143 and 144:
4 TABLE 3. TOP 10 ADVERTISERS AND T
- Page 145 and 146:
Own surveyFor processing the proble
- Page 147 and 148:
Following chart 3 give a review of
- Page 149 and 150:
Information about authorsIng. Veron
- Page 151 and 152:
27 also agreed to further cut direc
- Page 153 and 154:
In new EU budget perspective for th
- Page 155 and 156:
Table 2 shows agrarian commodities
- Page 157 and 158:
Contact AddressIng. Patrik Rovný,
- Page 159 and 160:
welcomed by agrarian producers with
- Page 161 and 162: they receive until December and in
- Page 163 and 164: Table 1 Structure of agricultural e
- Page 165 and 166: the year 2004 the change in the lev
- Page 167 and 168: 3 Total liquidity (L3)Analysis of l
- Page 169 and 170: make effort for its development and
- Page 171 and 172: 5 (54) 2011Dušan ŠimoForeign trad
- Page 173 and 174: the sales network of food chains an
- Page 175 and 176: Table 3 shows the significantly inc
- Page 177 and 178: 5 (54) 2011Dariusz StrzębickiSelli
- Page 179 and 180: • monetary value of agricultural
- Page 181 and 182: Figure 2. The website of the citrus
- Page 183 and 184: service, to reduce promotional cost
- Page 185 and 186: • USDA Never Ever Three - means t
- Page 187 and 188: quality. The products offered on th
- Page 189 and 190: Many of these electronic commerce B
- Page 191 and 192: commodities the market also offers
- Page 193 and 194: • thanks to the electronic market
- Page 195 and 196: delivery points. The warehouses are
- Page 197 and 198: 10. Stone J.: Local farmers sell pr
- Page 199 and 200: - Means to finance the start of com
- Page 201 and 202: of investment in EUR is 132 776 and
- Page 203 and 204: Table no. 3 Overview of suitable fi
- Page 205 and 206: Slovakia lags behind not only the c
- Page 207 and 208: The main sources of information in
- Page 209 and 210: 5 (54) 2011Marián TóthImpact of C
- Page 211: ResultsTaking into account the comp
- Page 215 and 216: Figure 3Profit/hectare of agricultu