Minmetals Resources Limited 2011 Sustainability Report (PDF)
Minmetals Resources Limited 2011 Sustainability Report (PDF)
Minmetals Resources Limited 2011 Sustainability Report (PDF)

Create successful ePaper yourself
Turn your PDF publications into a flip-book with our unique Google optimized e-Paper software.
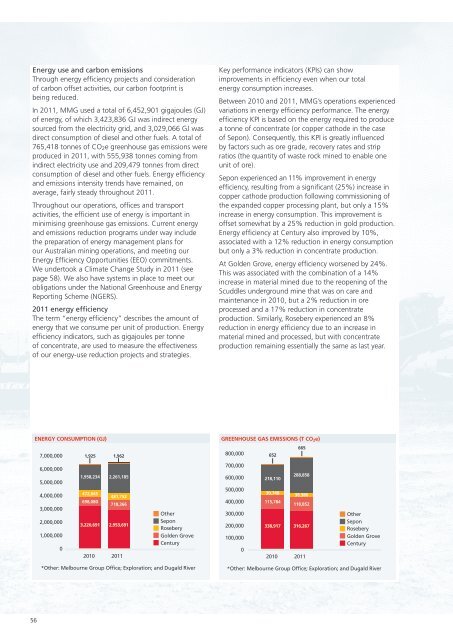
unityEnergy use and carbon emissionsThrough energy efficiency projects and considerationof carbon offset activities, our carbon footprint isbeing reduced.In <strong>2011</strong>, MMG used a total of 6,452,901 718,366gigajoules (GJ)of energy, of which 3,423,836 GJ 481,752 was indirect energysourced from the electricity grid, and 3,029,066 GJ wasdirect consumption of diesel and other fuels. A total of765,418 tonnes of CO 2 e greenhouse27,020gas emissions wereproduced in <strong>2011</strong>, with 555,9388,925tonnes coming fromindirect electricity use and 209,479 1,962 tonnes from directconsumption of diesel and other fuels. Energy efficiencyand emissions intensity trends have remained, onaverage, fairly steady throughout <strong>2011</strong>.Throughout our operations, offices and transportactivities, the efficient use of energy is important inminimising greenhouse gas emissions. Current energyand emissions reduction programs under way includethe preparation6000of energy management plans for 2010our Australian 5000<strong>2011</strong>mining operations, and meeting ourEnergy Efficiency 4000 Opportunities (EEO) commitments.We undertook Location 3000 a Climate Change Study in <strong>2011</strong> (seepage 58). We also have systems in place to meet our2000obligations under the National Greenhouse and Energy1000<strong>Report</strong>ing Scheme (NGERS).tal Energy Consumption (GJ) <strong>2011</strong> Total Energy Consumption (GJ)1 2,953,6914 2,261,185<strong>2011</strong> energy efficiencyThe term “energy efficiency” describes the amount ofenergy that we consume per unit of production. Energyefficiency indicators, such as gigajoules per tonne*Corporate includes Dugald River project employeesof concentrate, are used to measure the effectivenessof our energy-use reduction projects and strategies.Key performance indicators (KPIs) can showimprovements in efficiency even when our totalenergy consumption increases.Between 2010 and <strong>2011</strong>, MMG’s operations experiencedvariations in energy efficiency performance. The energyefficiency KPI is based on the energy required to producea tonne of concentrate (or copper cathode in the caseof Sepon). Consequently, this KPI is greatly influencedby factors such as ore grade, recovery rates and stripratios (the quantity of waste rock mined to enable oneunit of ore).Sepon experienced an 11% improvement in energyefficiency, resulting from a significant (25%) increase incopper cathode production following commissioning ofthe expanded copper processing plant, but only a 15%increase in energy consumption. This improvement isoffset somewhat by a 25% reduction in gold production.Energy efficiency at Century also improved by 10%,associated with a 12% reduction in energy consumptionbut only a 3% reduction in concentrate production.At Golden Grove, energy efficiency worsened by 24%.This was associated with the combination of a 14%increase in material mined due to the reopening of theScuddles underground mine that was on care andmaintenance in 2010, but a 2% reduction in oreprocessed and a 17% reduction in concentrateproduction. Similarly, Rosebery experienced an 8%reduction in energy efficiency due to an increase inmaterial mined and processed, but with concentrateproduction remaining essentially the same as last year.2010 Total GHG Emissions (T CO2e) <strong>2011</strong> Total GHG Emissions (T CO2e)Century 338,917 316,267Golden Grove 115,784 118,852Rosebery 0 (inc Avebury) 30,748 38,388Sepon 218,110 288,858Dugald River 361 1,744Exploration 748 644Melbourne Group Office 652 665CENTURYGOLDENGROVEROSEBERYSEPONEXPLORATIONCORPORATEENERGY CONsUMPTION (GJ)GREENHOUSE GAS EMISSIONS (T CO 2 e)7,000,0008000006,000,0007000005,000,000 6000004,000,000 5000003,000,000 4000002,000,000 3000002000001,000,000100000001,925 1,9621,958,234 2,261,185472,845481,752698,080718,3663,220,691 2,953,6912010 <strong>2011</strong>OtherSeponRoseberyGolden GroveCentury800,000700,000600,000500,000400,000300,000200,000100,0000652218,11030,748115,784338,9172010665288,85838,388118,852316,267<strong>2011</strong>OtherSeponRoseberyGolden GroveCentury*Other: Melbourne Group Office; Exploration; and Dugald River*Other: Melbourne Group Office; Exploration; and Dugald River56